
INTRODUCTION
Cisplatin (cis-DDP, cis-diamminedichloroplatinum (II)), a platinum-based anti-tumor drug, is one of the most commonly used metal-containing compounds in medicine [1-3]. Cisplatin and its analogues (i.e., carboplatin and oxaliplatin) are among the most potent chemotherapy drugs used for cancer treatment [1, 3]. The discovery of cisplatin as an anti-cancer drug in the 1960s by Rosenberg and colleagues ushered in a new paradigm in cancer treatment [3, 4]. Cisplatin is thought to damage rapidly growing tumor cells via the induction of apoptosis following the inhibition of DNA synthesis and repair, resulting in cell cycle arrest at the G1, S, or G2-M phase [1, 5, 6]. Cisplatin has clinical benefits for several types of solid tumors. However, cisplatin treatment is frequently accompanied by toxic side effects and tumor resistance, which in turn leads to secondary malignancies [1-3].
In recent years, medical research has focused on elucidating the mechanisms underlying cancer drugs. The development of new techniques to identify perturbations in cellular functions has increased knowledge of the molecular, physiological and pathological mechanisms of cancer drugs. In particular, emerging evidence has revealed the complex interplay that exists between the host immune system and many anti-cancer drugs. However, little information is available regarding how cisplatin interacts with immune cells. Thus, a better understanding of the molecular mechanisms through which cisplatin induces and suppresses immunological responses is needed to develop and optimize new therapeutic strategies using cisplatin. In particular, cisplatin has been shown to induce immunosuppressive effects through the inhibition of T cell activity [7, 8]. However, little is known about how cisplatin suppresses innate and adaptive immunity.
Immunological interventions for tumor therapy have focused on two aspects: 1) immune cell-based tumor therapy such as dendritic cell (DC)-based tumor immunotherapy, and 2) immune checkpoint inhibition such as blocking PD-1/PD-L1. Although these two approaches differ, both enhance tumor-targeted Th1-type T cell immunity by harnessing immunological power or by overcoming tolerance and suppression [9-12]. In this regard, DCs are the most potent cell type involved in both strategies. In fact, DCs are the most important cell population for activating anti-tumor T cell responses. However, tumors can also directly or indirectly induce DCs to both functionally and phenotypically favor the tumor environment [12-14]. DC activation leads to a cascade of pro- or anti-inflammatory cytokine production, migration to secondary lymphoid tissues, and priming of naïve T cells. Therefore, these cells regulate immune homeostasis and the balance between tolerance and immunity [12, 13]. Most importantly, DCs play a critical role in regulating CD4 and CD8 T cell immunity by controlling Th1, Th2, and Th17 commitment; generating inducible Tregs; and mediating tolerance or immunostimulation [12, 13, 15]. It is believed that distinct DC subsets have evolved to control these different immune outcomes. However, how these DC subsets mount different responses to inflammatory and/or tolerogenic signals to accomplish their divergent functions remains unclear.
The effects of anti-cancer drugs on the immune system remain controversial. However, select chemotherapeutic agents primarily suppress DCs, and the effect of chemotherapeutic drugs on DC function requires further investigation in various inflammatory settings. In this context, we characterized the effect of cisplatin on the function of DCs, which play crucial roles in bridging innate and adaptive immunity. This study describes for the first time the key mechanisms involved in the switch to a tolerogenic DC phenotype that is induced by cisplatin following toll-like receptor (TLR) agonist activation of inflammation and the resulting consequences on T cell polarization.
RESULTS
Determination of a cisplatin concentration that does not reduce DC viability
Cisplatin at concentrations ≥ 25 μM or ≥10 μg/ml induces cell death of cancer cell lines and primary cultured cells, such as macrophages, via DNA fragmentation [16, 17]. Prior to conducting the current study, the viability of bone marrow-derived dendritic cells (BMDCs) exposed to cisplatin was investigated to determine a cisplatin concentration that does not cause cell death and could therefore be used in subsequent experiments. As expected, a cisplatin concentration over 10 μg/ml showed a cytotoxic effect on BMDCs when measured by MTT assay (Supplementary Figure S1A). Therefore, cisplatin concentrations ≤ 10 μg/ml were used for subsequent experiments, as these concentrations did not reduce cell viability. In addition, no significant decrease in DC viability following co-treatment with 10 μg/ml of cisplatin and 100 ng/ml of lipopolysaccharide (LPS) was observed by MTT assay (Supplementary Figure S1B) or Annexin V and propidium iodide (PI) staining (Supplementary Figure S1C). This finding suggests that cisplatin is not cytotoxic to DCs when used at concentrations below 10 μg/ml. Therefore, concentrations of 1 and/or 5 μg/ml of cisplatin were used for further investigation.
Cisplatin impairs the phenotypic maturation of LPS-activated DCs
Elevated expression of the co-stimulatory molecules CD80 and CD86 as well as MHC class I and II following TLR agonist stimulation is a key feature of mature DCs [18]. However, the immunological actions of cisplatin, especially on DC maturation and function, remain unknown. We therefore investigated whether treatment with cisplatin resulted in phenotypic alteration in DCs upon stimulation with LPS. To accomplish this, CD11c+ DCs were identified using the gating strategy shown in Figure 1A. The DCs were cultured for 8 days in OptiMEM supplemented with GM-CSF under standard conditions and then treated with LPS (100 ng/ml), cisplatin (5 μg/mL), or LPS (100 ng/mL) and cisplatin (1, 2, and 5 μg/mL) for one day. The cisplatin treatment significantly decreased the LPS-induced expression of the co-stimulatory molecules CD80 and CD86 and MHC class I and II in a dose-dependent manner, suggesting that cisplatin can alter the DC maturation phenotype. However, the DCs that were treated with cisplatin alone did not show any increases or decreases in these markers (Figure 1B). Importantly, the DCs that were co-treated with cisplatin (5 μg/mL) and LPS (100 ng/mL) showed significant reductions in the levels of the above surface molecules in a time-dependent manner (Supplementary Figure S2A).
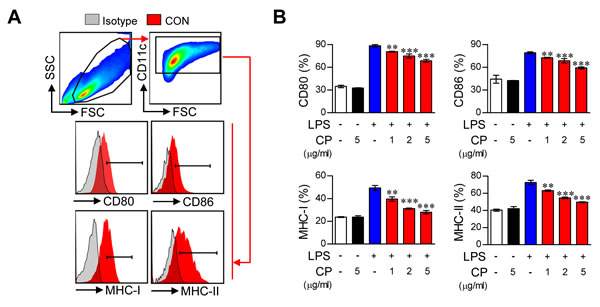
Figure 1: Cisplatin impaired the phenotypic maturation of LPS-activated DCs by down-regulating the expression of CD80, CD86, MHC-I and II in a dose-dependent manner. A.,B. CD11c+ immature BMDCs were cultured for 18 h in the presence of LPS (100 ng/ml), cisplatin (CP, 5 μg/mL), or LPS (100 ng/mL) with cisplatin (1, 2, and 5 μg/mL). The DCs were then stained with anti-CD80, anti-CD86, anti-MHC class I, or anti-MHC class II Abs. A. The surface marker expression of each DC set was compared to that of the controls. Isotype control (filled gray histogram), CON (non-stimulated DC, filled red histogram). B. The bar graphs show the mean ± SD (n = 3 samples) of the percentage of each surface molecule expressed by CD11c+ cells. The results are representative of three independent experiments. **p < 0.01 or ***p < 0.001 compared to DCs treated with LPS alone.
Cisplatin functionally induces TLR agonist-activated DCs toward a tolerogenic phenotype
The above findings suggest that cisplatin is involved in phenotypic alteration during TLR agonist-induced DC maturation. Thus, we hypothesized that cisplatin influences DC function by regulating cytokine production. To validate this hypothesis, we analyzed cytokine production in cisplatin-treated DCs following stimulation with various TLR ligands, including Pam3-CSK (TLR2), polyI:C (TLR3), LPS (TLR4), IMQ (TLR7), and ODN (TLR9). Surprisingly, for all of the tested TLR agonists, cisplatin dramatically increased the levels of the anti-inflammatory cytokine IL-10 in activated DCs. Furthermore, none of the tested TLR agonists inhibited or increased the production of other pro-inflammatory cytokines, such as TNF-α and IL-12 (Figure 2A and Supplementary Figure S3). These results indicate that cisplatin conditions DCs to produce a high amount of IL-10, independent of the specific TLR pathway being activated. Next, we confirmed that cisplatin strongly induced intracellular IL-10 production in LPS-activated DCs. We found that DCs co-treated with cisplatin and LPS exhibited a significantly higher percentage of IL-10-positive cells and that this percentage increased in a dose-dependent manner, whereas no changes were observed in the numbers of TNF-α-positive or IL-12p70-positive cells (Figure 2B). Additionally, the co-treated DCs showed increased production of IL-10 in a time-dependent manner, whereas no changes were observed in the production of TNF-α or IL-12p70 (Supplementary Figure S2B).
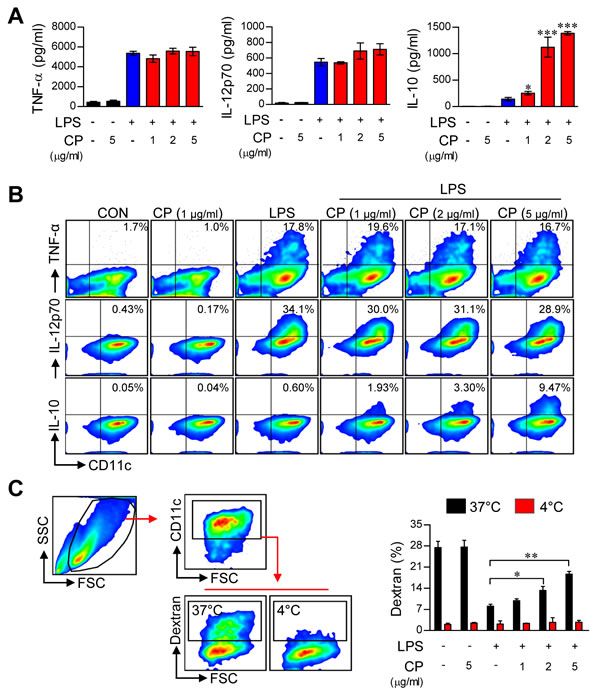
Figure 2: Cisplatin increased IL-10 production and endocytosis in LPS-activated DCs. A. BMDCs were treated with LPS (100 ng/mL) in the absence or presence of cisplatin at various concentrations (1, 2 and 5 μg/mL) for 18 h. The amounts of TNF-α, IL-12p70, and IL-10 in the culture supernatants were measured by ELISA. The data are shown as the mean ± SD (n = 3 samples). One representative plot out of three independent experiments is shown. *p < 0.05 and ***p < 0.001 compared to treatment with LPS alone. B. Intracellular TNF-α, IL-12p70 and IL-10 levels in CD11c+ DCs. One representative plot from three independent experiments is shown. C. The cells were incubated with FITC-dextran either at 37°C for 30 min or at 4°C as a control. Endocytic capacity was determined by assessing the endocytosis of FITC-dextran by flow cytometry (left panel). The bar graphs (right panel) indicate the mean ± SD (n = 3 samples) of the percentage of dextran-FITC-positive CD11c+ cells. The results are representative of three independent experiments. The values shown represent the mean ± SD (n = 3 samples). **p < 0.01 or ***p < 0.001 compared to DCs treated with LPS alone.
Cisplatin increases the endocytic activity of LPS-activated DCs
A decrease in endocytosis is a hallmark of mature DCs, whereas tolerogenic DCs maintain higher endocytic ability [19]. To evaluate whether the antigen uptake ability of LPS-activated DCs is increased or decreased by cisplatin treatment, DCs were activated by LPS in the absence or presence of cisplatin and then assessed for their ability to uptake antigens by endocytosis using FITC-conjugated dextran. A significantly lower percentage of FITC-positive DCs were observed among the LPS-stimulated DCs, while the cisplatin and LPS co-treatment enhanced the endocytic activity of DCs in a dose-dependent manner (Figure 2C). These results, together with the reduction of mature DC surface markers and the remarkable enhancement in IL-10 production, strongly suggest that cisplatin endows DCs with a tolerogenic property upon TLR stimulation.
Cisplatin induces IL-10 secretion through activation of the p38 MAPK and NF-κB signaling pathways
Activation of the MAPK, cyclooxegenase-2 (COX-2)/ prostaglandin E2 (PGE2) and NF-κB signaling cascades increases IL-10 secretion in DCs [20, 21]. To examine whether these pathways are involved in increased IL-10 production following treatment with cisplatin, the expression and phosphorylation levels of MAPKs, including p38, ERK, and JNK; the phosphorylation and degradation of IκB-α; and the nuclear translocation of NF-κB p65 were investigated by Western blot analysis (Figure 3). In DCs co-treated with cisplatin and LPS, rapid and prolonged p38 phosphorylation and slightly activated JNK phosphorylation was observed compared to DCs treated with LPS alone. Furthermore, ERK1/2 phosphorylation was decreased in the co-treated DCs compared to the DCs treated with LPS alone (Figure 3A). Importantly, treatment with cisplatin alone had no effect on MAPK expression and phosphorylation (Supplementary Figure S4A). Additionally, COX-2 activation and PGE-2 expression were not changed by cisplatin treatment (Supplementary Figure S4B). Cisplatin induced the phosphorylation and degradation of IkB-α and the nuclear translocation of p65 from the cytosol (Figure 3B and 3C). To confirm the involvement of p38, JNK, and NF-κB in the above phenotypes, we next treated cells with specific pharmacological inhibitors (SB203580 for p38, SP600125 for JNK, and Bay11-7082 for NF-κB) and cisplatin and then evaluated IL-10 production following the cisplatin treatment. These pharmacological inhibitors, particularly the p38 inhibitor, significantly abrogated cisplatin-induced IL-10 production in LPS-activated DCs (Figure 3D), suggesting that the p38 and NF-kB signaling cascades are the main pathways responsible for the cisplatin-induced production of IL-10 in LPS-activated DCs.
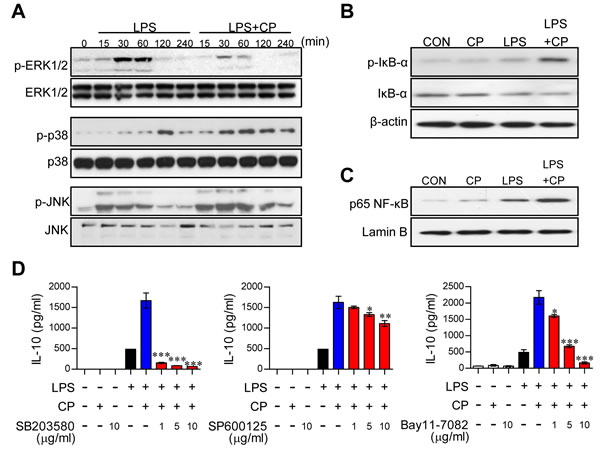
Figure 3: Cisplatin-induced IL-10 production in LPS-activated DCs involved the activation of the p38 MAPK and NF-κB signaling pathways. A. BMDCs were treated with LPS (100 ng/ml) in the absence or presence of cisplatin (5 μg/ml) for 0, 15, 30, 60, 120, and 240 min. Cell lysates were subjected to SDS-PAGE, and immunoblot analyses were performed using Abs specific to phospho-ERK1/2, phospho-JNK1/2 and phospho-p38. B., C. Cell lysates and nuclear lysates were subjected to SDS-PAGE, and immunoblot analyses were performed using Abs specific to phospho-IκB-α (p-IκB-α), non-phospho-IκB-α, and p65 NF-κB for 60 min. β-actin and lamin B were used as loading controls for the cytosolic and nuclear fractions, respectively. One representative plot out of three independent experiments is shown. D. BMDCs were treated with pharmacological inhibitors of p38 (SB203580), JNK (SP600125), or NF-κB (Bay11-7082) or DMSO (vehicle control) for 1 h prior to treatment with LPS in the absence or presence of cisplatin for 18 h. IL-10 levels in the culture medium were measured by ELISA. The values shown represent the mean ± SD from one representative plot out of three independent experiments; *p < 0.05, **p < 0.01, or ***p < 0.001 compared to DCs treated with LPS and cisplatin.
Cisplatin treatment conditions DCs to become tolerogenic through the IL-10 cascade
IL-10 induces the maturation and phenotypic alteration of DCs towards a tolerogenic state [22, 23]. Thus, we hypothesized that if cisplatin-induced increases in IL-10 production cause LPS-activated DCs to adopt a tolerogenic phenotype, the absence of IL-10 should restore an activated DC phenotype even in the presence of cisplatin. To investigate whether the IL-10 increase stimulated by cisplatin induces DC phenotypic and functional changes, DCs isolated from IL-10-/- mice were treated with cisplatin, LPS or a combination of cisplatin and LPS (Figure 4). The IL-10-/- DCs displayed the LPS-activated DC phenotype, including elevated levels of surface molecules (Figure 4A) and reduced endocytic activity (Figure 4C). However, increased levels of pro-inflammatory cytokines (TNF-α and IL-12p70) and decreased levels of the anti-inflammatory cytokine IL-10 were observed in the IL-10-/- DCs compared to WT DCs following co-treatment with LPS and cisplatin (Figure 4B). We further confirmed that IL-10 induces LPS-activated DCs to become tolerogenic following cisplatin treatment through experiments in which we blocked the IL-10 cascade with an anti-IL-10 monoclonal antibody (mAb) (Figure 5). Incubation of the co-treated DCs with an anti-IL-10 mAb, but not with control rat IgG, for 18 h restored their surface molecule expression levels (Figure 5A) and IL-12p70 production (Figure 5B) and decreased their endocytic activity (Figure 5C). Collectively, these results indicate that the cisplatin-induced tolerogenic DC phenotype requires IL-10.
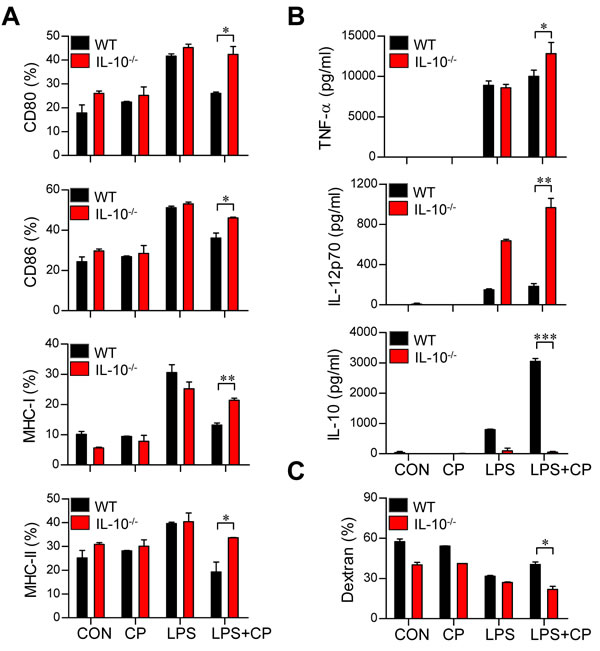
Figure 4: The IL-10 cascade induced cisplatin/LPS-primed DCs to adopt a tolerogenic phenotype. A., B., C. BMDCs were generated from WT and IL-10-/- mice. The DCs were treated with LPS (100 ng/ml), cisplatin (5 μg/mL), or LPS with cisplatin. A. After 18 h, the expression of CD80, CD86, and MHC class I and II on the DCs was assessed. B. TNF-α, IL-12p70 and IL-10 levels in the supernatants of DCs from WT and IL-10-/- mice treated with LPS, cisplatin or LPS with cisplatin were measured by ELISA.C. Endocytic activity of DCs from WT and IL-10-/- mice treated with LPS, cisplatin or LPS and cisplatin was assessed at 37°C by evaluating the uptake of FITC-conjugated dextran. The results show are representative of three independent experiments and expressed as the mean ± SD (n = 3 samples). *p < 0.05, **p < 0.01 and ***p < 0.001 when comparing the WT DCs and IL-10-/- DCs before and after treatment with LPS and cisplatin.
Cisplatin-treated DCs reduce the proliferation of T cells and alter the polarization of T cells
Cisplatin treatment in LPS-activated DCs induced them to adopt a tolerogenic phenotype. Thus, we hypothesized that cisplatin treatment in LPS-activated DCs may reduce Th1 cell proliferation and alter T cell polarization. To precisely characterize the role of cisplatin in DC and T cell interactions, we performed a T cell proliferation assay for antigen-specific CD4+ and CD8+ T cells using OT-I T cell receptor (TCR) transgenic CD8+ T cells and OT-II TCR transgenic CD4+ T cells (Figure 6). LPS-treated or untreated DCs in the presence or absence of cisplatin were incubated with OVA257-264 or OVA323-339 peptides, and CFSE-labeled CD4+ and CD8+ T cells were co-cultured. As shown in Figure 6A, the cisplatin and LPS co-treated DCs reduced the proliferation of both naïve CD4+ and CD8+ T cells compared to the LPS-treated DCs. Furthermore, naïve CD4+ and CD8+ T cells primed with cisplatin and LPS co-treated DCs produced significantly lower levels of IFN-γ, IL-17A and IL-2 than those primed with LPS-activated DCs in a cisplatin dose-dependent manner (Figure 6B). These results were confirmed by intracellular staining (Figure 6C). Interestingly, IL-4, which is mainly produced by Th2-polarized T cells, was highly produced in CD4+ T cells primed with cisplatin and LPS co-treated DCs compared to those co-cultured with LPS-treated DCs in a cisplatin dose-dependent manner (Figure 6B and 6C).
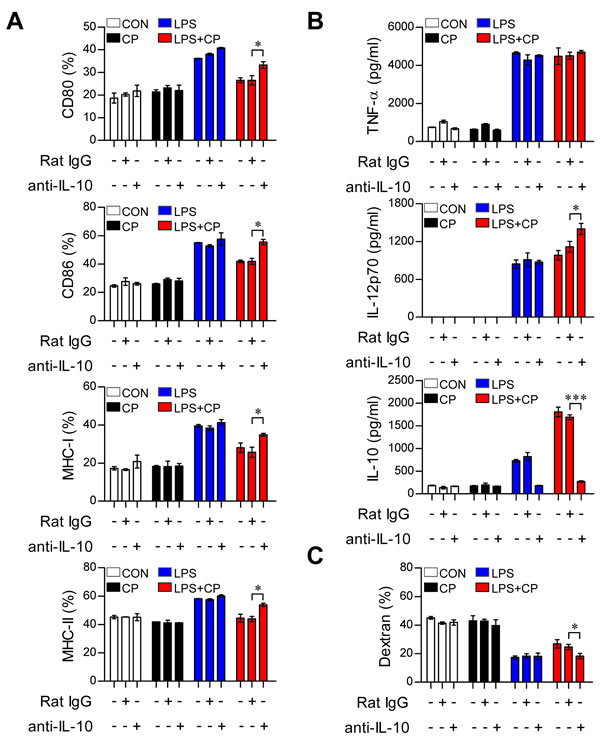
Figure 5: IL-10 neutralization restored the phenotypic and functional maturation of LPS-activated DCs from cisplatin-induced tolerogenic DCs. A., B., C. BMDCs were treated with a neutralizing anti-IL-10 mAb or rat IgG (isotype control) in the absence or presence of LPS (100 ng/ml) or cisplatin (5 μg/ml). A. After 18 h, TNF-α, IL-12 p70 and IL-10 levels in the culture supernatants were measured by ELISA. B. The cells were harvested, and the surface molecule expression patterns of CD11c+ cells were measured by flow cytometry. C. Endocytic capacity was determined by assessing the endocytosis of FITC-dextran after IL-10 neutralization. The percentages of dextran-FITC positive CD11c+ cells are indicated. All bar graphs show the mean ± SD (n = 3 samples) of one representative plot from three independent experiments. *p < 0.05 and ***p < 0.001 between the anti-IL-10 and IgG isotype control in DCs treated with LPS and cisplatin.
We then investigated the differentiation and polarization of CD4+ T cells into Th1 cells, Th2 cells, Th17 cells, regulatory T cells (Treg) and T regulatory type 1 cells (Tr1) after priming with LPS-activated DCs in the presence or absence of cisplatin by analyzing transcription factor expression levels. Cisplatin and LPS co-treated DCs induced Th2 type cells (CD3+CD4+GATA-3+) and IL-10-producing Tr1 cells (CD3+CD4+CD25-CD49b+LAG-3+Foxp3-IL-10+) but decreased the numbers of Th1 (CD3+CD4+T-bet+), Th17 (CD3+CD4+RoRγt+) and Treg cells (CD3+CD4+CD25+CD127-Foxp3+) (Figure 6D and 6E). Additionally, cisplatin treatment produced the same proliferation and differentiation pattern for allogeneic T cells (Supplementary Figure S6). These results suggest that cisplatin induces the differentiation of Th2 and IL-10-producing Tr1 cells and decreases the proliferation of CD4+ and CD8+ T cells in response to LPS-activated DCs.
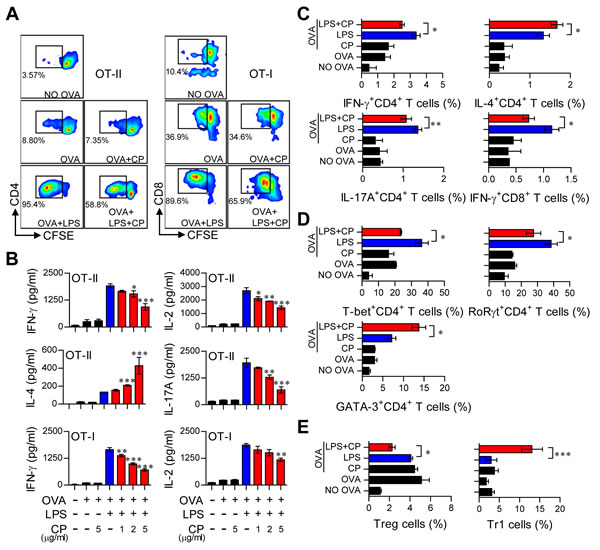
Figure 6: Cisplatin reduced the capacity of LPS-activated DCs to stimulate T cell proliferation and the Th1 response, polarized the Th2-type T cell response, and facilitated the generation of IL-10-producing Tr1 T cells. Transgenic OVA-specific CD4+ T cells (OT-II) and transgenic OVA-specific CD8+ T cells (OT-I) were isolated; stained with CFSE; co-cultured for 96 h with DCs treated with LPS (100 ng/ml), cisplatin (5 μg/mL), or LPS and cisplatin; and then pulsed with OVA323-339 (1 μg/ml) for OVA-specific CD4+ T cells or OVA257-264 (1 μg/ml) for OVA-specific CD8+ T cells. A. The proliferation of CD4+ (left panel) and CD8+ T cells (right panel) was then assessed by flow cytometry. The T cell proliferation data are shown as one representative plot out of three independent experiments.B. Cytokine levels in the culture supernatants from CD4+ T cells (OT-II) and CD8+ T cells (OT-I) in the T cell proliferation experiments were measured by ELISA. C. The bar graphs show intracellular cytokine production (IFN-γ, IL-4, or IL-17A) in CD4+ andCD8+ T cells. D. The bar graphs show T cell transcription factor expression (T-bet for Th1, GATA-3 for Th2 and RoRγt for Th17) in CFSE-labeled CD4+ cells. E. The bar graphs show the percentages of Tregs and IL-10-producing Tr1 cells among CD4+ T cells. The values shown represent the mean ± SD (n = 4 samples) from one representative plot out of three independent experiments. *p < 0.05, **p < 0.01, and ***p < 0.001 compared with T cell/OVA323-339+LPS-pulsed DCs or T cells/OVA257-264 +LPS-pulsed DCs in the presence and absence of cisplatin.
DCs from IL-10-/- mice do not induce the differentiation of Th2 and Tr1 cells
IL-10-producing tolerogenic DCs potently induce the differentiation of naïve T cells towards Th2 and IL-10-producing Tr1 cells [22, 24]. In the same context as the results shown in Figure 6 and Supplementary Figure S6, we hypothesized that if IL-10 is a primary factor for inducing tolerogenic DCs and consequently polarizes CD4+ T cells towards Th2 and IL-10-producing Tr1 cells, the absence of IL-10 in DCs may prime the differentiation of CD4+ T cells towards Th1 and Th17 cells. Thus, we evaluated the capacity of IL-10-/- DCs to induce T cell proliferation, differentiation, and polarization using the same experimental conditions described in Figure 6 (results shown in Figure 7). IL-10-/—derived DCs co-treated with cisplatin and LPS induced the proliferation of both CD4+ and CD8+ T cells (Figure 7A) and polarized naïve CD4+ T cells towards Th1 and Th17 cells instead of Th2 and Tr1 cells (Figure 7B) compared with DCs derived from wild-type (WT) mice. Finally, we confirmed that IL-10-producing Tr1-type T cells were not induced by IL-10-/—derived DCs in the presence of cisplatin (Figure 7C). Collectively, these results indicate that cisplatin functionally and phenotypically induces DCs towards an IL-10-producing tolerogenic phenotype upon TLR stimulation. These tolerogenic DCs consequently contribute to the development of Th2 and IL-10-producing Tr1 cells, suggesting that IL-10 is a primary factor responsible for these cascades.
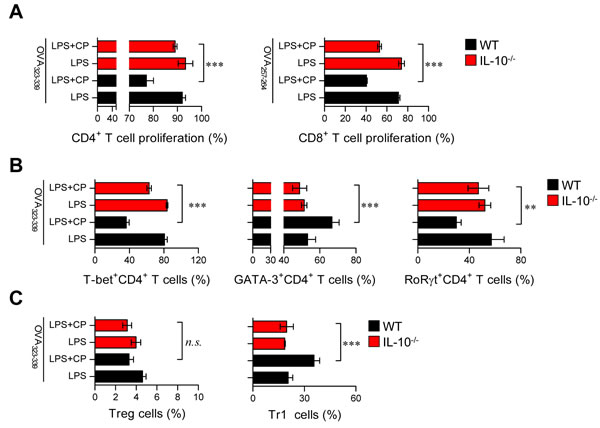
Figure 7: Absence of IL-10 in DCs restored the capacity of cisplatin/LPS-primed DCs to stimulate Th1-type T cell proliferation. OVA-specific CD4+ and CD8+ T cells were isolated; stained with CFSE; co-cultured for 96 h with WT and IL-10-/- DCs treated with LPS (100 ng/ml), cisplatin (5 μg/mL), or LPS and cisplatin; and then pulsed with OVA323-339 (1 μg/ml) for OVA-specific CD4+ T cells or OVA257-264 (1 μg/ml) for OVA-specific CD8+ T cells. A. The proliferation of CD4+ and CD8+ T cells was then assessed by flow cytometry. B. The bar graphs represent the T cell types, such as T-bet+CD4+, GATA-3+CD4+ and RoRγt+CD4+ cells, that were present among the CFSE-labeled CD4+ T cells. C. The bar graphs show the percentages of Treg cells and IL-10-producing Tr1 cells among the CD4+ T cells. All bar graphs show the mean ± SD (n = 4 samples) from one representative plot out of two independent experiments. **p < 0.01 and ***p < 0.001 when comparing WT DCs and IL-10-/- DCs after co-treatment with LPS and cisplatin. Treatments with no significant effect are indicated as n.s.
In vivo tolerogenic activity of cisplatin-treated DCs
Based on the above in vitro results, we next examined whether cisplatin and LPS co-treated DCs could suppress Th1-cell proliferation and induce the differentiation of Th2 and Tr1 cells in vivo (Figure 8 and Figure 9). Briefly, Ly5.1+ OT-I and OT-II T cells were transferred to Ly5.2+ recipient mice. The mice were intravenously injected with OVA protein-pulsed, LPS/cisplatin-primed DCs or OVA protein-pulsed, LPS-activated DCs one day after the T cell transfer. At 5 and 7 days after the DC injections, we evaluated the frequencies and types of Ly5.1+ T cells induced by the LPS/cisplatin-primed DCs (Figure 8 and Figure 9) using flow cytometry. As shown in Figure 8, significantly reduced frequencies of Ly5.1+CD44+CD4+ cells and Ly5.1+CD44+CD8+ cells were found in the peripheral blood mononuclear cell (PBMC) (Figure 8A and 8B) and splenocyte (Figure 8C) populations isolated from the LPS/cisplatin-primed DC group compared to the LPS-activated DC group. Importantly, the spleen cells isolated from the LPS/cisplatin-primed DCs group showed significantly reduced frequencies of Th1-type cells (IFN-γ-producing Ly5.1+CD4+ T cells) and IFN-γ-producing Ly5.1+CD8+ T cells compared with the LPS-primed DCs group in response to stimulation with OVA peptides (Figure 9A). Additionally, the LPS/cisplatin-primed DCs group showed significant induction of Th2-type cells (IL-4-producing Ly5.1+CD4+ T cells) and Tr1 cells (IL-10-producing Ly5.1+CD25-Foxp3-CD4+ T cells) (Figure 9A and 9B). Culture supernatants containing secreted cytokines were collected from the splenocytes following stimulation with OVA peptides and analyzed by ELISA. The results showed that the LPS/cisplatin-primed DCs group robustly secreted both Th2-related cytokines and Tr1-related cytokines such as IL-4 and IL-10, whereas they secreted significantly low levels of Th1-related (IFN-γ) and Th17-related (IL-17A) cytokines (Figure 9C). These results indicate that cisplatin-treated DCs have in vivo tolerogenic activity by inducing the differentiation of Th2 and IL-10-producing Tr1 cells and decreasing the proliferation of CD4+ and CD8+ T cells.
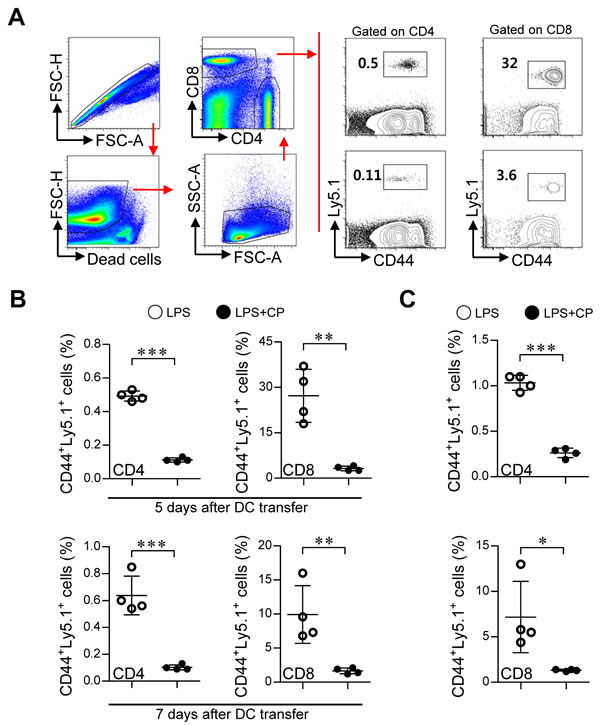
Figure 8: Cisplatin/LPS-primed DCs impaired T cell proliferation in vivo. A., B., C. One day prior to injection with DCs (LPS/cisplatin-primed DC or LPS-primed DC), Ly5.2+ B6/J mice were injected with Ly5.1+ OT-I and OT-II T cells. At 5 and 7 days after DC injection, the frequencies of OVA-specific donor CD4+ and CD8+ T cells in PBMCs A., B. and spleen cells C. were determined by flow cytometry. A. The gating strategy used to detect Ly5.1+CD44+CD4+ T cell and Ly5.1+CD44+CD8+ T cell populations present in the PBMCs at 5 days after injection with DCs. Doublets were excluded based on forward scatter area (FSC-A) vs. forward scatter height (FSC-H), and dead cells were excluded by gating out cells that stained positive with LIVE/DEAD viability dye. Lymphocytes were then gated based on their characteristic pattern of FSC, and SSC was excluded. Activated T cells (determined by the increase of CD44 expression) gated to show Ly5.1+CD44+CD4+ T cell and Ly5.1+CD44+CD8+ T cell populations within the collected PBMCs and spleen cells. B. Ly5.1+CD44+ T cell frequency was analyzed in the PBMCs at 5 and 7 days after injection with DCs. C. Ly5.1+CD44+ T cell frequency was analyzed in the spleen cells at 7 days after injection with DCs. The data are expressed as the means ± SD of 4 mice in each group. *p < 0.05, **p < 0.01, and ***p < 0.001 compared with the group injected with LPS-primed DCs. LPS: group injected with the LPS-primed DCs (○); LPS+CP: group injected with the LPS/cisplatin-primed DCs (●).
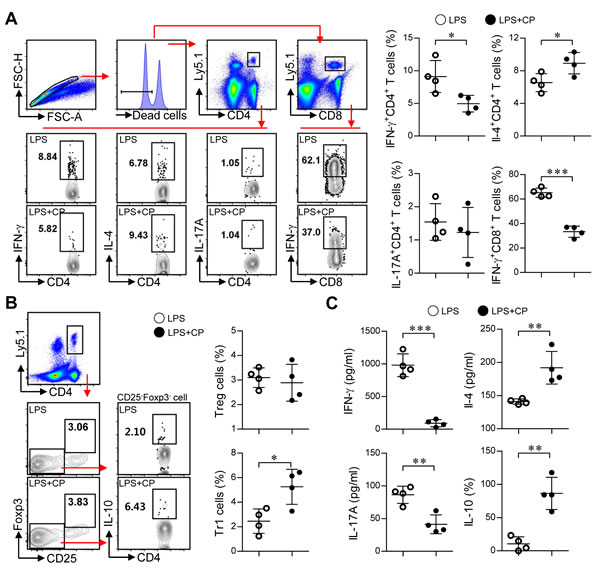
Figure 9: Cisplatin/LPS-primed DCs induced the generation of Th2-type cells and IL-10-producing Tr1 cells in vivo. A., B., C. Spleen cells from each mouse group (i.e., mice injected with LPS-primed DCs and mice injected with Cisplatin/LPS-primed DCs) were stimulated with OVA257-264 and OVA323-339 for 12 h. The cells that had become stimulated with the OVA peptides were identified by intracellular cytokine staining of Ly5.1-expressing T cells. Further details regarding this in vivo experiment are provided in the Materials and Methods section. A. The frequencies of OVA-specific donor Th1 (Ly5.1+CD4+IFN-γ+), Th2 (Ly5.1+CD4+IL-4+), Th17 (Ly5.1+CD4+IL-17A+) and IFN-γ-producing CD8+ T cells (Ly5.1+CD8+IFN-γ+) were analyzed by flow cytometry. B. The frequencies of OVA-specific donor IL-10-producing Tr1 cells (Ly5.1+CD4+Foxp3-CD25-IL-10+) and Treg cells (Ly5.1+CD4+Foxp3+CD25+) were analyzed by flow cytometry. C. Culture supernatants obtained under the conditions described in the Materials and Methods section (in vivo experiment section) were harvested after 12 h, and IFN-γ, IL-4, IL-17A and IL-10 levels were analyzed by ELISA. The data are shown as the means ± SD of 4 mice per group. *p < 0.05 and***p < 0.001 compared with the group injected with LPS-primed DCs. LPS: group injected with LPS-primed DCs (○); LPS+CP: group injected with LPS/cisplatin-primed DCs (●).
DISCUSSION
Although cisplatin is a common treatment for a broad spectrum of cancers, few studies have evaluated the effect of cisplatin treatment on the immune system. In the present study, we described the molecular mechanisms that are required for the immunosuppressive effect of cisplatin, including the phenotypic alteration of DCs and their interactions with T cells, thereby improving our understanding of the immunological aspects of this cancer chemotherapy. Cisplatin induced IL-10-producing tolerogenic DCs upon TLR agonist treatment by activating the p38 MAPK signaling pathway, and these cisplatin-induced tolerogenic DCs promoted the generation of two distinct T cell subsets in vivo as well as in vitro: Th2-type T-cells and IL-10-producing Tr1 cells.
Several cancer drugs are also used as immunosuppressants for the treatment of severe systemic autoimmune diseases. Interestingly, cisplatin has shown therapeutic potential for treating inflammation-mediated diseases under different pathophysiological conditions [25, 26]. For example, cisplatin was shown to ameliorate the symptoms of excessive inflammation-mediated diseases, such as experimental autoimmune encephalomyelitis (EAE), in vivo [25]. EAE is a prototypic Th1-mediated autoimmune inflammatory disease, and Th17 cells are assumed to be crucial effector cells that drive central nervous system (CNS) inflammation and damage [25, 27]. In addition, low-dose cisplatin administration in a murine cecal ligation and puncture-induced polymicrobial sepsis model was found to attenuate inflammation and lethality [26]. Thus, cisplatin might be considered a candidate drug for the control of inflammatory and autoimmune processes. However, it remains unclear how cisplatin ameliorates excessive inflammation. Our findings help explain the immunomodulatory activities of cisplatin observed in these disease models.
The nature of DCs determines the quality of T cell responses and the establishment of either immunity or tolerance. In a previous study, Dijkgraaf et al. showed that cisplatin treatment increased the PGE2-secreting potency of tumor cells to promote monocyte differentiation into IL-10-producing M2 macrophages. These authors proposed a chemotherapy-induced increase in tumor-promoting M2 macrophages may provide an indirect mechanism for chemoresistance and that concomitant therapy with COX inhibitors might enhance the anti-tumor effect of cisplatin [28]. Similarly, our data showed that cisplatin directly skewed the phenotype and function of DCs towards IL-10-producing-tolerogenic DCs upon TLR ligand stimulation (Figure 2 and Supplementary Figure S3). However, the COX-2-PGE2 pathway did not induce tolerogenic DCs and IL-10 production in our study (Supplementary Figure S4). In addition, MyD88 or TRIF deficiency abrogated IL-10 production in cisplatin and LPS co-treated DCs, indicating that TLR signaling is a prerequisite for the generation of IL-10-producing tolerogenic DCs (Supplementary Figure S5). Although it remains debatable whether the clinical success of cisplatin relies primarily on its ability to trigger apoptosis, cisplatin induces cell death mainly via apoptosis and eventually secondary necrosis, and endogenous TLR ligands are released during cell death. Along with the recognition of microbial TLR ligands called pathogen-associated molecular patterns (PAMPs), an increasing number of endogenous TLR stimulators have been reported. These endogenous molecules activate TLR signaling and are involved in many pathological processes. For example, HMGB1 and heat shock proteins are either passively released from injured/inflamed tissues and dying cells or actively secreted by activated cells under pathological conditions. Furthermore, even apoptotic cells may release these endogenous TLR ligands [29]. In addition, a single endogenous molecule, such as HMGB1, has the potential to interact with several TLRs. Thus, these endogenous TLR ligands may participate in tumor progression. In addition, evidence indicates that dying tumor cells release endogenous TLR ligands [30-32]. In fact, HMGB1 released following chemotherapy-induced cell death activates DCs via the TLR4-MyD88 axis, which leads to the induction of anti-tumor T-cell immunity [30].
IL-10-producing tolerogenic DCs are potent inducers of naïve T cell differentiation towards Th2 and IL-10-producing Tr1 cells [33]. During sterile inflammation caused by the exposure of normal cells to anti-cancer drugs, an enormous number of cells undergo apoptosis and/or necrosis in different organs and tissues. These dying cells release endogenous ligands, such as intracellular proteins and nucleic acids, which can bind to pattern recognition receptors, particularly those on tissue-resident innate immune cells such as DCs [34]. In response to activation signals, these cells can inhibit tissue damage by producing anti-inflammatory factors such as IL-10 [35]. However, because the large amounts of IL-10 that are present in the tumor microenvironment play a major role in suppressing the anti-tumor immune response, strategies to break tolerance by neutralizing the function of IL-10 are important for tumor treatment. In a recent study, renal DCs attenuated cisplatin-induced kidney inflammation by producing a high level of IL-10 in response to cisplatin treatment [36]. In addition, in vivo cisplatin treatment directly caused a 10-fold increase of IL-10 production in renal DCs, but not in whole kidneys, indicating that DCs are the major source of IL-10 after cisplatin treatment [37]. However, little is known about the signaling pathways through which cisplatin triggers the generation of tolerogenic DCs after encountering inflammatory environments and their roles in preserving the tolerogenic properties of DCs. Our current study is the first to perform a detailed analysis of the molecular mechanisms responsible for the induction of tolerogenic DCs by cisplatin in the inflammatory environment. We found that a large amount of IL-10 was produced after cisplatin treatment and that this production was stimulated through the MAPK and NF-κB signaling pathways (Figure 3). Without an IL-10 signal, cisplatin-treated DCs did not differentiate into tolerogenic DCs, indicating that induction of tolerogenic DCs by cisplatin requires IL-10 production (Figure 4 and Figure 5). There are several studies showing that p38 MAPK activation in immunosuppressive CD25- regulatory T cells [38] and tolerogenic DCs [39, 40] is a central pathway to induce IL-10 production. Our finding that cisplatin activates p38 MAPK may explain why cisplatin treatment leads to the generation of IL-10-producing tolerogenic DCs. Moreover, the inhibition of p38 MAPK signaling in DCs has been suggested as a way to break immunological tolerance and redirect T cell responses to enhance anti-tumor immunity. The importance of IL-10 production by DCs in the induction of tolerance has been demonstrated, as DCs genetically modified to express IL-10 exhibit suppressive effects in models of alloreactivity and autoimmunity [41, 42]. Jarnicki et al. further demonstrated that the inhibition of p38 MAPK-dependent IL-10 secretion by DCs led to stronger Th1 responses and reduced Tr1 induction [39], indicating that the immune tolerance that is induced by cisplatin can be overcome by inhibiting p38 signaling in DCs. Thus, p38 is an important therapeutic target and provides a mechanism to enhance the efficacy of TLR agonists as vaccine adjuvants together with anti-cancer drugs.
One provocative finding of our study was the induction of IL-10-producing CD3+CD4+LAG-3+CD49b+CD25-Foxp3- Tr1 cells by cisplatin/LPS-primed DCs both in vitro and in vivo (Figure 6, Figure 8, Figure 9 and Supplementary Figure S6). Tr1 cells are induced in the periphery and play a pivotal role in promoting and maintaining tolerance. IL-10-secreting Tr1 cells were first defined by their specific cytokine production profile, which includes the secretion of high levels of IL-10 and transforming growth factor-b (TGF-b), and by their ability to suppress antigen-specific effector T cell responses via a cytokine-dependent mechanism [43]. In other words, the induction of IL-10-secreting T-cell populations with regulatory activity is IL-10 dependent. In contrast to the naturally occurring Tregs that emerge directly from the thymus, Tr1 cells are induced by antigen stimulation via an IL-10-dependent process in vitro and in vivo. Thus, specialized IL-10-producing DCs may play a key role in this process. However, we cannot completely exclude the secondary effect of IL-10 produced from T cells in accelerating the differentiation of Tr1 cells, indicating that further study of the induction of Tr1 differentiation via interactions between IL-10-producing DCs and IL-10-producing T cells is required.
Many studies have suggested that chemotherapy resistance is associated with a strong immune-suppressive tumor microenvironment [44], and our data suggest a possible underlying mechanism for systemic tumor progression in cases of relapse after chemotherapy. Although current treatment protocols, including surgery and chemotherapy, can achieve local control of a tumor, patients who relapse after long-term cisplatin treatment may develop systemic disease due to the cisplatin-induced generation of tolerogenic DCs, which limit the Th1 immune response.
In summary, we demonstrated that cisplatin reprograms TLR agonist-induced activation of DCs via p38 MAPK-induced IL-10 production to generate tolerogenic DCs, which in turn promote the differentiation of naïve CD4+ T cells into IL-10-producing Tr1 cells. A better understanding of the different effects of cisplatin on immune cells compared to cancer cells may lead to the design of more successful anti-tumor drugs and may also provide new therapeutic strategies based on cisplatin-induced immunological modulation.
MATERIALS AND METHODS
Experimental animals
Specific pathogen-free, female, 6- to 8-week-old C57BL/6 (H-2Kb and I-Ab), BALB/c (H-2Kd and I-Ad), C57BL/6 IL-10-/-, C57BL/6 MyD88-/-, C57BL/6 TRIF-/-, C57BL/6 OT-I and OT-II OVA specific T cell receptor (TCR) transgenic mice were purchased from The Jackson Laboratory (Bar Harbor, ME, USA).
Antibodies and reagents
Recombinant mouse granulocyte-macrophage colony stimulating factor (GM-CSF) was purchased from R&D Systems (Minneapolis, MN, USA). 3-(4, 5-dimethylthiazol-2-yl)-2, 5-diphenyl-tetrazolium bromide (MTT) was purchased from Sigma-Aldrich Chemical Co. (St Louis, MO, USA). Pam3CSK4, Poly I:C, lipopolysaccharide (LPS, from Escherichia coli O111:B4), Imiquimod (R837) and ODN1826 were purchased from Invivogen (San Diego, CA, USA). The OT-I peptide (OVA257-264, SIINFEKL) and OT-II peptide (OVA323-339, ISQAVHAAHAEINEAGR) were synthesized by Abfrontier (Seoul, Korea). Anti-phosphorylated ERK1/2, JNK, and p38 mouse monoclonal antibodies (mAbs) and anti-ERK1/2, JNK, p38 mAbs were obtained from Santa Cruz Biotechnology, Inc. (Santa Cruz, CA, USA). A horseradish peroxidase (HRP)-conjugated anti-mouse Ab and a HRP-conjugated anti-rabbit Ab were obtained from Calbiochem (San Diego, CA, USA). PE-conjugated mAbs to CD80, MHC-I, IFN-γ, IL-4, GATA-3 and Foxp3; PE-Cy7-conjugated mAbs to CD11c, CD25 and T-bet; PerCP-Cy5.5-conjugated mAbs to CD223 (LAG-3), CD4 and CD8; APC-conjugated mAbs to CD86, MHC-II, CD49b, IL-10, IL-12p70, TNF-α and RoRγt; APC-Cy7-conjugated CD127 mAb; BV510-conjugated IL-10 mAb; APC-Cy7-conjugated IL-17A mAb; and a FITC-conjugated mAb to CD4 were purchased from eBioscience (San Diego, CA, USA). TNF-α, IL-2, IL-4, Th17A and IFN-γ ELISA kits were obtained from eBioscience. Anti-Armenian hamster IgG, anti-rat IgG2a K, anti-rat IgG2b, anti-mouse IgG1 K and anti-mouse IgG2a isotype controls were purchased from eBioscience. Neutralizing anti-IL-10 mAb (JESS-2A5) and isotype control rat IgG1 (HRPN) were purchased from Bio X Cell (West Lebanon, NH, USA).
Differentiation of BMDCs
Whole bone marrow cells isolated from C57BL/6 mice were incubated at 37°C in a 5% CO2 atmosphere using RPMI 1640 medium supplemented with 100 U/mL penicillin/streptomycin (Lonza, Basel, Switzerland), 10% fetal bovine serum (Lonza), 50 μM mercaptoethanol (Lonza), 0.1 mM nonessential amino acids (Lonza), 1 mM sodium pyruvate (Sigma Chemical Co., St. Louis, MO, USA) and GM-CSF (20 ng/mL). On day 8, over 80% of the non-adherent cells expressed CD11c. To obtain highly purified populations ( > 95% cell purity), in some experiments, the DCs were labeled with a bead-conjugated anti-CD11c mAb (Miltenyi Biotec, Bergisch Gladbach, Germany) followed by positive selection on paramagnetic columns (LS columns; Miltenyi Biotec) according to the manufacturer’s instructions.
Annexin V and propidium iodide (PI) assay using flow cytometry
After 8 days of culture, BMDCs were treated with LPS and/or cisplatin. After 18 h of treatment, harvested DCs were washed with PBS and stained using the Annexin V-PI Apoptosis Detection kit (BD Biosciences) protocol.
Cell survival assay
Cell viability was measured by MTT assay. MTT was dissolved in PBS at a final concentration of 0.5 mg/ml. A 100-μl aliquot of the MTT solution was added to each well of a 96-well plate, and the plate was incubated at 37°C for 4 h. The resultant formazan crystals were dissolved in DMSO, and the OD570 nm values of each well were measured using a microplate reader.
Analysis of DC surface molecule expression using flow cytometry
On day 8, BMDCs were harvested, washed once, resuspended at 1×10⁶ cells/ml, and treated with the following stimuli for 18 h: medium alone (CON; control), LPS, cisplatin, or LPS and cisplatin. The cells were first blocked with 10% (v/v) normal goat serum for 15 min at 4°C and then stained with anti-MHC-I, anti-MHC-II, anti-CD80, anti-CD86, and anti-CD11c mAbs for 30 min at 4°C. Finally, the stained cells were analyzed using an LSRII flow cytometer (Becton Dickinson, San Jose, CA, USA) and FlowJo software (Tree Star, Inc., Ashland, OR).
ELISA
To assess cytokine production, supernatants were collected 18 h after treatment of DCs and stored at −70°C. The amounts of TNF-α, IL-12p70, IL-10, IFN-γ, IL-2, IL-4 and IL-17A were measured by sandwich ELISA kits using commercially available pairs of antibodies and standards according to the manufacturer’s protocol.
Intracellular cytokine staining
Cells were first blocked with 10% (v/v) normal goat serum for 15 min at 4°C and then stained with CD11c, CD4 and CD8 mAbs for 30 min at 4°C. Cells stained with the appropriate isotype-matched IgG were used as negative controls. The cells were fixed and permeabilized with a Cytofix/Cytoperm kit (BD Biosciences or eBioscience) according to the manufacturer’s instructions. Next, anti-IL-12p70, anti-IL-10, anti-TNF-α, anti-IFN-γ, anti-IL-4, anti-IL-17A, anti-T-bet, anti-GATA-3 and anti-RoRγt mAbs were stained with fluorescein-conjugated secondary Abs in a permeation buffer.
Antigen uptake assay
BMDCs were equilibrated at 37°C or 4°C for 45 min and then pulsed with fluorescein-conjugated dextran (40,000 Da) from Sigma-Aldrich (St. Louis, MO) at a concentration of 1 mg/ml. After several washes with cold phosphate-buffered solution, the cells were stained with a PE-Cy7-conjugated anti-CD11c mAb and then measured with a FACS LSRII to reveal antigen uptake. Nonspecific binding of dextran to DCs was determined by incubating DCs with FITC-conjugated dextran at 4°C, and the resulting background value was subtracted from the specific binding values.
Immunoblotting analyses
After stimulation with LPS, cisplatin, or LPS and cisplatin, DCs were lysed in 100 μl lysis buffer containing 50 mM Tris-HCl (pH 7.5), 150 mM NaCl, 1% Triton-X100, 1 mM EDTA, 50 mM NaF, 30 mM Na4PO7, 1 mM phenylmethanesulfonyl fluoride, 2 μg/ml aprotinin, and 1 mM pervanadate. Whole-cell lysate samples were resolved on SDS-polyacrylamide gels and then transferred onto nitrocellulose membranes for 1 h at 60 V. The membranes were blocked in 5% skim milk and incubated with primary Abs for 2 h, followed by incubation with HRP-conjugated secondary Abs for 1 h at room temperature. Target protein epitopes were labeled with primary Abs against total MAPKs and IκB-α (1:1,000 diluted in blocking solution) and polyclonal Abs against p-ERK 1/2, p-JNK 1/2, p-p38, p-IκB-α and p65 (1:5,000, 1:2,000, 1:5,000, 1:2,000 and 1:3,000 dilutions, respectively), and the results were visualized using an ECL Advance Western Blotting Detection kit (GE Healthcare, Little Chalfont, U.K.).
Nuclear extract preparation
BMDCs were treated with 150 μl lysis buffer [10 mM HEPES (pH 7.9), 10 mM KCl, 0.1 mM EDTA, 0.5% Nonidet P-40, 1 mM KCL, 1 mM dithiothreitol, 0.5 mM PMSF] on ice for 15 min. After centrifugation at 3,000 rpm for 3 min, the pellet was resuspended in 100 μl extraction buffer [10 mM HEPES (pH 7.9), 400 mM NaCl, 1 mM EDTA, 1 mM DTT, 1 mM PMSF] and incubated on ice for 30 min, followed by centrifugation at 12,000 rpm for 5 min. The supernatant containing nuclear extracts was collected.
Treatment of DCs with pharmacological inhibitors
All pharmacological inhibitors were obtained from Calbiochem; reconstituted in sterile, cell-culture grade DMSO; and used at the following concentrations: SP600125 (1, 5 and 10 μM), SB203580 (1, 5 and 10 μM) and Bay-117082 (5, 10 and 20 μM). A 0.1% DMSO solution was used as the vehicle control. For the experiments with inhibitors, cells were treated with pharmacological inhibitors for 1 h prior to treatment with a combination of LPS and cisplatin for 18 h.
Analysis of T cell differentiation and proliferation both in vitro and in vivo
T cell proliferation and differentiation were assayed in vitro and in vivo using a modified previously described protocol [45, 46]. Responder T cells, which participate in naive T cell reactions, were isolated using a MACS column from total mononuclear cells prepared from OT-I, OT-II and naive BALB/c mice. For the in vitro experiment, OVA-specific CD8+ and CD4+ T cells, both responders, were obtained from the splenocytes of OT-I and OT-II mice, respectively. These T cells were stained with 1 μM carboxyfluorescein diacetate succinimidyl ester (CFSE; Invitrogen). DCs (2×10⁵ cells/well) treated with OVA peptide in the presence of LPS (100 ng/ml), cisplatin or a combination of LPS and cisplatin for 18 h were co-cultured with CFSE-stained CD8+ and CD4+ T cells (2×10⁶) at a DC:T-cell ratio of 1:10. Naive BALB/c (allogeneic mixed lymphocyte reaction (MLR)) T cells (2×10⁶) were co-cultured with DCs (2×10⁵ cells/well) treated with LPS, cisplatin or LPS and cisplatin. On day 3 or day 4 of co-culture, T cells were stained using an intracellular staining method. Culture supernatants were harvested, and IFN-γ, IL-2, IL-4 and IL-17A levels were measured by ELISA.
For the in vivo experiment, Ly5.1+ OT-I and OT-II T cells (5 × 10⁵ cells per population) were transferred intravenously into the lateral tail veins of Ly5.2+ recipient mice. The next day, BMDCs from Ly5.2+ recipient mice were pulsed with ovalbumin protein (10 μg/ml) for 2 h, and then the cells were washed with wash buffer (RPMI 1640 plus 2% FBS). After washing twice with wash buffer, the DCs were stimulated by LPS with or without cisplatin for 18 h. These DCs (5 × 10⁶ cells) were transferred intravenously into the lateral tail veins of Ly5.2+ recipient mice. At day 5 and day 7 after the DC transfer, PBMCs were isolated from blood samples collected from each mouse, as previously described [47]. To analyze the populations of Ly5.1+ OT-I and OT-II T cells, single-cell suspensions of PBMCs and splenocytes from each mouse were stained with anti-CD4, anti-CD8α, anti-CD44, and anti-Ly5.1 mAbs. Dead cells were excluded using a Live/Dead Fixable Dead Cell Stain kit (Invitrogen). Data were collected on a FACS Canto II (BD) and a FACSverse (BD) and analyzed using FlowJo software (TreeStar). Additionally, single-cell suspensions prepared from the spleens of each group were stimulated with OVA257-264 (0.2 μg/ml) and OVA323-339 (5 μg/ml) for 12 h at 37°C in the presence of GolgiPlug 7 days after DC transfer. At 12 h after stimulation, the types and populations of T cells (Ly5.1+ T cells) present were analyzed by intercellular staining and flow cytometry. Supernatants were harvested, and IFN-γ, IL-4, IL-17A and IL-10 levels were measured by ELISA.
Statistical analysis
Significant differences between samples were determined with Tukey’s multiple comparison test and unpaired t-tests using statistical software (GraphPad Prism Software, version 5; GraphPad Software, San Diego, CA). The data in the graphs are expressed as the means. *p < 0.05, **p < 0.01 and ***p < 0.001 were considered statistically significant.
ACKNOWLEDGMENTS
This study was supported by the International Research & Development Program (NRF-2014K1A3A7A03075054) and the Basic Science Research Program (NRF-2015R1A2A1A10056084) through the National Research Foundation of Korea (NRF), funded by the Ministry of Science, ICT and Future Planning of Korea as well as through a grant awarded by the Korea Health Technology R&D Project through the Korea Health Industry Development Institute (KHIDI), funded by the Ministry of Health & Welfare, Republic of Korea (HI15C2778).
CONFLICTS OF INTEREST
The authors declare no financial or commercial conflicts of interest.
REFERENCES
1. Dasari S and Tchounwou PB. Cisplatin in cancer therapy: molecular mechanisms of action. Eur J Pharmacol. 2014; 740:364-378.
2. Florea AM and Busselberg D. Cisplatin as an anti-tumor drug: cellular mechanisms of activity, drug resistance and induced side effects. Cancers (Basel). 2011; 3:1351-1371.
3. Desoize B and Madoulet C. Particular aspects of platinum compounds used at present in cancer treatment. Crit Rev Oncol Hematol. 2002; 42:317-325.
4. Rosenberg B, Vancamp L and Krigas T. Inhibition of cell division in Escherichia coli by electrolysis products from a platinum electrode. Nature. 1965; 205:698-699.
5. Shen H, Perez RE, Davaadelger B and Maki CG. Two 4N cell-cycle arrests contribute to cisplatin-resistance. PLoS One. 2013; 8:e59848.
6. Mueller S, Schittenhelm M, Honecker F, Malenke E, Lauber K, Wesselborg S, Hartmann JT, Bokemeyer C and Mayer F. Cell-cycle progression and response of germ cell tumors to cisplatin in vitro. Int J Oncol. 2006; 29:471-479.
7. Kouchi Y, Maeda Y, Ohuchida A and Ohsawa M. Immunotoxic effect of low dose cisplatin in mice. J Toxicol Sci. 1996; 21:227-233.
8. Sfikakis PP, Souliotis VL, Katsilambros N, Markakis K, Vaiopoulos G, Tsokos GC and Panayiotidis P. Downregulation of interleukin-2 and apha-chain interleukin-2 receptor biosynthesis by cisplatin in human peripheral lymphocytes. Clin Immunol Immunopathol. 1996; 79:43-49.
9. He J, Hu Y, Hu M and Li B. Development of PD-1/PD-L1 pathway in tumor immune microenvironment and treatment for non-small cell lung cancer. Sci Rep. 2015; 5:13110.
10. Romano E and Romero P. The therapeutic promise of disrupting the PD-1/PD-L1 immune checkpoint in cancer: unleashing the CD8 T cell mediated anti-tumor activity results in significant, unprecedented clinical efficacy in various solid tumors. J Immunother Cancer. 2015; 3:15.
11. Subbotin VM. Dendritic cell-based cancer immunotherapy: the stagnant approach and a theoretical solution. Drug Discov Today. 2014; 19:834-837.
12. Gunzer M, Janich S, Varga G and Grabbe S. Dendritic cells and tumor immunity. Semin Immunol. 2001; 13:291-302.
13. Palucka K, Ueno H, Fay J and Banchereau J. Dendritic cells and immunity against cancer. J Intern Med. 2011; 269:64-73.
14. Ma Y, Shurin GV, Gutkin DW and Shurin MR. Tumor associated regulatory dendritic cells. Semin Cancer Biol. 2012; 22:298-306.
15. Terhune J, Berk E and Czerniecki BJ. Dendritic cell-induced Th1 and Th17 cell differentiation for cancer therapy. Vaccines (Basel). 2013; 1:527-549.
16. Shishodia S, Shrivastava A and Sodhi A. Protein kinase C: a potential pathway of macrophage activation with cisplatin. Immunol Lett. 1998; 61:179-186.
17. von Knethen A, Lotero A and Brune B. Etoposide and cisplatin induced apoptosis in activated RAW 264.7 macrophages is attenuated by cAMP-induced gene expression. Oncogene. 1998; 17:387-394.
18. Dearman RJ, Cumberbatch M, Maxwell G, Basketter DA and Kimber I. Toll-like receptor ligand activation of murine bone marrow-derived dendritic cells. Immunology. 2009; 126:475-484.
19. Torres-Aguilar H, Aguilar-Ruiz SR, Gonzalez-Perez G, Munguia R, Bajana S, Meraz-Rios MA and Sanchez-Torres C. Tolerogenic dendritic cells generated with different immunosuppressive cytokines induce antigen-specific anergy and regulatory properties in memory CD4+ T cells. J Immunol. 2010; 184:1765-1775.
20. Gabrysova L, Howes A, Saraiva M and O’Garra A. The regulation of IL-10 expression. Curr Top Microbiol Immunol. 2014; 380:157-190.
21. Harizi H, Juzan M, Pitard V, Moreau JF and Gualde N. Cyclooxygenase-2-issued prostaglandin e(2) enhances the production of endogenous IL-10, which down-regulates dendritic cell functions. J Immunol. 2002; 168:2255-2263.
22. Torres-Aguilar H, Blank M, Jara LJ and Shoenfeld Y. Tolerogenic dendritic cells in autoimmune diseases: crucial players in induction and prevention of autoimmunity. Autoimmun Rev. 2010; 10:8-17.
23. Manicassamy S and Pulendran B. Dendritic cell control of tolerogenic responses. Immunol Rev. 2011; 241:206-227.
24. Maldonado RA and von Andrian UH. How tolerogenic dendritic cells induce regulatory T cells. Adv Immunol. 2010; 108:111-165.
25. Li XB and Schluesener HJ. Therapeutic effects of cisplatin on rat experimental autoimmune encephalomyelitis. Arch Immunol Ther Exp (Warsz). 2006; 54:51-53.
26. Pan P, Cardinal J, Dhupar R, Rosengart MR, Lotze MT, Geller DA, Billiar TR and Tsung A. Low-dose cisplatin administration in murine cecal ligation and puncture prevents the systemic release of HMGB1 and attenuates lethality. J Leukoc Biol. 2009; 86:625-632.
27. Rothhammer V, Heink S, Petermann F, Srivastava R, Claussen MC, Hemmer B and Korn T. Th17 lymphocytes traffic to the central nervous system independently of alpha4 integrin expression during EAE. J Exp Med. 2011; 208:2465-2476.
28. Dijkgraaf EM, Heusinkveld M, Tummers B, Vogelpoel LT, Goedemans R, Jha V, Nortier JW, Welters MJ, Kroep JR and van der Burg SH. Chemotherapy alters monocyte differentiation to favor generation of cancer-supporting M2 macrophages in the tumor microenvironment. Cancer Res. 2013; 73:2480-2492.
29. Taniguchi N, Yoshida K, Ito T, Tsuda M, Mishima Y, Furumatsu T, Ronfani L, Abeyama K, Kawahara K, Komiya S, Maruyama I, Lotz M, Bianchi ME and Asahara H. Stage-specific secretion of HMGB1 in cartilage regulates endochondral ossification. Mol Cell Biol. 2007; 27:5650-5663.
30. Apetoh L, Ghiringhelli F, Tesniere A, Obeid M, Ortiz C, Criollo A, Mignot G, Maiuri MC, Ullrich E, Saulnier P, Yang H, Amigorena S, Ryffel B, Barrat FJ, Saftig P, Levi F, et al. Toll-like receptor 4-dependent contribution of the immune system to anticancer chemotherapy and radiotherapy. Nat Med. 2007; 13:1050-1059.
31. Curtin JF, Liu N, Candolfi M, Xiong W, Assi H, Yagiz K, Edwards MR, Michelsen KS, Kroeger KM, Liu C, Muhammad AK, Clark MC, Arditi M, Comin-Anduix B, Ribas A, Lowenstein PR, et al. HMGB1 mediates endogenous TLR2 activation and brain tumor regression. PLoS Med. 2009; 6:e10.
32. Gotte M and Yip GW. Heparanase, hyaluronan, and CD44 in cancers: a breast carcinoma perspective. Cancer Res. 2006; 66:10233-10237.
33. O’Garra A, Vieira PL, Vieira P and Goldfeld AE. IL-10-producing and naturally occurring CD4+ Tregs: limiting collateral damage. J Clin Invest. 2004; 114:1372-1378.
34. Lotze MT, Zeh HJ, Rubartelli A, Sparvero LJ, Amoscato AA, Washburn NR, Devera ME, Liang X, Tor M and Billiar T. The grateful dead: damage-associated molecular pattern molecules and reduction/oxidation regulate immunity. Immunol Rev. 2007; 220:60-81.
35. Bamboat ZM, Ocuin LM, Balachandran VP, Obaid H, Plitas G and DeMatteo RP. Conventional DCs reduce liver ischemia/reperfusion injury in mice via IL-10 secretion. J Clin Invest. 2010; 120:559-569.
36. Tadagavadi RK and Reeves WB. Renal dendritic cells ameliorate nephrotoxic acute kidney injury. J Am Soc Nephrol. 2010; 21:53-63.
37. Tadagavadi RK and Reeves WB. Endogenous IL-10 attenuates cisplatin nephrotoxicity: role of dendritic cells. J Immunol. 2010; 185:4904-4911.
38. Ohkusu-Tsukada K, Toda M, Udono H, Kawakami Y and Takahashi K. Targeted inhibition of IL-10-secreting CD25- Treg via p38 MAPK suppression in cancer immunotherapy. Eur J Immunol. 2010; 40:1011-1021.
39. Jarnicki AG, Conroy H, Brereton C, Donnelly G, Toomey D, Walsh K, Sweeney C, Leavy O, Fletcher J, Lavelle EC, Dunne P and Mills KH. Attenuating regulatory T cell induction by TLR agonists through inhibition of p38 MAPK signaling in dendritic cells enhances their efficacy as vaccine adjuvants and cancer immunotherapeutics. J Immunol. 2008; 180:3797-3806.
40. Garate D, Rojas-Colonelli N, Pena C, Salazar L, Abello P, Pesce B, Aravena O, Garcia-Gonzalez P, Ribeiro CH, Molina MC, Catalan D and Aguillon JC. Blocking of p38 and transforming growth factor beta receptor pathways impairs the ability of tolerogenic dendritic cells to suppress murine arthritis. Arthritis Rheum. 2013; 65:120-129.
41. Coates PT, Krishnan R, Kireta S, Johnston J and Russ GR. Human myeloid dendritic cells transduced with an adenoviral interleukin-10 gene construct inhibit human skin graft rejection in humanized NOD-scid chimeric mice. Gene Ther. 2001; 8:1224-1233.
42. Yang S, Li W, Liu W, Gao C, Zhou B, Li S, Li Y and Kong Y. IL-10 gene modified dendritic cells induced antigen-specific tolerance in experimental autoimmune myocarditis. Clin Immunol. 2006; 121:63-73.
43. Groux H, O’Garra A, Bigler M, Rouleau M, Antonenko S, de Vries JE and Roncarolo MG. A CD4+ T-cell subset inhibits antigen-specific T-cell responses and prevents colitis. Nature. 1997; 389:737-742.
44. Heusinkveld M and van der Burg SH. Identification and manipulation of tumor associated macrophages in human cancers. J Transl Med. 2011; 9:216.
45. Quah BJ, Warren HS and Parish CR. Monitoring lymphocyte proliferation in vitro and in vivo with the intracellular fluorescent dye carboxyfluorescein diacetate succinimidyl ester. Nat Protoc. 2007; 2:2049-2056.
46. Egan RM, Yorkey C, Black R, Loh WK, Stevens JL, Storozynsky E, Lord EM, Frelinger JG and Woodward JG. In vivo behavior of peptide-specific T cells during mucosal tolerance induction: antigen introduced through the mucosa of the conjunctiva elicits prolonged antigen-specific T cell priming followed by anergy. J Immunol. 2000; 164:4543-4550.
47. Lee MS, Park CH, Jeong YH, Kim YJ and Ha SJ. Negative regulation of type I IFN expression by OASL1 permits chronic viral infection and CD8(+) T-cell exhaustion. PLoS Pathog. 2013; 9:e1003478.