
INTRODUCTION
Inflammatory responses play crucial roles at different stages of cancer development and progression and may be linked with systemic inflammation [1–3]. There is increasing evidence that systemic inflammatory response is a key determinant of outcome in patients with cancer, which is reflected by many biochemical or hematological parameters, such as increased C-reactive protein (CRP) levels, hypoalbuminemia or elevated white cell, neutrophil and platelet counts [4]. Several of these parameters have been converted to ratios or prognostic scores such as the neutrophil to lymphocyte ratio (NLR) [5] or the Glasgow Prognostic Score (GPS, combination of CRP and albumin) [6].
Recently, a decreased ratio of peripheral lymphocyte to monocyte ratio (LMR) has been identified as a poor prognostic indicator in various cancers [7–12], which might be a readily available and inexpensive objective prognostic index that could be used to precisely guide clinical decisions. The LMR might be a good reflection of cancer, lymphopenia that is a surrogate marker of weak immune response and an elevated monocyte count, standing for a microenvironment surrogate marker of high tumor burden. However, the consistency and magnitude of the prognostic impact of LMR remain unclear. Therefore, we performed a systematic review of published studies in order to evaluate the prognostic value of LMR by exploring the associations of LMR with survival and the clinicopathological features of cancer. A meta-analysis was conducted with extracted data which could be merged.
RESULTS
Included studies
The flow chart of the literature search is shown in Figure 1. A total of 681 records were retrieved from a primary literature search in the above databases and no record from references searching, and excluded 204 duplicates from the initial records. After screening the title of 681 studies returned from the search algorithm, 175 studies were selected for reviewing the abstracts. The titles and abstracts screening process identified 107 articles, which met the inclusion criteria. The remaining articles were reviewed in full-text. Finally, 56 articles were included in this meta-analysis.
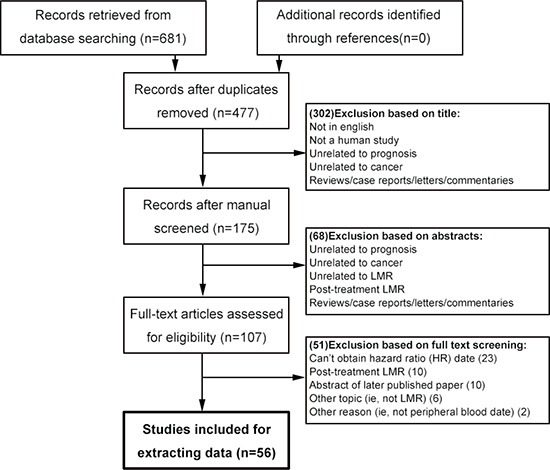
Figure 1: Flowchart of selecting studies for inclusion in this meta-analysis. LMR = lymphocyte to monocyte ratio.
These studies included a total of 20,248 patients and characteristics of the studies are shown in Table 1 [7–62]. All of the studies were published in 2011 or later. Twenty different types of malignance were analyzed, most of which were lymphoma. Of the 56 identified studies, forty-five were full-text paper and eleven were conference abstract.
Table 1: Features of included studies
Features |
Studies |
Patients |
References |
|---|---|---|---|
Year of publication, No. (%) |
|
|
|
2011–2012 |
7 (12.5) |
2499 (12.3) |
(59–65) |
2013 |
8 (14.3) |
4471 (22.1) |
(51–58) |
2014 |
21 (37.5) |
7216 (35.6) |
(11–12, 32–50) |
2015 |
20 (35.7) |
6062 (29.9) |
(7–10, 16–31) |
Type of publication, No. (%) |
|
|
|
Full paper |
45 (80.4) |
16511 (81.5) |
(7–12, 16–38, 40–42, 44–49, 52, 54, 58, 61–64) |
Abstract |
11 (19.6) |
3737 (18.5) |
(39, 43, 50–51, 53, 55–57, 59–60, 65) |
Study design, No. (%) |
|
|
|
Prospective |
3 (5.4) |
801 (4.0) |
(8, 22, 34) |
Retrospective |
53 (64.6) |
19447 (96.0) |
(7, 9–12, 16–21, 23–33, 35–65) |
Type of cancer, No. (%) |
|
|
|
Diffuse large B-cell lymphoma |
12 (25.5) |
4383 (25.2) |
(33–34, 36, 38, 42, 45, 50–51, 54, 60, 63, 65) |
Hodgkin’s lymphoma |
7 (12.5) |
2799 (13.8) |
(46, 53, 55, 57, 61–62, 64) |
Colorectal carcinoma |
6 (10.7) |
1340 (6.6) |
(8, 12, 17, 21–23) |
Lung cancer |
4 (7.1) |
2085 (10.3) |
(19, 40, 48–49) |
Multiple sites |
3 (5.4) |
469 (2.3) |
(31, 43, 56) |
Urothelial carcinoma |
3 (5.4) |
374 (1.8) |
(10, 16, 35) |
Renal cell carcinoma |
3 (5.4) |
1549 (7.7) |
(9, 30, 47) |
Nasopharyngeal carcinoma |
3 (5.4) |
2475 (12.2) |
(24, 41, 58) |
Pancreatic cancer |
2 (3.4) |
795 (3.9) |
(7, 20) |
Esophageal carcinoma |
2 (3.4) |
566 (2.8) |
(25–26) |
Gastric cancer |
2 (3.4) |
815 (4.0) |
(27, 32) |
Burkitt lymphoma |
1 (1.2) |
62 (0. 3) |
(18) |
Endometrial cancer |
1 (1.2) |
605 (3.0) |
(28) |
Cervical cancer |
1 (1.2) |
485 (2.4) |
(29) |
Soft tissue sarcoma |
1 (1.2) |
340 (1.7) |
(11) |
Breast cancer |
1 (1.2) |
542 (2.7) |
(37) |
Hepatocellular carcinoma |
1 (1.2) |
210 (1.0) |
(39) |
Multiple myeloma |
1 (1.2) |
189 (0.9) |
(52) |
Melanoma |
1 (1.2) |
66 (0.3) |
(59) |
Follicular lymphoma |
1 (1.2) |
99 (0.5) |
(44) |
Cancer stage, No. (%) |
|
|
|
Mixed |
37 (66.1) |
11583 (57.2) |
(7, 11, 16, 18–20, 25, 27–28, 30–31, 33–36, 38–39, 42–46, 49–57, 60–65) |
Non-metastatic |
12 (21.4) |
6742 (33.3) |
(9–10, 12, 17, 23, 26, 29, 32, 37, 47–48, 58) |
Metastatic |
7 (12.5) |
1923 (9.5) |
(8, 21–22, 24, 40–41, 59) |
Cutoff for LMR, No. (%) |
|
|
|
1.0 to < 2.0 |
8 (14.3) |
2607 (12.9) |
(43, 50, 53, 55–57, 62, 65) |
2.0 to < 3.0 |
25 (44.6) |
7978 (39.4) |
(7, 9–12, 16, 18, 22–26, 29, 31, 33, 35, 38 45–46, 52, 54, 59–61, 63–64) |
3.0 to < 4.0 |
9 (16.1) |
3517 (17.4) |
(8, 17, 19–21, 39, 42, 47–48) |
≥ 4.0 |
13 (23.2) |
5703 (28.2) |
(27–28, 30, 32, 34, 37, 40–41, 44, 49, 51, 58) |
Not reported |
1 (1.8) |
443 (2.2) |
(36) |
ROC curve, No. (%) |
|
|
|
Considered |
44 (78.6) |
17497 (86.4) |
(7–12, 18–19, 21–22, 24–29, 32–35, 37–42, 44–54, 58, 60–65) |
Not considered |
12 (21.4) |
2751 (13.6) |
(16–17, 20, 23, 30–31, 36, 43, 55–57, 59) |
Reported outcome, No. (%) |
|
|
|
Overall survival |
44 (78.7) |
14984 (72.0) |
(8, 10–12, 16, 18–20, 22–24, 26–30, 32–36, 38–43, 45–49, 51–52, 54, 56–59, 61–65) |
Cancer-specific survival |
11 (18.4) |
3972 (18.4) |
(7–8, 11, 21–22, 25, 27–28, 47, 61–62) |
Recurrence-free survival |
7 (12.2) |
1849 (7.7) |
(12, 29, 32, 35, 38–39, 59) |
Progression-free survival |
18 (34.0) |
5805 (32.6) |
(18–19, 31, 34, 39, 42, 44–45, 49, 51, 53, 55, 57, 60–63, 65) |
Disease-free survival |
15 (26.5) |
6440 (34.2) |
(8–9, 11, 17, 21, 23, 26–27, 31, 33, 37, 41, 46, 48, 50) |
Because of rounding, not all percentages total 100. LMR = lymphocyte to monocyte ratio.
The prognostic significance of LMR in OS of various cancers
The association between LMR and OS was reported in 44 studies enrolling 14,984 patients with various cancer types [8, 10–13, 15–17, 19–21, 23–27, 29–33, 35–40, 42–46, 48, 49, 51, 53–56, 58–62]. Five of the eligible 44 studies (11%) reported a non-statistically significant hazard ratio. A forest plot of non-hematological and hematological malignancy is shown in Figure 2. A combined analysis showed that LMR lower than the cutoff was associated with poor OS in non-hematological malignancy (HR: 0.59, 95% CI: 0.53–0.66; P < 0.001) and hematological malignancy (HR: 0.44, 95% CI: 0.34–0.56; P < 0.001) with significant heterogeneity (I2 = 53.6% and 77.9%, respectively). The effect of LMR on OS among cancer subgroups is presented in Figure 3A. The lower LMR was significantly associated with poor OS in colorectal carcinoma (HR: 0.51, 95% CI: 0.38–0.69; P < 0.001), lung cancer (HR: 0.61, 95% CI: 0.50–0.73; P < 0.001), nasopharyngeal carcinoma (HR: 0.50, 95% CI: 0.43–0.58; P < 0.001), pancreatic cancer (HR: 0.59, 95% CI: 0.46–0.75; P < 0.001), soft tissue sarcoma (HR: 0.50, 95% CI: 0.30–0.85; P = 0.01), urothelial carcinoma (HR: 0.59, 95% CI: 0.45–0.78; P = 0.001), DLBCL (HR: 0.49, 95% CI: 0.36–0.66; P < 0.001), Hodgkin’s lymphoma (HR: 0.30, 95% CI: 0.20–0.45; P < 0.001) but not in gastric cancer (HR: 0.83, 95% CI: 0.57–1.19; P = 0.302). In non-hematological malignancy, subgroup analysis revealed the hazard ratios of LMR on OS among different disease stages were 0.73 (95% CI: 0.66–0.81; P < 0.001) for a mixed group comprising studies that included both metastatic and non-metastatic patients, 0.61 (95% CI: 0.55–0.68; P < 0.001) for non-metastatic cancer, and 0.50 (95% CI: 0.45–0.57; P < 0.001) for metastatic cancer (Table 2).
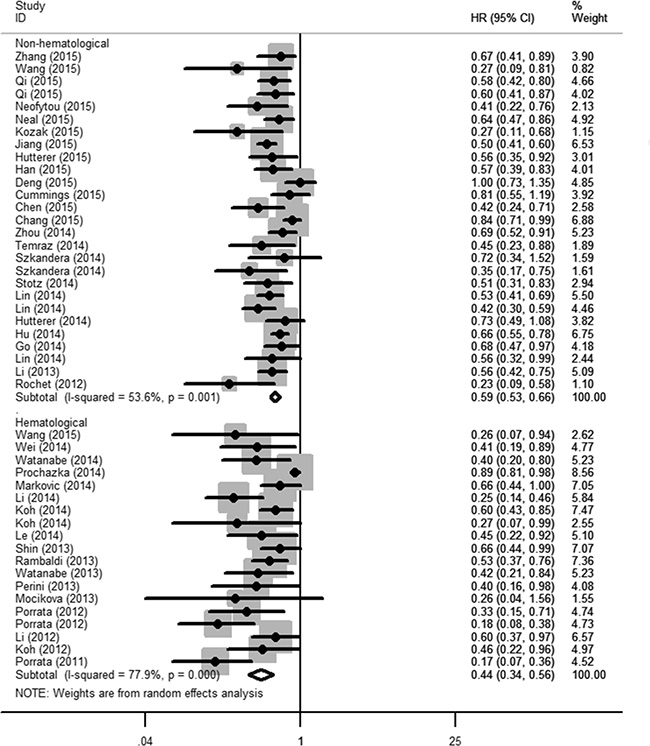
Figure 2: The prognostic significance of lymphocyte to monocyte ratio (LMR) in overall survival (OS). A combined analysis showed that LMR lower than the cutoff was associated with poor OS in non-hematological malignancy (HR: 0.59, 95% CI: 0.53–0.66; P < 0.001) and hematological malignancy (HR: 0.44, 95% CI: 0.34–0.56; P < 0.001) with significant heterogeneity (I2 = 53.6% and 77.9%, respectively).
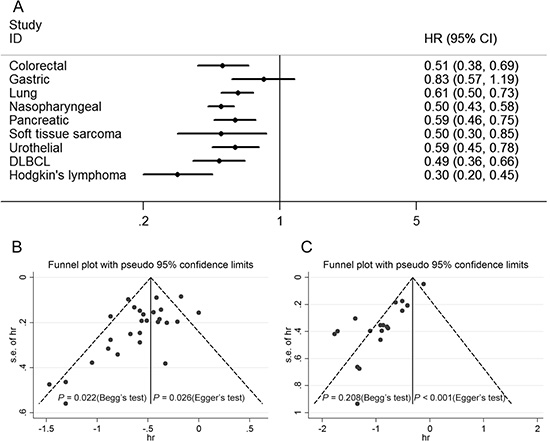
Figure 3: Subgroup analysis of OS by type of cancer and results for the evaluation of publication bias. (A) The lower LMR was significantly associated with poor OS in colorectal carcinoma, lung cancer, nasopharyngeal carcinoma, pancreatic cancer, soft tissue sarcoma, urothelial carcinoma, DLBCL, Hodgkin’s lymphoma but not in gastric cancer. (B) The funnel plot for OS of non-hematological malignancy is asymmetric. A publication bias was identified based on Begg’s (P = 0.022) and Egger’s (P = 0.026) tests. (C) The funnel plot for OS of hematological malignancy is asymmetric. A publication bias was identified based on Begg’s (P = 0.208) and Egger’s (P < 0.001) tests.
Table 2: Meta-regression and subgroup analysis of LMR and OS of various cancers
Subgroup |
HR (95% CI) |
P value |
Meta-regression |
Heterogeneity |
|
|---|---|---|---|---|---|
I2 (%) |
P value |
||||
Non-hematological |
|||||
Year of publication |
|
|
0.276 |
|
|
2012–2013 |
0.40 (0.17–0.93) |
0.034 |
|
68.7 |
0.074 |
2014 |
0.59 (0.52–0.67) |
< 0.001 |
|
17.3 |
0.279 |
2015 |
0.61 (0.52–0.72) |
< 0.001 |
|
65.2 |
< 0.001 |
Type of publication |
|
|
0.250 |
|
|
Full paper |
0.60 (0.54–0.67) |
< 0.001 |
|
53.3 |
0.001 |
Abstract |
0.39 (0.16–0.92) |
0.031 |
|
61 |
0.109 |
Study design |
|
|
0.782 |
|
|
Prospective |
0.56 (0.37–0.83) |
0.005 |
|
37.6 |
0.206 |
Retrospective |
0.59 (0.53–0.66) |
< 0.001 |
|
55.7 |
< 0.001 |
Cancer site |
|
|
0.545 |
|
|
Cancer stage |
|
|
0.004 |
|
|
Mixed |
0.73 (0.66–0.81) |
< 0.001 |
|
45.4 |
0.043 |
Non-metastatic |
0.61 (0.55–0.68) |
< 0.001 |
|
3.5 |
0.405 |
Metastatic |
0.50 (0.45–0.57) |
< 0.001 |
|
26.7 |
0.235 |
Cutoff for LMR |
|
|
0.015 |
|
|
2.0 to < 3.0 |
0.51 (0.45–0.58) |
< 0.001 |
|
0 |
0.459 |
3.0 to < 4.0 |
0.62 (0.55–0.71) |
< 0.001 |
|
0 |
0.497 |
≥ 4.0 |
0.67 (0.56–0.80) |
< 0.001 |
|
69 |
0.001 |
ROC curve |
|
|
0.646 |
|
|
Considered |
0.59 (0.53–0.66) |
< 0.001 |
|
41.5 |
0.025 |
Not considered |
0.58 (0.44–0.78) |
< 0.001 |
|
69.2 |
0.006 |
Analysis of hazard ratio |
|
|
0.950 |
|
|
Multivariable |
0.59 (0.53–0.66) |
< 0.001 |
|
58.2 |
< 0.001 |
Univariate |
0.60 (0.48–0.75) |
0.001 |
|
0 |
0.644 |
Hematological |
|||||
Year of publication |
|
|
0.181 |
|
|
2011–2012 |
0.32 (0.19–0.55) |
< 0.001 |
|
63.8 |
0.026 |
2013 |
0.54 (0.42–0.69) |
< 0.001 |
|
0 |
0.647 |
2014–2015 |
0.48 (0.34–0.69) |
< 0.001 |
|
78.8 |
< 0.001 |
Type of publication |
|
|
0.207 |
|
|
Full paper |
0.47 (0.36–0.62) |
< 0.001 |
|
78.9 |
< 0.001 |
Abstract |
0.34 (0.24–0.50) |
< 0.001 |
|
0 |
0.419 |
Cancer site |
|
|
0.596 |
|
|
Cutoff for LMR |
|
|
0.343 |
|
|
1.0 to < 2.0 |
0.27 (0.19–0.40) |
< 0.001 |
|
19.1 |
0.293 |
2.0 to < 3.0 |
0.56 (0.47–0.65) |
< 0.001 |
|
0 |
0.662 |
≥ 3.0 |
0.34 (0.23–0.49) |
< 0.001 |
|
0 |
0.452 |
ROC curve |
|
|
0.203 |
|
|
Considered |
0.43 (0.35–0.54) |
< 0.001 |
|
48.9 |
0.017 |
Not considered |
0.57 (0.32–1.01) |
0.053 |
|
62.4 |
0.047 |
Analysis of hazard ratio |
|
|
0.203 |
|
|
Multivariable |
0.43 (0.35–0.54) |
< 0.001 |
|
48.9 |
0.017 |
Univariate |
0.57 (0.32–1.01) |
0.053 |
|
62.4 |
0.047 |
LMR, lymphocyte to monocyte ratio; OS, overall survival; HR, hazard ratio; CI, confidence interval.
Sensitivity analysis indicated that omitting any single study did not significantly affect the pooled HR. In non-hematological malignancy, meta-regression analysis revealed that cancer stage (P = 0.004) and cutoff for LMR (P = 0.015) might be significant contributors to heterogeneity, whereas publication year, publication type, study design, type of cancer, ROC curve and analysis of hazard ratio were not (P = 0.250–0.950). In hematological malignancy, meta-regression analysis revealed that publication year, publication type, cancer site, cutoff, ROC curve and analysis of hazard ratio were not significant contributors to heterogeneity (P = 0.181–0.596) (Table 2).
A key point was that the cutoff value varied and ranged from 1.10 to 5.26, which was attributed to the use of different methods and patients’ baseline characteristics (race, country, gender, age, etc.). Moreover, there was a significant association between LMR cutoff and the hazard ratio for OS (r = 0.511, P < 0.001) (supporting information Figure S1). There was evidence of publication bias in the meta-analysis of the association between LMR and OS, with fewer small studies reporting negative results than would be expected (Figure 3B–3C).
The prognostic significance of LMR in CSS, DFS, RFS and PFS of cancer patients
Eleven studies comprising 3,972 patients reported hazard ratios for CSS [7, 8, 11, 18, 19, 22, 24, 25, 44, 58, 59]. The effect of LMR on CSS among cancer subgroups is presented in Figure 4A. The lower LMR was significantly associated with poor CSS in colorectal carcinoma (HR: 0.55, 95% CI: 0.42–0.71; P < 0.001), soft tissue sarcoma (HR: 0.38, 95% CI: 0.20–0.72; P = 0.003), Hodgkin’s lymphoma (HR: 0.09, 95% CI: 0.04–0.21; P < 0.001) and other non-hematological malignancies (HR: 0.79, 95% CI: 0.68–0.91; P = 0.002). Fifteen studies comprising 6,440 patients reported hazard ratios for DFS [8, 9, 11, 14, 18, 20, 23, 24, 28, 30, 34, 38, 43, 45, 47]. The effect of LMR on DFS among cancer subgroups is presented in Figure 4B. The lower LMR was significantly associated with poor DFS in soft tissue sarcoma (HR: 0.37, 95% CI: 0.21–0.67; P = 0.001), DLBCL (HR: 0.55, 95% CI: 0.35–0.88; P = 0.013), other non-hematological malignancies (HR: 0.71, 95% CI: 0.62–0.83; P < 0.001). However, the association was not significant in colorectal carcinoma (HR: 0.85, 95% CI: 0.63–1.15; P = 0.301) and other hematological malignancies (HR: 0.74, 95% CI: 0.51–1.06; P = 0.100). Seven studies comprising 1,849 patients reported hazard ratios for RFS [12, 26, 29, 32, 35, 36, 56]. A combined analysis showed that LMR lower than the cutoff was associated with poor RFS in non-hematological malignancy (HR: 0.50, 95% CI: 0.36–0.70; P < 0.001). In addition, Markovic et al. [35] reported a non-significant result for DLBCL (HR: 0.70, 95% CI: 0.40–1.23; P = 0.212) (Figure 5A). Eighteen studies comprising 5,805 patients reported hazard ratios for PFS [15, 16, 28, 31, 36, 39, 41, 42, 46, 48, 50, 52, 54, 57–60, 62]. The effect of LMR on PFS among cancer subgroups is presented in Figure 5B. The lower LMR was significantly associated with poor PFS in lung cancer (HR: 0.64, 95% CI: 0.52–0.78; P < 0.001), DLBCL (HR: 0.44, 95% CI: 0.32–0.61; P < 0.001), follicular lymphoma (HR: 0.33, 95% CI: 0.16–0.69; P = 0.003) and Hodgkin’s lymphoma (HR: 0.38, 95% CI: 0.23–0.64; P < 0.001). In addition, Wang et al. [15] reported a significant result for Burkitt lymphoma (HR: 0.19, 95% CI: 0.05–0.70; P = 0.012).
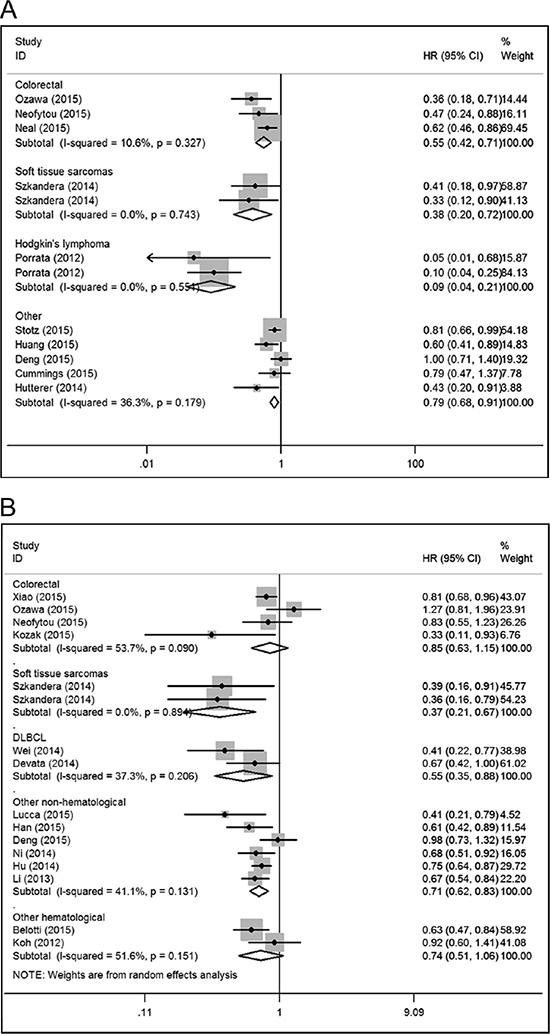
Figure 4: Forest plots for the meta-analysis of the association between LMR and cancer-specific survival (CSS), disease-free survival (DFS) in various cancer types. (A) The lower LMR was significantly associated with poor CSS in colorectal carcinoma, soft tissue sarcoma, Hodgkin’s lymphoma and other non-hematological malignancies. (B) The lower LMR was significantly associated with poor DFS in soft tissue sarcoma, DLBCL, other non-hematological malignancies but not in colorectal carcinoma and other hematological malignancies.
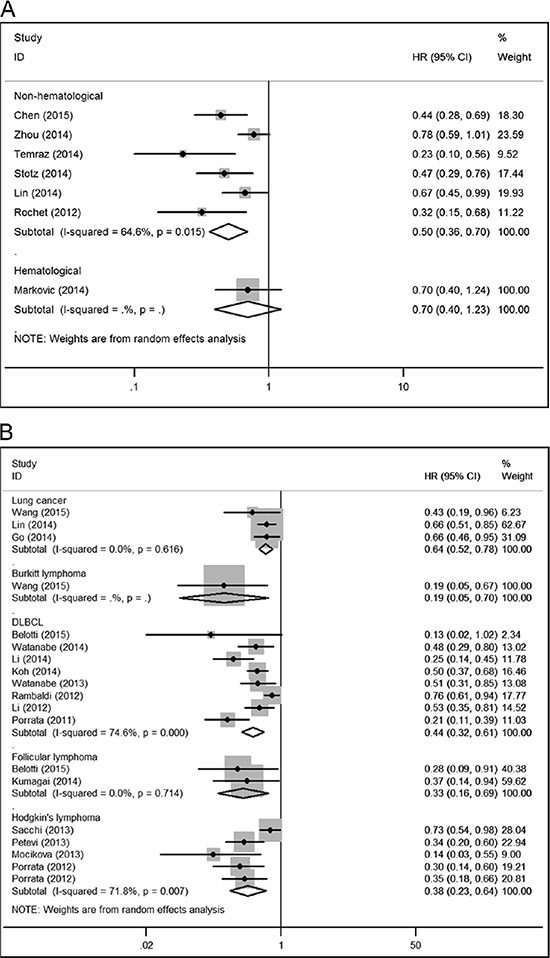
Figure 5: Forest plots for the meta-analysis of the association between LMR and recurrence-free survival (RFS), progression-free survival (PFS) in various cancer types. (A) A combined analysis showed that LMR lower than the cutoff was associated with poor RFS in non-hematological malignancy. In addition, a non-significant result for DLBCL was reported. (B) The lower LMR was significantly associated with poor PFS in lung cancer, DLBCL, follicular lymphoma and Hodgkin’s lymphoma. In addition, a significant result for Burkitt lymphoma was reported.
The association between LMR and characteristics of cancer patients
Twenty-one studies provided sufficient data for the meta-analysis of the correlation between LMR and clinicopathological characteristics (Table 3) [10, 22–24, 29–32, 37, 39, 42, 43, 46, 51, 58–61]. Urothelial carcinoma, esophageal cancer, gastric cancer, renal cell carcinoma, lung cancer, DLBCL and Hodgkin’s lymphoma were investigated in detail. For each disease excluding urothelial carcinoma, low LMR was significantly associated with some clinicopathological characteristics that are indicative of poor prognosis and disease aggressiveness.
Table 3: Results of meta-analysis of LMR and characteristics of six types of cancer
Characteristics |
Studies |
Patients |
OR (95% CI) |
P value |
Heterogeneity |
|
|---|---|---|---|---|---|---|
I2 (%) |
P value |
|||||
Urothelial carcinoma |
|
|
|
|
|
|
pT stage |
3 |
374 |
0.86 (0.51–1.47) |
0.588 |
0 |
0.414 |
Tumor grade |
3 |
374 |
1.07 (0.62–1.85) |
0.805 |
0 |
0.825 |
Esophageal cancer |
|
|
|
|
|
|
Tumor length |
2 |
566 |
0.66 (0.44–0.98) |
0.041 |
0 |
0.466 |
pT stage |
2 |
566 |
0.59 (0.40–0.86) |
0.007 |
0 |
0.808 |
Lymph node status |
2 |
566 |
0.59 (0.41–0.84) |
0.004 |
0 |
0.630 |
Gastric cancer |
|
|
|
|
|
|
Tumor grade |
2 |
815 |
0.88 (0.64–1.22) |
0.444 |
17.1 |
0.272 |
TNM stage |
2 |
815 |
0.52 (0.39–0.70) |
< 0.001 |
92.2 |
< 0.001 |
Renal cell carcinoma |
|
|
|
|
|
|
Fuhrman grade |
2 |
1119 |
0.52 (0.39–0.69) |
< 0.001 |
0 |
0.576 |
Tumor necrosis |
2 |
1119 |
0.57 (0.43–0.75) |
< 0.001 |
45.2 |
0.177 |
Lung cancer |
|
|
|
|
|
|
ECOG performance status |
2 |
558 |
0.59 (0.39–0.90) |
0.013 |
47.1 |
0.169 |
Diffuse large B-cell lymphoma |
|
|
|
|
|
|
Ann Arbor stage |
6 |
2869 |
0.42 (0.36–0.49) |
< 0.001 |
29.3 |
0.194 |
IPI score |
4 |
1907 |
0.38 (0.31–0.47) |
< 0.001 |
0 |
0.727 |
ECOG performance status |
5 |
2701 |
0.39 (0.31–0.48) |
< 0.001 |
74.3 |
0.001 |
Extranodal sites of disease |
6 |
2869 |
0.58 (0.48–0.69) |
< 0.001 |
61.6 |
0.011 |
Serum LDH level |
6 |
2869 |
0.27 (0.23–0.32) |
< 0.001 |
68.9 |
0.002 |
B symptom |
2 |
962 |
0.38 (0.25–0.58) |
< 0.001 |
0 |
0.364 |
Hodgkin’s lymphoma |
|
|
|
|
|
|
Ann Arbor stage |
4 |
1188 |
0.42 (0.33–0.53) |
< 0.001 |
78.6 |
0.003 |
Stage |
3 |
1085 |
0.40 (0.31–0.52) |
< 0.001 |
81.5 |
0.005 |
IPS |
2 |
609 |
0.26 (0.16–0.42) |
< 0.001 |
0 |
0.723 |
WBC count |
4 |
1188 |
0.67 (0.46–0.99) |
0.047 |
0 |
0.686 |
Albumin |
4 |
1188 |
0.47 (0.36–0.60) |
< 0.001 |
68 |
0.025 |
Hemoglobin |
4 |
1188 |
0.41 (0.30–0.56) |
< 0.001 |
57.8 |
0.068 |
LMR, lymphocyte to monocyte ratio; OR, odds ratio; CI, confidence interval; ECOG, eastern cooperative oncology group; IPI, international prognostic index; LDH, lactate dehydrogenase; IPS, international prognostic score.
Regarding predictive factors for DLBCL, low LMR was significantly associated with high serum LDH level (HR: 0.27, 95% CI: 0.23–0.32; P < 0.001). Regarding predictive factors for Hodgkin’s lymphoma, low LMR was significantly associated with high white blood cell count (HR: 0.67, 95% CI: 0.46–0.99; P = 0.047), low albumin (HR: 0.47, 95% CI: 0.36–0.60; P < 0.001) and low Hemoglobin (HR: 0.41, 95% CI: 0.30–0.56; P < 0.001).
DISCUSSION
The post-operative histopathological parameters, which mainly focus on the biological behavior and presentation of the tumor itself, act as the foundation for subdividing cancer patients and determining the suitable treatment. However, these variables might not be entirely reliable for predicting the prognosis precisely and guiding the clinical practice appropriately. The introduction of the laboratory index as a supplementary item to current prognostic prediction system is required for tailoring the personalized treatment strategy.
So far, the prognostic significance of the markers of systematic inflammatory response to solid tumors has been identified [63–65]. A variety of recent studies have suggested that a decreased LMR is associated with poor survival of subjects with cancer. In the present study, we showed that decreased pretreatment LMR has an unfavorable impact on OS in cancer patients among various disease subgroups. Inflammation has been reported to contribute to the development of many tumors and is now considered as a hallmark of cancer [66]. Additionally, we found a trend for the association of low LMR with poor OS to be greater for metastatic than non-metastatic cancer, which may reflect either higher tumor burden or a more prolonged chronic inflammatory process [2]. The prognostic impact of LMR on CSS, DFS, RFS and PFS was retained across cancer sites. A key point of our study was that the cutoff level varied and ranged from 1.1 to 5.26, and although some studies reported that cutoffs were determined using receiver operating characteristic curves (ROC), the approach of choosing LMR cutoffs remained unclear in many papers. And we identified that there was a correlation between LMR cutoff and reported hazard ratio for OS. Koh et al. identified the LMR being related to the age of patients. Therefore it also is imaginable that the optimal cutoff has to be adjusted based on now unknown clinicopathological parameters and/or by each tumor entity on its own [42].
Our results also indicate that LMR was associated with tumor length, pT stage, lymph node status in esophageal cancer. LMR was associated with TNM stage in gastric cancer. LMR was correlated with Fuhrman grade, tumor necrosis in renal cell carcinoma. LMR was correlated with ECOG performance status in lung cancer. Further, we found that LMR was associated with Ann Arbor stage, IPI score, ECOG performance status, extranodal sites of disease, serum LDH level and B symptom in DLBCL, and with Ann Arbor stage, stage, IPS, WBC count, albumin level and hemoglobin level in Hodgkin’s lymphoma. As LMR measurement is well standardized and available in every clinical laboratory, it could be a helpful and convenient serum biomarker for clinical practice.
Our results agree with several studies conducted at the same time [67–69]. Compared with these publications, our meta-analysis has several strengths. First, in contrast to these studies focusing on DLBCL or non-hematological solid tumors, we studied all types of malignancy. Because of the different tumor biology, the meta-analyses were performed for non-hematological and hematological malignancy respectively. Second, besides outcomes reported in these studies, we also investigated the RFS and PFS for non-hematological solid tumors, and CSS for hematological malignancy, which provided comprehensive evidence for the prognostic role of LMR in patients with cancer. In addition, the relationships between LMR and the features of tumor patients were also studied in our meta-analysis, which were never discussed in these studies. Hence, to our knowledge, the present meta-analysis is the most comprehensive and informative study.
Significant heterogeneity was observed in most of our analyses. Subgroup analyses were preformed to present more results in detail. Meta-regression and sensitivity analyses did not alter the significant correlation of LMR with survival outcomes and reveal some significant sources of heterogeneity. However, certain stratifying covariates might contribute to the limited statistical power of meta-regression.
The reasons why LMR might be of prognostic relevance in patients suffering cancer remain speculative at this time. Lymphocyte is a key mediator of immunosurveillance and immune-editing, and lymphocyte infiltration into the tumor microenviroment is a prerequisite to an immunologic antitumor reaction [70–72]. The presence of tumor-infiltrating lymphocytes is related to improved survival in diverse cancers, and conversely, low lymphocyte counts and failure to infiltrate the tumor lead to inferior survival [71, 73]. In addition, CD 8+ and CD 4+ T-lymphocyte interaction among each other could be proven to be essential in anti-tumor reaction of the immune system, by inducing tumor cell apoptosis [74, 75]. Generally, a low lymphocyte amount could be the reason for a weak, insufficient immunologic reaction to the tumor [71]. Nevertheless, monocytes infiltrating tumor tissue also have an effect on tumor development and progression [3]. Monocytes exert a major role in innate immunity, constitute about 5% of the circulating white blood cell pool and exhibit a short half-life in the circulation of a few hours [76]. Macrophages, which are more differentiated monocytes, develop from cells of the mononuclear phagocytic lineage and show specific phenotypic characteristics. The role of macrophages/monocytes in cancer development and progression is disputed, since they have inhibiting as well as enhancing potential of monocytes in human cancer [77]. Nevertheless, there is increasing evidence that the tumor-associated macrophages (TAMs) enhance tumor progression. Bingle et al. [78] showed poor clinical outcome associated with macrophage density in various tumor entities. Pollard and Condeelis et al. [79, 80] found that macrophages support tumor cell migration, invasion and intravasation as well as tumor-associated angiogenesis and even lead to a suppression of anti-tumor immune reaction. A major lineage regulator for macrophages, colony-stimulating factor 1 (CSF-1) [81], was shown to be associated with poorer prognosis in different cancer types [82]. Evani et al. [83] showed that monocytes play a role in metastasis of breast cancer by mediating the adhesion of tumor cells to the endothelium. Condeelis and Pollard found similar results, implicating macrophages for tumor cell migration and invasion [79]. Moreover, primary inflammatory macrophages change in tumor from phenotype to macrophages similar to those that play a role in the regulation of tissue formation during development [81]. Additionally, Lin et al. [84] and Jetten et al. [85] gave insight into the role of macrophages in angiogenesis and vascular remodeling induced by them in tumor formations. All this data suggests a pro tumorous potential of monocytes due to formation of diverse macrophage phenotypes that facilitate the malignant process.
Several limitations of this study need to be acknowledged. Only summarized data rather than individual subject data could be used. Second, we found evidence of publication bias, with fewer small studies reporting negative results than would be expected (Figure 3B–3C), which cannot be properly overcome by statistical techniques. Moreover, marked heterogeneity of subjects was seen in most of analyses. Meta-regression analysis revealed that cancer stage and cutoff for LMR might be significant contributors to heterogeneity for OS in non-hematological solid tumors. Also, the heterogeneity of the population was probably due to differences in factors such as study design, assay methods, patients’ baseline characteristics (race, country, gender, age, and tumor stage and grade), patients’ treatment, and duration of follow-up. In addition, the source of hazard ratio and method of calculating the HRs of these studies was also a potential factor that might have led to heterogeneity. Of the 56 studies, 50 directly provided HRs, and individual HRs of the remaining studies were calculated using the methods reported by Tierney et al. [86]. The calculated HRs could be not as dependable as those retrieved directly from reported statistics. Among the 50 studies providing HRs, five reported univariate hazard ratios, which could introduce a bias toward overestimation of the prognostic role of LMR [8, 18, 19, 33, 54]. In some studies, hazard ratios from multivariable analysis may not have been statistically significant, this might be attribute to inclusion of other markers of systemic inflammation in the multivariable model, which may provide similar information to LMR and thus lead to a non-statistically significant outcome [11, 24, 25]. Furthermore, lymphocyte and monocyte count are nonspecific parameters, which may be influenced by concurrent conditions such as inflammation, infections, and medications. However, most studies reported LMR ahead of surgery or before start of systemic treatment. Despite this, the confounding effect of concurrent inflammatory conditions can’t be completely excluded. Finally, the unavoidable limitations exist. All meta-analyses are affected by the quality of their component studies; the fact that research with statistically significant results is potentially more likely to be submitted and published than work with null or non-significant results, could compromise the validity of such analyses. Furthermore, the current meta-analysis of published studies does not have the benefit of currently unpublished data. Owing to further groundbreaking research on inflammation and tumors, we believe that the use of LMR as a prognostic marker for cancer will be extensively studied, and additional studies supporting our results will facilitate a consensus on this matter.
Our comprehensive meta-analysis strongly supports a low LMR is associated with adverse survival in various cancers. The relative availability and low cost of this biomarker should facilitate its use in this context, although a large prospective study is needed to confirm our findings.
MATERIALS AND METHODS
This meta-analysis was conducted following the guidelines of the Meta-analysis of Observational Studies in Epidemiology group (MOOSE) [87] and Preferred Reporting Items for Systematic Reviews and Meta-analysis (PRISMA) criteria [88].
Search strategy
A systematic literature search was performed using PubMed, Embase and Web of Science databases. Our search strategy included terms for: “LMR” (e.g., “lymphocyte to monocyte ratio,” “lymphocyte monocyte ratio,” “lymphocyte-to-monocyte ratio”), “prognosis” (e.g., “prognosis,” “outcome,” “survival,” “mortality,” “recurrence” “progression,” “metastasis”) and “cancer” (e.g., “cancer,” “tumor,” “neoplasm” “carcinoma”). The literature search was conducted in July 2015. Additionally, we manually screened the references from the relevant literature, including all of the identified studies, reviews, and editorials.
Study selection
Inclusion criteria for selecting the articles for our analysis were as follows: (1) studies of people with cancer reporting on the prognostic impact of the peripheral blood LMR; (2) measurement of LMR before specific treatments; (3) clearly described outcome assessment by representing it in overall survival (OS), cancer-specific survival (CSS), disease-free survival (DFS), recurrence-free survival (RFS) or progression-free survival (PFS); (4) survival outcome was further explored considering Hazard ratio (HR) with Confidence interval (CI), HR with P value, Kaplan-Meier curves or the required data for calculating HR and CI; (5) retrospective or prospective study design; (6) median follow-up of at least 6 months.
Exclusion criteria were as follows: (1) were not written in English; (2) were letters, editorials, expert opinions, reviews, case reports; (3) non-human research; (4) sampled fewer than 40 patients; (5) dealt with LMR as a continuous rather than a dichotomized variable; or (6) lacked sufficient data for estimating HRs and their 95% CIs. When duplicate studies were retrieved, we included the more informative and recent article. Three reviewers (L.Y.G., H.Z.L. and L.Y.C) identified all the studies that fit the inclusion criteria for full review. Discrepancies were resolved through discussion.
Data extraction and synthesis
OS was the primary outcome of interest. CSS, DFS, RFS and PFS were secondary outcomes. The three investigators (L.Y.G., H.Z.L. and L.Y.C) extracted data independently, used a predefined form to extract all relevant information. The following details were extracted: the first author’s last name, year of publication, type of publication (full text, abstract), study design, number of patients, type of cancer, cancer stage (non-metastatic, metastatic, mixed [non-metastatic and metastatic]), cut-off value, receiver operating characteristic (ROC) curves considered for selection of cut-off, and HR and 95% CI for OS, CSS, DFS, RFS or PFS as applicable. HRs were extracted preferentially from multivariable analyses where available. Otherwise, HRs from univariate analyses were extracted. When HRs were not provided, we calculated them with the original study data (Kaplan-Meier curves or the required data) by using the methods reported by Tierney et al. [86]. For OS, because of the different tumor biology, the meta-analyses were performed initially for all included studies in non-hematological and hematological malignancy respectively. Then, meta-analyses were performed according to different types of malignancy. In order to explore source of heterogeneity, subgroup analyses were also conducted for predefined parameters such as study design, type of publication, type of cancer, cancer stage and so on. Subgroups were generated if at least two studies on that were available. For secondary outcomes, meta-analyses were performed according to different types of malignancy.
The relationships between LMR and the features of tumor patients were also studied. Data on pathological T stage (T2-4 versus T1), tumor grade (III/IV versus I/II) of urothelial carcinoma; tumor length (> 3 versus ≤ 3), pathological T stage (T3/T4 versus T1/T2), lymph node status (positive versus negative) of esophageal cancer; tumor grade (III/IV versus I/II), TNM stage (III/IV versus I/II) of gastric cancer; Fuhrman grade (III/IV versus I/II), tumor necrosis (present versus absent) of renal cell carcinoma; ECOG performance status (≥ 2 versus < 2) of lung cancer; Ann Arbor stage (III/IV versus I/II), IPI score (> 2 versus ≤ 2), ECOG performance status (> 1 versus ≤ 1), extranodal sites (≥ 2 versus < 2), serum LDH level (high versus normal), B symptom (present versus absent) of diffuse large B-cell lymphoma (DLBCL); Ann Arbor stage (III/IV versus I/II), stage (III/IV versus I/II), IPS (≥ 4 versus < 4), WBC count (× 103 cells/μ l) (≥ 15 versus < 15), albumin (g/dl) (≥ 4 versus < 4), hemoglobin (g/dl) (≥ 10.5 versus < 10.5) of Hodgkin’s lymphoma were dichotomized. The odds ratio (OR) and corresponding 95% CI were extracted and used in meta-analysis.
Statistical analysis
A test of heterogeneity of combined HRs and ORs was conducted using Cochran’s Q test and Higgins I-squared statistic. A P value of less than 0.1 was considered significant. I2 > 50% is considered as a measure of severe heterogeneity. When heterogeneity was significant, we used a random-effect model. Otherwise, we used a fixed-effect model. An observed HR or OR < 1 implied poor survival for the group with a low LMR or a significant association between a low LMR and patients features. We pooled HRs and ORs of the studies by using Stata 12.0 software (StatCorp, College Station, TX, USA). The reasons for inter-study heterogeneity were also explored by using meta-regression analysis and subgroup analysis. We also conducted sensitivity analysis by omission of each single study to evaluate stability of the results. The correlation of cutoff and HR for OS was analyzed by linear regression analysis. To assess the risk of publication bias, we used a funnel plot, the Begg’s and Egger’s test for outcomes when at least 10 studies were included in the meta-analysis. All statistical tests were two-sided, and statistical significance was defined as P less than 0.05.
FUNDING
This work was financially supported by the People’s Republic of China and the National High Technology Research and Development Program (“863”Program) of China: the screening and clinical validation of characteristic protein biomarkers in renal cancer based on a large-scale biobank (2014AA020607).
CONFLICTS OF INTEREST
The authors declare no conflicts of interest.
REFERENCES
1. Grivennikov SI, Greten FR, Karin M. Immunity, inflammation, and cancer. Cell. 2010; 140:883–899.
2. Aggarwal BB, Vijayalekshmi RV, Sung B. Targeting inflammatory pathways for prevention and therapy of cancer: short-term friend, long-term foe. Clin Cancer Res. 2009; 15:425–430.
3. Mantovani A, Allavena P, Sica A, Balkwill F. Cancer-related inflammation. Nature. 2008; 454:436–444.
4. Roxburgh CS, McMillan DC. Role of systemic inflammatory response in predicting survival in patients with primary operable cancer. Future Oncol. 2010; 6:149–163.
5. Guthrie GJ, Charles KA, Roxburgh CS, Horgan PG, McMillan DC, Clarke SJ. The systemic inflammation-based neutrophil-lymphocyte ratio: experience in patients with cancer. Crit Rev Oncol Hematol. 2013; 88:218–230.
6. McMillan DC. The systemic inflammation-based Glasgow Prognostic Score: a decade of experience in patients with cancer. Cancer Treat Rev. 2013; 39:534–540.
7. Stotz M, Szkandera J, Stojakovic T, Seidel J, Samonigg H, Kornprat P, et al. The lymphocyte to monocyte ratio in peripheral blood represents a novel prognostic marker in patients with pancreatic cancer. Clin Chem Lab Med. 2015; 53:499–506.
8. Neofytou K, Smyth EC, Giakoustidis A, Khan AZ, Williams R, Cunningham D, et al. The Preoperative Lymphocyte-to-Monocyte Ratio is Prognostic of Clinical Outcomes for Patients with Liver-Only Colorectal Metastases in the Neoadjuvant Setting. Ann Surg Oncol. 2015.
9. Lucca I, de Martino M, Hofbauer SL, Zamani N, Shariat SF, Klatte T. Comparison of the prognostic value of pretreatment measurements of systemic inflammatory response in patients undergoing curative resection of clear cell renal cell carcinoma. World J Urol. 2015.
10. Hutterer GC, Sobolev N, Ehrlich GC, Gutschi T, Stojakovic T, Mannweiler S, et al. Pretreatment lymphocyte-monocyte ratio as a potential prognostic factor in a cohort of patients with upper tract urothelial carcinoma. J Clin Pathol. 2015; 68:351–355.
11. Szkandera J, Gerger A, Liegl-Atzwanger B, Absenger G, Stotz M, Friesenbichler J, et al. The lymphocyte/monocyte ratio predicts poor clinical outcome and improves the predictive accuracy in patients with soft tissue sarcomas. Int J Cancer. 2014; 135:362–370.
12. Stotz M, Pichler M, Absenger G, Szkandera J, Arminger F, Schaberl-Moser R, et al. The preoperative lymphocyte to monocyte ratio predicts clinical outcome in patients with stage III colon cancer. Br J Cancer. 2014; 110:435–440.
13. Zhang GM, Zhu Y, Luo L, Wan FN, Zhu YP, Sun LJ, et al. Preoperative lymphocyte-monocyte and platelet-lymphocyte ratios as predictors of overall survival in patients with bladder cancer undergoing radical cystectomy. Tumour Biol. 2015.
14. Xiao WW, Zhang LN, You KY, Huang R, Yu X, Ding PR, et al. A Low Lymphocyte-to-Monocyte Ratio Predicts Unfavorable Prognosis in Pathological T3N0 Rectal Cancer Patients Following Total Mesorectal Excision. J Cancer. 2015; 6:616–622.
15. Wang L, Wang H, Xia ZJ, Huang HQ, Jiang WQ, Lin TY, et al. Peripheral blood lymphocyte to monocyte ratio identifies high-risk adult patients with sporadic Burkitt lymphoma. Ann Hematol. 2015.
16. Wang L, Long W, Li PF, Lin YB, Liang Y. An Elevated Peripheral Blood Monocyte-to-Lymphocyte Ratio Predicts Poor Prognosis in Patients with Primary Pulmonary Lymphoepithelioma-Like Carcinoma. PLoS One. 2015; 10:e0126269.
17. Qi Q, Geng Y, Sun M, Wang P, Chen Z. Clinical implications of systemic inflammatory response markers as independent prognostic factors for advanced pancreatic cancer. Pancreatology. 2015; 15:145–150.
18. Ozawa T, Ishihara S, Kawai K, Kazama S, Yamaguchi H, Sunami E, et al. Impact of a lymphocyte to monocyte ratio in stage IV colorectal cancer. J Surg Res. 2015.
19. Neal CP, Cairns V, Jones MJ, Masood MM, Nana GR, Mann CD, et al. Prognostic performance of inflammation-based prognostic indices in patients with resectable colorectal liver metastases. Med Oncol. 2015; 32:590.
20. Kozak MM, von Eyben R, Pai JS, Anderson EM, Welton ML, Shelton AA, et al. The Prognostic Significance of Pretreatment Hematologic Parameters in Patients Undergoing Resection for Colorectal Cancer. Am J Clin Oncol. 2015.
21. Jiang R, Cai XY, Yang ZH, Yan Y, Zou X, Guo L, et al. Elevated peripheral blood lymphocyte-to-monocyte ratio predicts a favorable prognosis in the patients with metastatic nasopharyngeal carcinoma. Chin J Cancer. 2015; 34:23.
22. Huang Y, Feng JF. Low preoperative lymphocyte to monocyte ratio predicts poor cancer-specific survival in patients with esophageal squamous cell carcinoma. Onco Targets Ther. 2015; 8:137–145.
23. Han LH, Jia YB, Song QX, Wang JB, Wang NN, Cheng YF. Prognostic significance of preoperative lymphocyte-monocyte ratio in patients with resectable esophageal squamous cell carcinoma. Asian Pac J Cancer Prev. 2015; 16:2245–2250.
24. Deng Q, He B, Liu X, Yue J, Ying H, Pan Y, et al. Prognostic value of pre-operative inflammatory response biomarkers in gastric cancer patients and the construction of a predictive model. J Transl Med. 2015; 13:66.
25. Cummings M, Merone L, Keeble C, Burland L, Grzelinski M, Sutton K, et al. Preoperative neutrophil:lymphocyte and platelet:lymphocyte ratios predict endometrial cancer survival. Br J Cancer. 2015; 113:311–320.
26. Chen L, Zhang F, Sheng XG, Zhang SQ. Decreased pretreatment lymphocyte/monocyte ratio is associated with poor prognosis in stage Ib1-IIa cervical cancer patients who undergo radical surgery. Onco Targets Ther. 2015; 8:1355–1362.
27. Chang Y, An H, Xu L, Zhu Y, Yang Y, Lin Z, et al. Systemic inflammation score predicts postoperative prognosis of patients with clear-cell renal cell carcinoma. Br J Cancer. 2015.
28. Belotti A, Doni E, Bolis S, Rossini F, Casaroli I, Pezzatti S, et al. Peripheral Blood Lymphocyte/Monocyte Ratio Predicts Outcome in Follicular Lymphoma and in Diffuse Large B-Cell Lymphoma Patients in the Rituximab Era. Clin Lymphoma Myeloma Leuk. 2015; 15:208–213.
29. Zhou X, Du Y, Xu J, Huang Z, Qiu T, Wang X, et al. The preoperative lymphocyte to monocyte ratio predicts clinical outcomes in patients with stage II/III gastric cancer. Tumour Biol. 2014; 35:11659–11666.
30. Wei X, Huang F, Wei Y, Jing H, Xie M, Hao X, et al. Low lymphocyte-to-monocyte ratio predicts unfavorable prognosis in non-germinal center type diffuse large B-cell lymphoma. Leuk Res. 2014; 38:694–698.
31. Watanabe R, Tomita N, Itabashi M, Ishibashi D, Yamamoto E, Koyama S, et al. Peripheral blood absolute lymphocyte/monocyte ratio as a useful prognostic factor in diffuse large B-cell lymphoma in the rituximab era. Eur J Haematol. 2014; 92:204–210.
32. Temraz S, Mukherji D, Farhat ZA, Nasr R, Charafeddine M, Shahait M, et al. Preoperative lymphocyte-to-monocyte ratio predicts clinical outcome in patients undergoing radical cystectomy for transitional cell carcinoma of the bladder: a retrospective analysis. BMC Urol. 2014; 14:76.
33. Prochazka V, Pytlik R, Janikova A, Belada D, Salek D, Papajik T, et al. A new prognostic score for elderly patients with diffuse large B-cell lymphoma treated with R-CHOP: the prognostic role of blood monocyte and lymphocyte counts is absent. PLoS One. 2014; 9:e102594.
34. Ni XJ, Zhang XL, Ou-Yang QW, Qian GW, Wang L, Chen S, et al. An elevated peripheral blood lymphocyte-to-monocyte ratio predicts favorable response and prognosis in locally advanced breast cancer following neoadjuvant chemotherapy. PLoS One. 2014; 9:e111886.
35. Markovic O, Popovic L, Marisavljevic D, Jovanovic D, Filipovic B, Stanisavljevic D, et al. Comparison of prognostic impact of absolute lymphocyte count, absolute monocyte count, absolute lymphocyte count/absolute monocyte count prognostic score and ratio in patients with diffuse large B cell lymphoma. Eur J Intern Med. 2014; 25:296–302.
36. Lin ZX, Ruan DY, Wu DH, Ma XK, Wen JY, Li X, et al. Prognostic value of preoperative lymphocyte-to-monocyte ratio in patients with hepatocellular carcinoma after curative resection. Journal of Clinical Oncology. 2014; 32.
37. Lin GN, Peng JW, Xiao JJ, Liu DY and Xia ZJ. Prognostic impact of circulating monocytes and lymphocyte-to-monocyte ratio on previously untreated metastatic non-small cell lung cancer patients receiving platinum-based doublet. Med Oncol. 2014; 31:70.
38. Lin GN, Peng JW, Liu DY, Xiao JJ, Chen YQ, Chen XQ. Increased lymphocyte to monocyte ratio is associated with better prognosis in patients with newly diagnosed metastatic nasopharyngeal carcinoma receiving chemotherapy. Tumour Biol. 2014; 35:10849–10854.
39. Li YL, Pan YY, Jiao Y, Ning J, Fan YG, Zhai ZM. Peripheral blood lymphocyte/monocyte ratio predicts outcome for patients with diffuse large B cell lymphoma after standard first-line regimens. Ann Hematol. 2014; 93:617–626.
40. Le RQ, Tian X, Jain NA, Lu K, Ito S, Draper DA, et al. Clinical comorbidity measures and predictive scores in ex vivo t cell depleted allogeneic hematopoietic stem cell transplantation. Blood. 2014; 124.
41. Kumagai S, Tashima M, Fujikawa J, Iwasaki M, Iwamoto Y, Sueki Y, et al. Ratio of peripheral blood absolute lymphocyte count to absolute monocyte count at diagnosis is associated with progression-free survival in follicular lymphoma. Int J Hematol. 2014; 99:737–742.
42. Koh YW, Park CS, Yoon DH, Suh C, Huh J. Should the cut-off values of the lymphocyte to monocyte ratio for prediction of prognosis in diffuse large B-cell lymphoma be changed in elderly patients? European Journal of Haematology. 2014; 93:340–348.
43. Koh YW, Jung SJ, Yoon DH, Suh C, Cha HJ, Go H, et al. The absolute lymphocyte to monocyte ratio is associated with poor prognosis in classical Hodgkin lymphoma patients younger than 60years of age. Hematological Oncology. 2014.
44. Hutterer GC, Stoeckigt C, Stojakovic T, Jesche J, Eberhard K, Pummer K, et al. Low preoperative lymphocyte-monocyte ratio (LMR) represents a potentially poor prognostic factor in nonmetastatic clear cell renal cell carcinoma. Urol Oncol. 2014; 32:1041–1048.
45. Hu P, Shen H, Wang G, Zhang P, Liu Q, Du J. Prognostic significance of systemic inflammation-based lymphocyte- monocyte ratio in patients with lung cancer: based on a large cohort study. PLoS One. 2014; 9:e108062.
46. Go SI, Kim RB, Song HN, Kang MH, Lee US, Choi HJ, et al. Prognostic significance of the lymphocyte-to-monocyte ratio in patients with small cell lung cancer. Med Oncol. 2014; 31:323.
47. Devata S, Herrman N, Briski R, Keyoumarsi F, Boyer DF, Lim MS, et al. The absolute lymphocyte to monocyte ratio at diagnosis further stratifies survival based on cell of origin in diffuse large B-cell lymphoma. Blood. 2014; 124.
48. Watanabe R, Tomita N, Itabashi M, Ishibashi D, Yamamoto E, Koyama S, et al. Peripheral blood absolute lymphocyte/monocyte ratio predicts clinical outcomes in diffuse large B-cell lymphoma treated with R-CHOP. Hematological Oncology. 2013; 31:225.
49. Shin SJ, Roh J, Kim M, Jung MJ, Koh YW, Park CS, et al. Prognostic significance of absolute lymphocyte count/absolute monocyte count ratio at diagnosis in patients with multiple myeloma. Korean J Pathol. 2013; 47:526–533.
50. Sacchi S, Bari A, Tadmor T, Marcheselli L, Pozzi S, Liardo EV, et al. Are absolute monocyte count and the Lymphocyte-Monocyte Ratio (LMR) valid prognostic factors in classical hodgkin lymphoma? An evaluation based on data from 1079 patients. Blood. 2013; 122.
51. Rambaldi A, Boschini C, Gritti G, Delaini F, Oldani E, Rossi A, et al. The lymphocyte to monocyte ratio improves the IPI-risk definition of diffuse large B-cell lymphoma when rituximab is added to chemotherapy. Am J Hematol. 2013; 88:1062–1067.
52. Petevi K, Angelopoulou M, Moschogiannis M, Boutsikas G, Kanellopoulos A, Siakantaris M, et al. The prognostic significance of the absolute lymphocyte to absolute monocyte count ratio (ALC/AMC) in hodgkin lymphoma (HL) under treatment with abvd or equivalent regimens. Hematological Oncology. 2013; 31:244.
53. Perini GF, De Moura Almeida A, Costa EMM, Hyppolito JE, Kerbauy FR, Hamerschlak N, et al. Lymphocyte:Monocyte ratio at the start of conditioning regimen is associated with survival post-autologous stem cell transplantation (ASCT) for lymphoma and myeloma. Blood. 2013; 122.
54. Mocikova H, Palickova M, Spacek M, Markova J, Kozak T. The prognostic impact of lymphocyte/monocyte ratio, absolute lymphocyte count and subsets of natural killer cells in peripheral blood in hodgkin lymphoma. Haematologica. 2013; 98:63.
55. Li J, Jiang R, Liu WS, Liu Q, Xu M, Feng QS, et al. A large cohort study reveals the association of elevated peripheral blood lymphocyte-to-monocyte ratio with favorable prognosis in nasopharyngeal carcinoma. PLoS One. 2013; 8:e83069.
56. Rochet NM, Porrata LF, Kottschade LA, Grotz TE, Markovic S. Preoperative peripheral blood lymphocyte/monocyte ratio and survival in patients with resected stage IV melanoma. Journal of Clinical Oncology. 2012; 30.
57. Rambaldi A, Boschini C, Delaini F, Oldani E, Rossi A, Barbui AM, et al. The peripheral blood lymphocyte to monocyte ratio at diagnosis is a potent outcome predictor in diffuse large B-cell lymphoma treated with R-CHOP: A long-term analysis on 973 patients receiving chemotherapy with or without rituximab. Blood. 2012; 120.
58. Porrata LF, Ristow K, Habermann TM, Witzig TE, Colgan JP, Inwards DJ, et al. Peripheral blood lymphocyte/monocyte ratio at diagnosis and survival in nodular lymphocyte-predominant Hodgkin lymphoma. Br J Haematol. 2012; 157:321–330.
59. Porrata LF, Ristow K, Colgan JP, Habermann TM, Witzig TE, Inwards DJ, et al. Peripheral blood lymphocyte/monocyte ratio at diagnosis and survival in classical Hodgkin’s lymphoma. Haematologica. 2012; 97:262–269.
60. Li ZM, Huang JJ, Xia Y, Sun J, Huang Y, Wang Y, et al. Blood lymphocyte-to-monocyte ratio identifies high-risk patients in diffuse large B-cell lymphoma treated with R-CHOP. PLoS One. 2012; 7:e41658.
61. Koh YW, Kang HJ, Park C, Yoon DH, Kim S, Suh C, et al. The ratio of the absolute lymphocyte count to the absolute monocyte count is associated with prognosis in Hodgkin’s lymphoma: correlation with tumor-associated macrophages. Oncologist. 2012; 17:871–880.
62. Porrata LF, Ristow KM, Colgan JP, Habermann TM, Witzig TE, Inwards DJ, et al. Peripheral blood lymphocyte/monocyte ratio at diagnosis is independent of the cell of origin in predicting survival in diffuse large B-cell lymphoma. Blood. 2011; 118.
63. Gu L, Li H, Gao Y, Ma X, Chen L, Li X, et al. The association of platelet count with clinicopathological significance and prognosis in renal cell carcinoma: a systematic review and meta-analysis. PLoS One. 2015; 10:e0125538.
64. Templeton AJ, McNamara MG, Seruga B, Vera-Badillo FE, Aneja P, Ocana A, et al. Prognostic role of neutrophil-to-lymphocyte ratio in solid tumors: a systematic review and meta-analysis. J Natl Cancer Inst. 2014; 106:dju124.
65. Templeton AJ, Ace O, McNamara MG, Al-Mubarak M, Vera-Badillo FE, Hermanns T, et al. Prognostic role of platelet to lymphocyte ratio in solid tumors: a systematic review and meta-analysis. Cancer Epidemiol Biomarkers Prev. 2014; 23:1204–1212.
66. Hanahan D, Weinberg RA. Hallmarks of cancer: the next generation. Cell. 2011; 144:646–674.
67. Lin B, Chen C, Qian Y, Feng J. Prognostic role of peripheral blood lymphocyte/monocyte ratio at diagnosis in diffuse large B-cell lymphoma: a meta-analysis. Leuk Lymphoma. 2015; 56:2563–2568.
68. Nishijima TF, Muss HB, Shachar SS, Tamura K, Takamatsu Y. Prognostic value of lymphocyte-to-monocyte ratio in patients with solid tumors: A systematic review and meta-analysis. Cancer Treat Rev. 2015; 41:971–978.
69. Teng JJ, Zhang J, Zhang TY, Zhang S, Li BS. Prognostic value of peripheral blood lymphocyte-to-monocyte ratio in patients with solid tumors: a meta-analysis. Onco Targets Ther. 2016; 9:37–47.
70. Dunn GP, Old LJ, Schreiber RD. The immunobiology of cancer immunosurveillance and immunoediting. Immunity. 2004; 21:137–148.
71. Hoffmann TK, Dworacki G, Tsukihiro T, Meidenbauer N, Gooding W, Johnson JT, et al. Spontaneous apoptosis of circulating T lymphocytes in patients with head and neck cancer and its clinical importance. Clin Cancer Res. 2002; 8:2553–2562.
72. Rabinowich H, Cohen R, Bruderman I, Steiner Z, Klajman A. Functional analysis of mononuclear cells infiltrating into tumors: lysis of autologous human tumor cells by cultured infiltrating lymphocytes. Cancer Res. 1987; 47:173–177.
73. Vayrynen JP, Tuomisto A, Klintrup K, Makela J, Karttunen TJ, Makinen MJ. Detailed analysis of inflammatory cell infiltration in colorectal cancer. Br J Cancer. 2013; 109:1839–1847.
74. Zikos TA, Donnenberg AD, Landreneau RJ, Luketich JD, Donnenberg VS. Lung T-cell subset composition at the time of surgical resection is a prognostic indicator in non-small cell lung cancer. Cancer Immunol Immunother. 2011; 60:819–827.
75. Rosenberg SA. Progress in human tumour immunology and immunotherapy. Nature. 2001; 411:380–384.
76. Parkin J, Cohen B. An overview of the immune system. Lancet. 2001; 357:1777–1789.
77. Hutterer GC, Pichler M, Chromecki TF, Strini KA, Klatte T, Pummer K, et al. Tumour-associated macrophages might represent a favourable prognostic indicator in patients with papillary renal cell carcinoma. Histopathology. 2013; 63:309–315.
78. Bingle L, Brown NJ, Lewis CE. The role of tumour-associated macrophages in tumour progression: implications for new anticancer therapies. J Pathol. 2002; 196:254–265.
79. Condeelis J, Pollard JW. Macrophages: obligate partners for tumor cell migration, invasion, and metastasis. Cell. 2006; 124:263–266.
80. Pollard JW. Tumour-educated macrophages promote tumour progression and metastasis. Nat Rev Cancer. 2004; 4:71–78.
81. Pollard JW. Trophic macrophages in development and disease. Nat Rev Immunol. 2009; 9:259–270.
82. Mroczko B, Groblewska M, Wereszczynska-Siemiatkowska U, Okulczyk B, Kedra B, Laszewicz W, et al. Serum macrophage-colony stimulating factor levels in colorectal cancer patients correlate with lymph node metastasis and poor prognosis. Clin Chim Acta. 2007; 380:208–212.
83. Evani SJ, Prabhu RG, Gnanaruban V, Finol EA, Ramasubramanian AK. Monocytes mediate metastatic breast tumor cell adhesion to endothelium under flow. Faseb j. 2013; 27:3017–3029.
84. Lin EY, Li JF, Gnatovskiy L, Deng Y, Zhu L, Grzesik DA, et al. Macrophages regulate the angiogenic switch in a mouse model of breast cancer. Cancer Res. 2006; 66:11238–11246.
85. Jetten N, Verbruggen S, Gijbels MJ, Post MJ, De Winther MP, Donners MM. Anti-inflammatory M2, but not pro-inflammatory M1 macrophages promote angiogenesis in vivo. Angiogenesis. 2014; 17:109–118.
86. Tierney JF, Stewart LA, Ghersi D, Burdett S, Sydes MR. Practical methods for incorporating summary time-to-event data into meta-analysis. Trials. 2007; 8:16.
87. Stroup DF, Berlin JA, Morton SC, Olkin I, Williamson GD, Rennie D, et al. Meta-analysis of observational studies in epidemiology: a proposal for reporting. Meta-analysis Of Observational Studies in Epidemiology (MOOSE) group. JAMA. 2000; 283:2008–2012.
88. Moher D, Liberati A, Tetzlaff J, Altman DG, Group P. Preferred reporting items for systematic reviews and meta-analyses: the PRISMA statement. BMJ. 2009; 339:b2535.