
INTRODUCTION
Head and neck cancer, squamous cell carcinoma (HNSCC) accounts for more than 90%, is widely represented as a heterogeneous solid tumor with more aggressive behaviors [1]. Despite ongoing efforts over the past several decades, radical surgery combined with radiotherapy and chemotherapy has not notably improved the 5-year survival rate of patients with HNSCC. The mainly reason contributing to the worse survival is because of the absence of robust therapeutic target in HNSCC development. It is well known that the development of HNSCC is a multi-step process in which the activation of oncogenes and inactivation of tumor suppressor genes, such as mutations of TP53 and CDKN2A and amplification of Cyclin D1 and EGFR [2–4]. Accordingly, better understanding the molecular basis of HNSCCs could further facilitate development of novel strategies to improve treatment of HNSCCs.
In mammals, X chromosome is unique, because both male and female cells carry only one active X chromosome. Tumor suppressor genes (TSGs) on chromosome X as ‘high risky’ genes can be inactivated by a single hit [5]. So far, several famous X-linked TSGs have been identified involving in cancer development, such as FOXP3 in glandular epithelial cancers [6], WTX in Wilms tumors [7], USP9X in pancreatic ductal adenocarcinomas [8] and RSK4 in endometrial cancers [9].
To identify X-linked TSGs in HNSCCs, a bioinformatics and Venn analysis of published transcriptional profiling were performed in this study. We identified the four-and-a-half LIM domains protein 1 (FHL1) gene from the 48 genes on chromosome X, which expression was over 2-fold differentially expressed in HNSCCs compared to normal adjacent tissues. Our findings further demonstrate that the downregulation of FHL1 in HNSCCs is commonly caused by hypermethylation on DNA promoter regions and EZH2-mediated histone methylation regulation. Silencing of FHL1 notably enhanced proliferation potential of HNSCC cells, whereas forced expression of FHL1 expression dramatically repressed growth of HNSCC cells in vitro and in vivo. High FHL1 transcriptional and translational levels were significantly associated with well differentiation, overall survival (OS) and disease-free survival (DFS) of patients with HNSCCs.
RESULTS
Screening for X-Linked candidate TSGs in HNSCC
For a common characteristics of TSGs in human cancer is aberrant silencing, we initially screened for potential TSGs by determining transcripts that were downregulated in HNSCCs in four data sets (GSE2379, GSE6631, GSE3524, and GSE13601) (Figure 1A). A Venn analysis further yielded 48 differentially expressed genes (≥ 2 fold) in those data sets with a FDR value < 0.05 (Supplementary Table S1). Using gene location distribution (Figure 1B), FHL1 (chrXq26) was identified with continuous decreased expression in four data sets (Figure 1C).
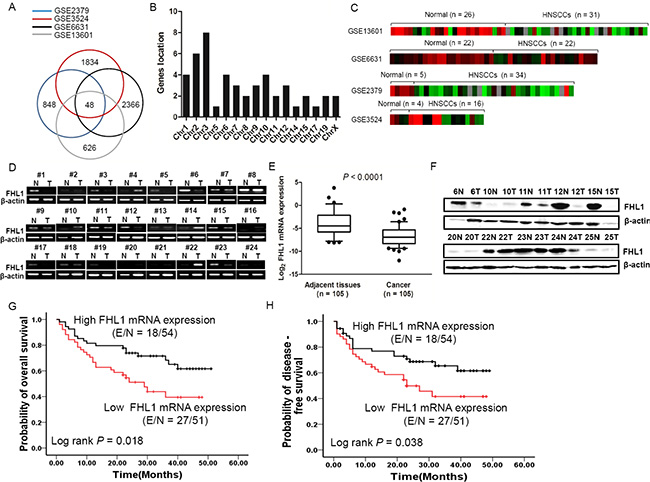
Figure 1: Downregulation of FHL1 was identified in four GSE databases (GSE2379, GSE3524, GSE6631 and GSE13601) and 105 HNSCCs. (A) 48 differentially expressed genes were identified by bioinformatics and Venn analysis from four GSE databases (blue cycle indicates GSE2379, red cycle indicates GSE3524, black cycle indicates GSE6631 and gay cycle indicates GSE13601). (B) 48 differentially expressed genes were localized in diverse Chromosomes. (C) The Heatmap of X-linked FHL1 was shown in four GSE databases. (D) Expression level of FHL1 mRNA in 24 representative HNSCCs and the corresponding adjacent tissues by using RT-PCR. (E) Expression levels of FHL1 mRNA were decreased in HNSCCs (n = 105) compared with adjacent tissues (n = 69) using real-time PCR analysis. For each sample, the relative mRNA level of FHL1 was normalized to β-action. The line within each box represents the median negative Ct value; the upper and lower edges of each box represent the 75th and 25th percentiles, respectively. (F) Expression level of FHL1 in 10 representative HNSCCs and the corresponding adjacent tissues tested by Western blotting. (G) Kaplan-Meier survival curve indicated overall survival by evaluation of FHL1 mRNA levels in the training cohort. (H) Kaplan-Meier survival curve indicated disease-free survival by evaluation of FHL1 mRNA levels in the training cohort.
We next examined the FHL1 expression patterns in HNSCC tissues. FHL1 mRNA expression was validated in HNSCC samples (n = 105) and paired ANTs (n = 69) by real-time PCR, RT-PCR and Western blotting. Our findings indicated that FHL1 mRNA levels and protein levels were notably reduced in HNSCCs as compared with PNA (Figure 1D and 1F).
FHL1 expression patterns were associated with poorer differentiation and worse clinical outcome
In the training cohort (n = 105), our results showed that low FHL1 mRNA levels were significantly associated with poorer tumor differentiation (p = 0.020) (Table 1) and worse OS (p = 0.018) or DFS (p = 0.038) (Figure 1G and 1H). There were no significant associations between FHL1 mRNA levels and other parameters. In multivariate COX proportional analyses (Supplementary Table S3), FHL1 mRNA expression status was identified as independent predictors of OS (p = 0.036; HR 0.520; Cl, 0.283–0.958) and DFS (p = 0.041; HR 0.527; Cl, 0.284– 0.975) in HNSCC patients. In the validation cohort (n = 101), a constant decreased FHL1 expression was observed from well-differentiated to poorly differentiated HNSCCs (p = 0.025) (Figure 2A). FHL1 expression levels were evaluated by the digital image analysis (IOD value) (Figure 2B). We also observed that FHL1 expressions were strongly associated with poorer OS (p = 0.004) and DFS (p = 0.005) (Figure 3C and 3D). Additionally, positive correlation between FHL1 protein levels and p16 expression pattern was found in HNSCC patients (p = 0.045) (Supplementary Table S2). Multivariate COX proportional analysis revealed that FHL1 expressions were verified as independent predictors of OS (p = 0.021; HR 0.404; Cl, 0.187–0.871) and DFS (p = 0.011; HR 0.407; Cl, 0.203–0.815) in patients with HNSCCs (Supplementary Table S3).
Table 1: Associations between FHL1 mRNA levels and clinical parameters in a training cohort (n = 105)
Characteristic |
No. of Patients (%) |
FHL1 mRNA expression |
P value |
|---|---|---|---|
Age, y |
105 (100) |
|
|
≥ 60 |
55 (52.4) |
0.090 ± 0.128 |
0.197 |
< 60 |
50 (47.6) |
0.043 ± 0.006 |
|
Tumor status |
105 (100) |
|
|
Primary |
86 (81.9) |
0.030 ± 0.077 |
0.391 |
Recurrent |
19 (18.1) |
0.015 ± 0.015 |
|
Sex |
105 (100) |
|
|
Men |
67 (63.8) |
0.034 ± 0.086 |
0.079 |
Women |
38 (36.2) |
0.015 ± 0.018 |
|
Smoking history |
105 (100) |
|
|
Smoker |
38 (36.2) |
0.026 ± 0.060 |
0.876 |
Nonsmoker |
67 (63.8) |
0.028 ± 0.075 |
|
Alcohol history |
105 (100) |
|
|
Drinker |
29 (27.6) |
0.036 ± 0.101 |
0.436 |
Nondrinker |
76 (72.4) |
0.024 ± 0.054 |
|
Tumor size |
105 (100) |
|
|
≥ 2 cm |
91 (86.7) |
0.066 ± 0.007 |
0.277 |
< 2 cm |
10 (9.5) |
0.052 ± 0.106 |
|
Unknown |
4 (3.8) |
|
|
Tumor grade |
105 (100) |
|
|
I–II |
85 (81.0) |
0.031 ± 0.077 |
0.020 |
III |
16 (15.2) |
0.010 ± 0.012 |
|
Unknown |
4 (3.8) |
|
|
TNM stage |
105 (100) |
|
|
I–II |
31 (29.5) |
0.054 ± 0.121 |
0.105 |
III–IV |
69 (65.7) |
0.017 ± 0.023 |
|
Unknown |
5 (4.8) |
|
|
Disease site |
105 (100) |
|
|
Oral cavity |
90 (85.7) |
0.075 ± 0.008 |
0.607 |
Oropharynx |
15 (14.3) |
0.019 ± 0.015 |
|
Lymph node metastasis |
105 (100) |
|
|
pN positive |
52 (49.5) |
0.018 ± 0.025 |
0.169 |
pN negative |
51 (48.6) |
0.037 ± 0.096 |
|
Unknown |
2 (1.9) |
|
|
Adjuvant treatment |
105 (100) |
|
|
Yes |
10 (9.5) |
0.014 ± 0.011 |
0.546 |
No |
95 (90.5) |
0.029 ± 0.073 |
|
Abbreviations: SD, standard deviation; FHL1, four and a half LIM domains 1; TNM stage, tumor lymph node metastasis stage; pN, pathologic lymph node status.
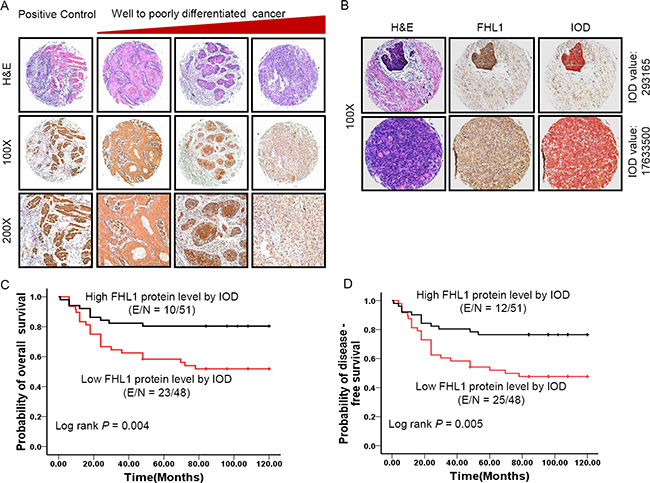
Figure 2: Patterns of FHL1 gene expression were investigated in 101 specimens of head and neck squamous cell carcinoma (HNSCC). (A) Representative images show immunohistochemical staining (IHC) for FHL1 expression in positive control (muscle), well differentiated HNSCC, moderately differentiated HNSCC, and poorly differentiated HNSCC from the left side to the right side. From the first line to the end line indicates H & E staining, ×100 original magnification and ×200 original magnification, respectively. (B) Representative images showed FHL1 expression was quantified by using digital image analysis (IOD value). (C) Kaplan-Meier survival curve indicated overall survival by evaluation of FHL1 protein levels in the validation cohort through human semiquantitative analysis. (D) Kaplan-Meier survival curve indicated disease-free survival by evaluation of FHL1 protein levels in the validation cohort through human semiquantitative analysis.
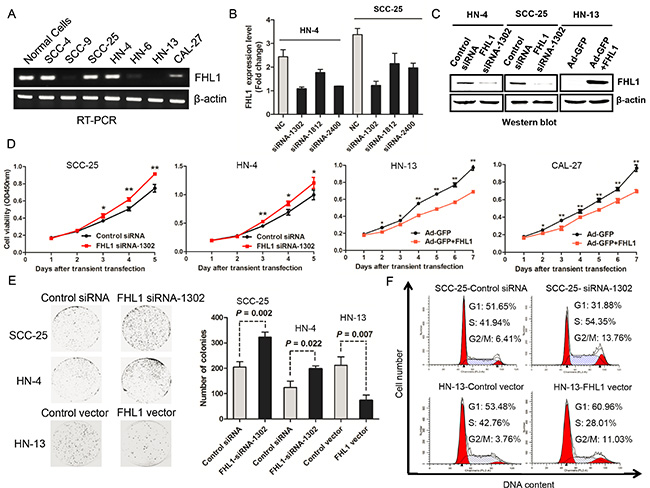
Figure 3: Effects of FHL1 knock down or overexpression on aggressive proliferation of head and neck squamous cell carcinoma (HNSCC) were illustrated. (A) Expression of FHL1 mRNA level was detected in HNSCC cell lines and normal epithelial cells. (B) Silencing effect of FHL1 by three siRNAs was evaluated in HN-4 and SCC-25 cells. (C) Expression of FHL1 was detected after FHL1 knock down by siRNA-1302 or FHL1 overexpression by Ad-GFP+FHL1 in HN-4, SCC-25 and HN-13 through using Western blotting assay. (D) The effect of FHL1 knockdown by siRNA-1302 or FHL1 overexpression by Ad-GFP+FHL1 on the proliferation of SCC-25, HN-4, HN-13 and CAL-27cells analyzed with the CCK-8 cell-counting kit. (E) The effect of FHL1 ablation by siRNA-1302 or FHL1 overexpression by Ad-GFP+FHL1 on the colony formation potential of SCC-25, HN-4 and HN-13 cells. (F) The distribution of cell cycle after infecting by siRNA-1302 or FHL1 overexpression by Ad-GFP+FHL1 was observed in SCC-25 and HN-13 cells through cell cycle analysis.
FHL1 knockdown enhanced cell proliferation, colony formation, and facilitating G1-S transition
In 7 HNSCC cell lines, HN-4 and SCC-25 cells with high endogenous FHL1 expression (Figure 3A) were chosen for loss-of-function assay in vitro. SiRNA-1302, one of three siRNAs against FHL1, performed the best silencing effect both in HN-4 and SCC-25 (Figure 3B) and significantly decreased FHL1 protein level in two cell lines (Figure 3C). As expected, silencing of FHL1 significantly promoted the growth of HN-4 and SCC-25 cells (p < 0.05; Figure 3D). Silencing of FHL1 significantly increased the number of larger colonies (p = 0.002 for SCC-25 and p = 0.022 for HN-4, respectively; Figure 3E) as well as promoted the G1-S transition in SCC-25 cells (Figure 3F). These results suggested that FHL1 knockdown disrupted contact inhibition among these cells and may contribute to both tumor oncogenesis and progression.
FHL1 inhibited tumorigenicity by cell-cycle related proteins dysregulation in vitro
Based on FHL1 expression pattern in HNSCC cells, we transfected an adenoviral vector containing FHL1 (Ad-GFP-FHL1) into HN-13 and CAL-27 cells with low FHL1 expression. FHL1 overexpression suppressed the growth and colony formation of these cells (p < 0.05; Figure 3D and 3E) as well as caused G1-S arrest in HN-13 cells (Figure 3F). To determine whether FHL1 expression induced apoptosis in HNSCC cells, we assessed the fraction with positive staining for 7-amino-actinomycin (7-AAD) and Annexin V-PE in HNSCC cells with FHL1 overexpression and the control cells (47.81% vs 26.28% for HN-13 and 13.91% vs 12.08% for CAL-27; Figure 4A), suggesting that apoptosis-induced inhibitory effect processes a cell-specific manner. Our results also showed that FHL1 overexpression enhanced expression of p27 as well as reduced expression of Cyclin D1 and cyclin E in HN-13 and CAL-27 cells (Figure 4B). Inversely, downregulation of FHL1 decreased expression of p27 as well as promoted expression of Cyclin D1 and Cyclin E in SCC-25 cells (Figure 4C).
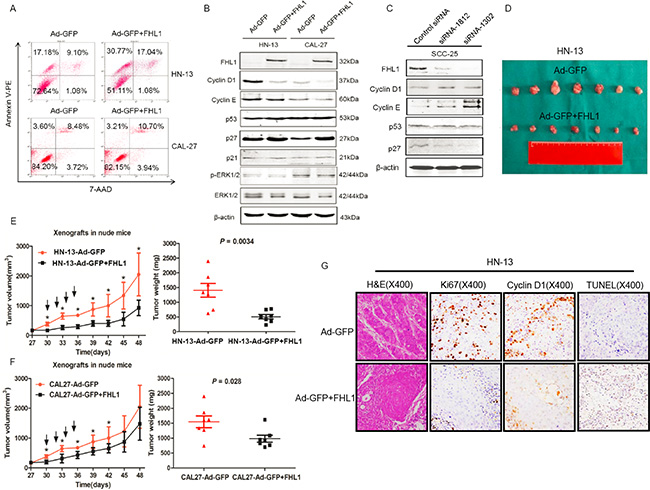
Figure 4: Effects of FHL1 on the apoptosis potential, cell cycle-related proteins and tumorigenicity were evaluated. (A) The apoptosis potential of FHL1 overexpression with Ad-GFP+FHL1 in HN-13 and CAL-27 cells was examined by 7-AAD and Annexin V-PE double staining through flow cytometry. (B) Cell cycle-related proteins were assessed by Western blotting after FHL1 overexpression with Ad-GFP+FHL1 in HN-13 and CAL-27 cells. (C) Cell cycle-related proteins were assessed by Western blotting after FHL1 ablation with siRNA-1812 and siRNA-1302 in SCC-25 cells. (D) Photographs of the tumors that were surgically removed from mice in each group after they were killed at the end of 7 weeks from the HN-13 cells inoculation. (E) The left diagram showed that the time course is from growth of HN-13 xenograft tumors that developed into approximately 100 mm3 in mice to the end of 7 weeks after the cell inoculation. Black arrow indicated intratumoral injection with Ad-GFP+FHL1 or Ad-GFP; the right diagram demonstrated that weight of individual tumors surgically removed from the animals in each group. (F) The time course curve and weight diagram for CAL-27 xenograft tumors. (G) Representative H & E staining and immunohistochemical staining for Ki67, Cyclin D1 as well as TUNEL assay were conducted in HN-13 cell line xenografts each group (original magnification, ×400).
FHL1 overexpression suppressed tumorigenicity in vivo
The adenoviral vectors containing FHL1 were intratumorally injected into xenograft model derived from HN-13 and CAL-27 cells in order to assess whether FHL1 was as a therapeutic target or not. Our findings showed that FHL1 overexpression inhibited tumor growth in both two cell lines (Figure 4D, 4E and 4F). Furthermore, the xenograft tumors with FHL1 overexpression possessed a significantly reduced nuclear Ki67, Cyclin D1 labeling index and enhanced apoptotic potential in HN-13 cell line xenograft (Figure 4G). A notably reduced nuclear Ki-67 and Cyclin D1 labeling index but not enhanced apoptotic potential was found in CAL-27 cell line xenograft with FHL1 overexpression (Supplementary Figure S2). The above findings in vivo were consistent with that in vitro. Interestingly, these tumors also showed a well differentiated histology pattern whereas the control tumors were poorly/moderately differentiated (Figure 4G and Supplementary Figure S2).
Genetic and epigenetic alterations of the FHL1 locus in HNSCCs
To address whether genetic alteration cause loss-of-function of FHL1, we performed the mutational analysis of FHL1 in its all seven exons in HNSCC cell lines. However, none point mutations were found in HNSCC cell lines (date not shown). We also detected DNA methylation status of FHL1 by MSP-PCR, BS and 5-Aza-dC induction, respectively. The distribution and localization of CpG sites in FHL1 promoter were showed in Figure 5A. The result showed that DNA hypermethylation of FHL1 was found in 4 (66.67%) out of 6 HNSCC cell lines and in 60 (57.14%) out of 105 HNSCCs. The methylation level of the CpG Island in the FHL1 promoter was significantly higher in HNSCC cells and HNSCCs than that of NOEC and ANT (Figure 5B and 5C). FHL1 methylation level was inversely correlated with its expression level (Figure 5D). The BS was further validated for the results from MSP-PCR (Figure 5E). FHL1 gene transcription was reactivated in all five HNSCC cell lines after treatment with 5-Aza- dC (DAC) (Figure 5F). All above data suggested that epigenetic events at the FHL1 locus could contribute to downregulation of the gene in some HNSCC samples.
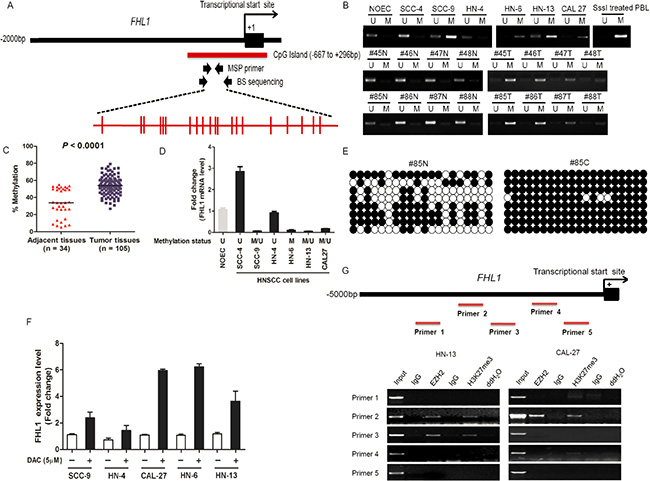
Figure 5: DNA and EZH2-mediated histone hypermethylation together contribute the silencing of FHL1 in HNSCC. (A) Schematic representations of the location of CpG island within the promoter of FHL1 and of the primers designed against the promoter region for Methylation-specific polymerase chain reaction (MSP-PCR) and bisulfite-treated DNA sequencing (BS). Red ticks indicated CpG site in CpG island region. (B) Methylation status of FHL1 was investigated in normal oral epithelial cell (NOEC), HNSCC cell lines and eight representative paired HNSCCs by MSP-PCR. (C) Methylation status of FHL1 was further revealed in paired adjacent tissues (n = 34) and HNSCCs (n = 105) by MSP-PCR. (D) The negative association between FHL1 mRNA expression and FHL1 methylation status was illustrated. (E) Methylation status of FHL1 was determined in a representative paired adjacent tissue and HNSCC sample by BS. (F) Expression restoration of FHL1 was also observed in five HNSCC cells by real-time PCR after the 5-Aza-dC induction. (G) Schematic representations of the location of putative binding region within the promoter of FHL1 and of the five primers designed against the promoter region for Chromatin Immunoprecipitation (ChIP)-PCR, and notably occupancy of EZH2 and H3k27me3 were found in both HN-13 and CAL-27 cells.
In addition to DNA methylation, EZH2 mediated-H3K27Me3 was gradually regarded as one of the main epigenetic event and its functions was independent of promoter DNA methylation [23, 24]. Interestingly, the result demonstrated that FHL1 expression was increased upon EZH2 ablation in HNSCC cells (Supplementary Figure S1). Secondly, we randomly designed five ChIP primers at the upstream of FHL1 transcriptional start site (Figure 5G). Using ChIP-PCR, we demonstrated that EZH2 occupancy coincides with H3K27me3 at FHL1 promoters (Figure 5G).
DISCUSSION
It is well known that genetic and epigenetic mediated the activation of oncogenes and the inactivation of TSGs mainly contributes to cancer initiation and progression [25]. Identification of novel candidate oncogenes and TSGs would serves to well understand hallmarks of cancer and cancer-related network. Chromosome X-linked TSGs are unique because they can be inactivated by a single hit, suggesting they are more easily contributed to carcinogenesis under the same conditions. Here, we conducted a bioinformatics and Venn analysis of integrated four independent data sets for screening novel X-linked TSGs. Total 48 differentiated expression genes were found including FHL1 downregulation (Supplementary Table S1), indicating that FHL1 might be a candidate TSG.
FHL1 protein with an N-terminal half LIM domain, followed by four complete LIM domains, belongs to a family of LIM-only proteins that regulate muscle development, structural maintenance, and signaling [26]. Over 25 different FHL1 mutations have been identified in patients with decreasing body myopathy [27]. In a variety of cardiac disorders, FHL1 expression was also significantly up-regulated whereas its expression is down-regulated in certain cancers, suggesting its various physiological and pathological functions. The downregulation was associated with short survival and deep invasion in gastric cancer [28], and with poor differentiation in lung cancers [29]. In this study, we observed downregulation of FHL1 expression was significantly associated with poorer differentiation (p = 0.020), worse OS (p = 0.018) and DFS (p = 0.038). In Multivariate Cox proportional analyses, FHL1 expression was identified as independent predictors of OS and DFS in patients with HNSCC.
In validation cohort, FHL1 expression was further evaluated by IHC. To reduce the subjective drawback of IHC semiquantitative analysis, imaging equipment and software were used in this study. The results also showed that FHL1 expression were significantly associated with tumor grade (p = 0.025), p16 (p = 0.045), poorer OS (p = 0.004) and DFS (p = 0.005). Multivariate Cox analysis showed that FHL1 expression (p = 0.021; HR 0.404, Cl, 0.187–0.871) together with lymph node metastasis (p = 0.017; HR 2.334, Cl, 1.167–4.671) was verified as independent predictors of OS and DFS in patients with HNSCC.
FHL1 was identified functionally interacted with oestrogen receptors (ERs), Smad2/3/4, HIF-1, human T-cell leukemia virus type 1 Tax oncoprotein and ZO-1 in various cancer types [30–34], suggesting that its functions as either a tumor suppressor or oncoprotein. Downregulation of FHL1 promoted the growth of human lung cancer cells, hepatoma cells, and breast cancer cells and reduced EMT in breast adenocarcinoma cells. In this work, to verify the function of FHL1, we performed a series of gain-of-function and loss-of-function assays. Our data demonstrated that overexpression of FHL1 inhibited the proliferation, colony formation potential, and caused cell-cycle G1 arrest of HN-13 by apoptosis induction whereas ablating FHL1 promoted the proliferation, the colony formation potential and G1-S transition of HN-4 and SCC-25, suggesting FHL1 acts as a tumor suppressor in HNSCCs. Furthermore, our findings revealed that FHL1 modulated the proliferation of HNSCC by dysregulated expression of Cyclin D1, Cyclin E1 and p27. Additionally, overexpression of FHL1 dramatically inhibited the volume and the weight of tumors from HN-13 and CAL- 27 xenograft models by inducing cell differentiation, decreasing expression of Ki67, Cyclin D1 and promoting apoptosis of HN-13 xenograft tumor cells.
Both genetic and epigenetic events contribute to loss-of-function of TSG in cancer development. To reveal the possibility mechanism about FHL1 inactivation, we performed mutational analysis and promoter CpG DNA/histone methylation analysis. Although FHL1 mutations were frequently identified in some muscle disorder diseases [27, 35], none point mutations were observed in HNSCC cell lines. DNA hypermethylation of FHL1 have been detected in certain cancer types [36, 37], no further findings have been reported yet in HNSCCs. To evaluate DNA methylation status of FHL1 in HNSCCs, we first used bioinformatics tools to determine a novel CpG island localized in −667 bp to + 296 bp of FHL1 (relative to transcriptional start site as +1). Subsequently, MSP-PCR, BS and 5-Aza-dC induction were employed to measure of promoter methylation status of FHL1 in HNSCCs. Our data indicated that aberrant DNA hypermethylation contributed to the downregulation of FHL1 in HNSCCs. Previous study showed that Src utilizes Cas to suppress the expression of the LIM-only protein FHL1 by inducing the methylation of FHL1 promoter region [38]. Thus, hypermethylation of the promoter region of the FHL1 by Src induction warrants further investigation in HNSCCs. In addition to DNA methylation, EZH2-mediated H3K27Me3 also played an important role in silencing of gene and it has been reported that EZH2 was involved in oral cancer development [18, 20]. Interestingly, by using RNA interference, real time-PCR and ChIP-PCR assays, our data demonstrated that FHL1 was a novel target of EZH2 in HNSCCs.
It is particularly interesting to note that HPV infection has been strongly implicated in oropharyngeal carcinogenesis. However, the incidence of HPV infection was diverse from 15% to 67% in HNSCCs according to different regions and HPV types [39]. In this study, none HPV positive was observed in our Chinese HNSCC patients caused by regional difference and sample size limitation. Therefore, additional studies are necessary to validate these findings by using samples from populations with HPV-positive.
Summarily, in this study, we identified FHL1 as a novel epigenetic silencing target, discovered its function as a tumor suppressor and a novel therapeutic target in HNSCCs. FHL1 expression is an independent predictor for prognosis of patients with HNSCCs.
MATERIALS AND METHODS
Venn analysis of published microarray datasets
We augmented the analysis of the data with a Venn analysis of four published microarray data from NCBI GEO datasets (GSE2379, GSE6631, GSE3524 and GSE13601) [10–14] to reliably identify a panel of genes notably downregulated in head and neck squamous cell carcinomas (HNSCCs) compared to adjacent normal tissues (ANT). Software RankProd was applied to analyze for the public microarray datasets, which detected differentially expressed gene under two experimental conditions [15], avoiding complicated experimental variables and ‘lab-effects’ which would occur from direct comparison among heterogeneous datasets, even after the normalization process [16, 17]. Four data sets were crossed by Venn analysis. In current study, genes were selected with evidence of differentially expressed genes in HNSCCs with a False Discovery Rate (FDR) < 0.5 and Fold-change (normal/tumor) ≥ 2 fold (Supplementary Table S1).
HNSCC specimens
Under the study reviewed and approved by the institutional Ethical Committee of Shanghai Ninth People’s Hospital affiliated to Shanghai Jiao Tong University, all subjects signed informed consent documents for participation in this study. Two independent cohorts were incorporated into this study including a training cohort and a validation cohort. The training cohort of 105 consecutive patients who were histologically diagnosed with HNSCCs at the Department of Oral Maxillofacial-Head and Neck Oncology, Shanghai Ninth People’s Hospital between November 2008 and June 2011 were collected. All samples were obtained by surgery and cut half to half following by quickly frozen in liquid nitrogen and pathologic diagnosis. The patients with primary or recurrent HNSCCs included 67 men (63.8%) and 38 women (36.2%) with a median follow-up of 41 months (interquartile range, 31 to 46 months) (Table 1). Samples from the validation cohort of 101 consecutive patients were assembled from the database based on histologic diagnosis of primary HNSCCs who received radical surgery in the Department of Oral Maxillofacial-Head and Neck Oncology, Shanghai Ninth People’s Hospital from August 1989 to March 1993. There were 53 males (52.5%) and 48 females (47.5%) with a median age of 54 years, and their clinicopathological parameters were summarized in Supplementary Table S2. The median follow-up of the patients was 84 months. In this study, tumor from each patient was stained with hematoxylin and eosin (H & E) and staged according to the International Union Against Cancer tumor-lymph node-metastasis (TNM) classification system.
Cell lines
CAL-27, SCC-4, SCC-9 and SCC-25 cell lines were purchased from the ATCC and maintained according to the ATCC recommendations. WSU-HN-4, HN-6, HN-13 cell lines and normal epithelial cells (NECs) were acquired and cultured as well as genetic identified as described in the previous study [18, 19].
Extraction of DNA and RNA
Genomic DNA was extracted from HNSCC cell lines and human HNSCC samples using the DNeasy Tissue kit (Qiagen) according to the manufacturer’s protocols. RNA was extracted using TRIZOL solution (Invitrogen) according to the protocols recommended by the manufacturer. The total DNA and RNA concentration and quantity were assessed by absorbance at 260 nm, using a NanoDrop 2000 analyzer (ThermoFisher Scientific)
RT-PCR
Using a reverse transcription kit (Promega, Madison, USA), 2 μg of total RNA was reverse-transcribed directly to cDNA following the manufacturer’s instructions in a total volume of 25 μl. The primer sequences used were as follows: FHL1 forward, 5′- GAC TGG AAG CTT CTT CCC TAA AG-3′; FHL1 reverse, 5′- CCA GCT TCT TAG AGC AGG TAA CA-3′; β-actin forward, 5′-TCA CCC ACA CTG TGC CCA TCT ACG A-3′; and β-actin reverse, 5′-GGG ATG ACT TGT GTT GGA AAA T-3′. Each primer was added at a final concentration of 0.5 μM to a 15 μl reaction mixture in PCR buffer containing 1 μl of cDNA, 0.25 mM of each dNTP, 1.5 mM of MgCl2, and 2.5 units of Taq DNA polymerase. An initial denaturation was performed for 5 minutes at 94°C, and 35 cycles were performed with the following PCR program: denaturing at 94°C for 30 seconds, annealing at 55°C for 30 seconds for FHL1 and 55°C for 30 seconds for β-actin, and elongation at 72°C for 30 seconds. The program was completed with a final extension at 72°C for 5 minutes. Ethidium bromide-stained bands were visualized using UV transillumination, and fluorescence intensity was quantified using the FR- 200 system (FuRi, Shanghai, China). The data from semi-quantitative PCR reactions were normalized against the expression of β-actin from three independent experiments ± the standard deviation (SD). All RT-PCR data were from at least three independent experiments.
Quantitative real-time PCR assay
All qRT-PCR reactions were performed using an ABI 7300 real-time PCR system (Applied Biosystems corp., Carlsbad, CA) and the SYBR Premix Ex Taq™ reagent kit (Takara, Japan). The real-time PCR was performed in a final volume of 15 μl with 1.5 μl of template cDNA at a concentration of 20 ng/μl with 7.5 μl SYBR green I fluorescent dye and 10 pM of each primer for the target gene and β-actin. The primer sequences were sense 5′-TTG TTG GCG GAA GCG TGT AAA ATC-3′ and anti-sense 5′-TCC CTA GTC CCG CGC AAT GAG C-3′ for EZH2, sense 5′- GAC TGG AAG CTT CTT CCC TAA AG-3′ and anti-sense 5′- CCA GCT TCT TAG AGC AGG TAA CA-3′ for FHL1, sense 5′-CCG CCG CGA GTG AGG GTT TT-3′ and anti-sense 5′-CGC TGC CCA TCA TCA TGA CCT GG-3′ for CDKN2A and sense 5′-CCT GGC ACC CAG CAC AAT-3′ and antisense 5′-GGG CCG GAC TCG TCA TAC T-3′ for β-actin. The results of real-time PCR were represented as Ct values, where Ct was a fraction defined as the cycle number at which the sample’s fluorescent signal passes a given threshold above the baseline. ΔCt was the difference in the Ct values derived from the specific genes compared to β-actin. Relative mRNA expression level of target gene normalized to β-actin was represented as 2-ΔCt value in our samples. The significance level was defined as a p value < 0.05.
Western blot analysis
As previously described [20], cells were harvested in RIPA buffer (Sigma Aldrich). Whole cell lysate was separated using SDS-PAGE. Primary antibodies against FHL1 (Santa Cruz Biotechnology, sc-374246, 1:1000 diluted), Cyclin D1, Cyclin E, p53, p27, p21, phosph-ERK1/2, and ERK1/2 (Cell signaling Technology) were used in this study. β-actin antibody was used to normalize protein loading.
Immunohistochemistry
Formalin-fixed, paraffin-embedded tissue samples were cut into 4-μm tissue sections. The avidin-biotin complex (ABC) technique was performed following the manufacturer’s instructions for the Vectastatin Elite ABC kit (Vector Laboratories, Burlingame, CA). Briefly, tissue sections were deparaffinized in xylene, rehydrated in graded ethanol, treated with citrate buffer for heat-induced antigen retrieval, and quenched in hydrogen peroxide. Tissue sections were blocked with 2.5% normal serum, incubated overnight at 4°C with anti-FHL1 monoclonal antibody, (Santa Cruz Biotechnology, Dallas, TX, 1:100 diluted) and anti- p16/INK4a monoclonal antibody (1:250), (Clone EPR1473, Epitomics Inc., Burlingame, CA) followed by incubation with biotinylated secondary antibody and then ABC reagent. Diaminobenzidine was used as chromogen, and sections were counterstained with Mayer’s hematoxylin (Sigma-Aldrich corp., St Louis, Mo). FHL1 and p16 expression were quantified by computer-based integrated optical density (IOD). For computer-based integrated optical density, Image Pro-Plus (IPP) software was performed in this study and the results were compared with visual assessment. Of the 101 patients with primary HNSCCs, two cases were excluded by the pathologists due to an insufficient number of tumor cells in the sections for evaluation. For FHL1 staining, the cutoff value was 7226982 (IOD). Thus a value greater than or equal to 7226982 (IOD) was considered high expression, whereas a value less than 7226982 (IOD) was considered low expression. For p16 staining, the cutoff value was 5326482 (IOD), thus a value greater than or equal to 5326482 (IOD) was considered high expression, whereas a value less than 5326482 (IOD) was considered low expression.
FHL1 adenoviral vector construction
Full-length FHL1 ORF (nt261-1103; GeneBank accession number NM_001159700.1) cloned to pEGFP-N1 plasmid were purchased from Genechem Corporation (Shanghai, China). To construct FHL1 recombinant adenovirus vector, full-length FHL1 ORF was inserted into the multiple cloning site of pShuttle-IRES-hrGFP-1 (Stratagene), a shuttle vector that contained a CMV promoter with a GFP. Then, pShuttle-IRES-hrGFP-1-FHL1 and pAdEasy-1(Stratagene) were homologously recombined in E.coli BJ5183. The novel recombined plasmid, Ad-GFP + FHL1 was verified by restriction endonuclease digestions and sequencing. Ad-GFP + FHL1 was propagated in HEK293 cells and a viral stock was harvested from those cells. After 6 cycles of freezing and thawing, cell debris was removed by subjecting the lysed cells to 12,000 g centrifugation. The virus stock was stored at −80°C.
Small interfering RNA
Three siRNAs against FHL1 were designed by BLOCK-iT TM RNAi Designer online software (http://rnaidesigner.invitrogen.com/rnaiexpress/) and chemically synthesized (Shanghai Genepharma Co.) for targeting different coding regions of the gene as follows: siRNA-1302 (5′-CCCUGCAGCAAAGUGAAUUdUdC-3′ and 5′-AAU UCACUUUGCUGCAGGGdUdU-3′) for nt 1302-1324 of FHL1, siRNA-1812 (5′-GCCUGUUUCAGAGGAACAUd CdG-3′ and 5′-AUGUUCCUCUGAAACAGGCdUdC-3′) for nt 1812-1834 of FHL1. Additionally, specific anti-EZH2 siRNA were purchased from Ambion Inc. (Austin, Tex) and control siRNA (5′-UUCUCCGAACGUGUCACGU dTdT-3′ and 5′-ACGUGACACGUUCGGAGAAdTdT-3′) was also synthesized.
Cell proliferation assay
A cell-proliferation assay was performed to analyze the proliferation potential of transiently transfected FHL1 siRNA compared with negative control siRNA in SCC-25 and HN-4 cells as well as proliferation potential of transiently transfected FHL1 expression vector compared with empty vector in HN-13. Briefly, In vitro transient transfection was performed using Lipofectamine 2000 (Invitrogen, Carlsbad, Calif) following the manufacturer’s protocol. The cells were harvested and plated in 96-well plates at 1 × 10³ cells per well and maintained at 37°C in a humidified incubator. At the indicated time points, 10 μL of the CCK-8 solution were added into the triplicate wells and incubated for 1 hour, and the absorbance at 450 nm was measured to calculate the number of vital cells in each well. Measurements were performed in triplicate, and the mean (± standard deviation) optical density was reported.
Colony formation
To assay the effect of FHL1 on colony formation, recombinant pEGFP-N1 vectors containing the FHL1 or siRNA against FHL1were transfected into targeted HNSCC cells (empty vector or control siRNA as a control) in 35-mm dishes by Lipofectamine2000 (Invitrogen) for 24 hours, and then stripped and plated onto 100-mm tissue culture dishes. After 2 weeks of selection, the remaining colonies were washed twice with PBS, stained with crystal violet, and counted on crystal violet–stained dishes. All experiments were independently repeated at least 3 times.
Cell cycle analysis
Targeted HNSCC cells transfected with recombinant pEGFP-N1 vectors containing the FHL1 or siRNA against FHL1 (empty vector or control siRNA as a control) were harvested, fixed in 70% ethanol, and suspended in PI/RNase staining buffer (BD Pharmingen) containing 0.1% sodium citrate and 0.1% Triton X-100. Data analysis was done using FlowJo software.
Apoptosis assay
The cells infected with the Ad-GFP or Ad- GFP+FHL1 virus were harvested at 72 hours. These cells were then quantified by flow cytometry using the Annexin V-PE Apoptosis Detection Kit (BD Biosciences, USA) according to the manufacturer’s protocols. Briefly, trypsinized adherent cells and floating cells were harvested, washed twice with cold PBS and resuspended in 1 × Binding Buffer at a concentration of 1 × 10⁶ cells/ml. Then, 5 μl of Annexin V-PE and 5 μl of 7-AAD were added, and the cells were incubated for 15 minutes at 25°C in the dark. The cells were then resuspended in 400 μl of 1× Binding Buffer and analyzed immediately by BD LSR II flow cytometry (BD Biosciences, USA).
Tumor formation in nude mice
A total of 2 × 10⁶ HN-13 or CAL-27 cells were injected subcutaneously into the right flank or both flanks of nude mice. Treatment was initiated when tumors reached approximately 100 mm3. Ad-GFP+FHL1 and Ad-GFP regents were injected into tumors by intratumoral injection way every other day, respectively. A total of injections four times were performed in this process. Growth curves were plotted based on mean tumor volume within each experimental group at the indicated time points. The tumor dimensions and nude mice weights were measured every 3 days using a digital caliper, and the tumor volume calculated using the following formula: V = π/6 × (larger diameter) × (smaller diameter)2. Tumor growth was observed for at least at 3 weeks after the initial treatment. The tumorigenic experiments in vivo were performed with 7 mice in each treatment group.
Mutational analysis of FHL1 in HNSCC cell lines
All seven exons of FHL1 were amplified in WSU-HN-4, HN-6, HN-13, CAL-27, SCC-4, SCC-9, SCC-25 and NECs using 100 ng of genomic DNA by PCR as indicated in previous study [21]. The PCR products were directly cycle-sequenced with an ABI PRISM 377 automated DNA sequencer.
MSP-PCR and bisulfite-treated DNA sequencing
As formerly described [22], genomic DNA (1 μg) was denatured by incubation with 0.2 M NaOH. Aliquots of 10 mM hydroquinone and 3 M sodium bisulfite (pH 5.0) were added and the solution was incubated at 50°C for 16 hours. Methylation-specific polymerase chain reaction (MSP-PCR) and bisulfite-treated DNA sequencing (BS) were performed and specific primers for MSP or BS were summarized in Supplementary Table S4. The PCR product was subcloned into a pMD 18-T vector (TaKaRa Inc.) for DNA sequencing on an ABI 3730 sequencer.
Induction of gene expression by 5-Aza-dC
To induce demethylation of promoter prior to evaluation for induction of FHL1 expression, five HNSCC cell lines were treated with 5 μM 5-Aza-dC (DAC), which was the DNA demethylation reagent for 72 hours.
ChIP assay
HN-13 and CAL-27 cells with low endogenous FHL1 were selected for ChIP-PCR analysis. For each ChIP assay, antibodies (2 μg) used for ChIP included monoclonal anti-EZH2 (Millipore), polyclonal anti-H3K27Me3 (Upstate) antibody or IgG control (Millipore). The primer sets are listed in the Supplementary Table S4. ChIP enriched DNA and input DNA were subjected to PCR analysis.
Statistical analysis
For IHC analysis, the associations between FHL1 expression level by IOD and patient characteristics were evaluated using Fisher Exact test for categorical variables and Kruskal-Wallis test for continuous variables. For real-time PCR analysis, the associations between FHL1 mRNA level and patient characteristics were evaluated using the Kruskal-Wallis test. The log-rank test was used for univariate associations between FHL1 expression level and OS and DFS. Then, all potential prognostic factors with a p value < 0.05 from the univariate analysis were incorporated in multivariate analyses. The hazard ratios [HR] with corresponding 95% confidence intervals [CI] and P values were reported. Paired t test was used for analysis of the in vitro and in vivo studies. All the analyses were conducted using the SPSS software program (SPSS Standard version 13.0). All tests were two-sided, and p values < 0.05 were considered statistically significant.
ACKNOWLEDGMENTS AND FUNDING
This study was supported by grants from the National Natural Science Foundation of China (81202130, 31271341, 81472515 and 91229103) and by projects of the Shanghai Science and Technology Committee (15DZ2292300 and 15411950300).
Authors’ contributions
WTC, TJ and WC: participated in study design and coordination, analysis and interpretation of data, material support for obtained funding, and supervised study. WC, RX, MX and LL: performed most of the experiments and statistical analysis and drafted the manuscript. JL, XW and CPZ: carry out the experiment and sample collection. All authors read and approved the final manuscript.
CONFLICTS OF INTEREST
None of the authors has a conflicts of interest with this work.
REFERENCES
1. Jemal A, Bray F, Center MM, Ferlay J, Ward E, Forman D. Global cancer statistics. CA Cancer J Clin. 2011; 61:69–90.
2. Stransky N, Egloff AM, Tward AD, Kostic AD, Cibulskis K, Sivachenko A, Kryukov GV, Lawrence MS, Sougnez C, McKenna A, Shefler E, Ramos AH, Stojanov P, et al. The mutational landscape of head and neck squamous cell carcinoma. Science. 2011; 333:1157–1160.
3. Kalish LH, Kwong RA, Cole IE, Gallagher RM, Sutherland RL, Musgrove EA. Deregulated cyclin D1 expression is associated with decreased efficacy of the selective epidermal growth factor receptor tyrosine kinase inhibitor gefitinib in head and neck squamous cell carcinoma cell lines. Clin Cancer Res. 2004; 10:7764–7774.
4. Pectasides E, Rampias T, Kountourakis P, Sasaki C, Kowalski D, Fountzilas G, Zaramboukas T, Rimm D, Burtness B, Psyrri A. Comparative prognostic value of epidermal growth factor quantitative protein expression compared with FISH for head and neck squamous cell carcinoma. Clin Cancer Res. 2011; 17:2947–2954.
5. Spatz A, Borg C, Feunteun J. X-chromosome genetics and human cancer. Nat Rev Cancer. 2004; 4:617–629.
6. Li W, Wang L, Katoh H, Liu R, Zheng P, Liu Y. Identification of a tumor suppressor relay between the FOXP3 and the Hippo pathways in breast and prostate cancers. Cancer Res. 2011; 71:2162–2171.
7. Major MB, Camp ND, Berndt JD, Yi X, Goldenberg SJ, Hubbert C, Biechele TL, Gingras AC, Zheng N, Maccoss MJ, Angers S, Moon RT. Wilms tumor suppressor WTX negatively regulates WNT/beta-catenin signaling. Science. 2007; 316:1043–1046.
8. Pérez-Mancera PA, Rust AG, van der Weyden L, Kristiansen G, Li A, Sarver AL, Silverstein KA, Grützmann R, Aust D, Rümmele P, Knösel T, Herd C, Stemple DL, et al. The deubiquitinase USP9X suppresses pancreatic ductal adenocarcinoma. Nature. 2012; 486:266–270.
9. Dewdney SB, Rimel BJ, Thaker PH, Thompson DM Jr, Schmidt A, Huettner P, Mutch DG, Gao F, Goodfellow PJ. Aberrant methylation of the X-linked ribosomal S6 kinase RPS6KA6 (RSK4) in endometrial cancers. Clin Cancer Res. 2011; 17:2120–2129.
10. Cromer A, Carles A, Millon R, Ganguli G, Chalmel F, Lemaire F, Young J, Dembélé D, Thibault C, Muller D, Poch O, Abecassis J, Wasylyk B. Identification of genes associated with tumorigenesis and metastatic potential of hypopharyngeal cancer by microarray analysis. Oncogene. 2004; 23:2484–2498.
11. Kuriakose MA, Chen WT, He ZM, Sikora AG, Zhang P, Zhang ZY, Qiu WL, Hsu DF, McMunn-Coffran C, Brown SM, Elango EM, Delacure MD, Chen FA. Selection and validation of differentially expressed genes in head and neck cancer. Cell Mol Life Sci. 2004; 61:1372–1383.
12. Pyeon D, Newton MA, Lambert PF, den Boon JA, Sengupta S, Marsit CJ, Woodworth CD, Connor JP, Haugen TH, Smith EM, Kelsey KT, Turek LP, Ahlquist P. Fundamental differences in cell cycle deregulation in human papillomavirus-positive and human papillomavirus-negative head/neck and cervical cancers. Cancer Res. 2007; 67:4605–4619.
13. Ye H, Yu T, Temam S, Ziober BL, Wang J, Schwartz JL, Mao L, Wong DT, Zhou X. Transcriptomic dissection of tongue squamous cell carcinoma. BMC Genomics. 2008; 9:69.
14. Estilo CL, O-charoenrat P, Talbot S, Socci ND, Carlson DL, Ghossein R, Williams T, Yonekawa Y, Ramanathan Y, Boyle JO, Kraus DH, Patel S, Shaha AR, et al. Oral tongue cancer gene expression profiling: Identification of novel potential prognosticators by oligonucleotide microarray analysis. BMC Cancer. 2009; 9:11.
15. Hong F, Breitling R, McEntee CW, Wittner BS, Nemhauser JL, Chory J. a bioconductor package for detecting differentially expressed genes in meta-analysis. Bioinformatics. 2006; 22:2825–2827.
16. Choi JK, Yu U, Kim S, Yoo OJ. Combining multiple microarray studies and modeling interstudy variation. Bioinformatics. 2003; 19:i84-i90.
17. Irizarry RA, Warren D, Spencer F, Kim IF, Biswal S, Frank BC, Gabrielson E, Garcia JG, Geoghegan J, Germino G, Griffin C, Hilmer SC, Hoffman E, et al. Multiple-laboratory comparison of microarray platforms. Nat Methods. 2005; 2:345–350.
18. Cao W, Feng Z, Cui Z, Zhang C, Sun Z, Mao L, Chen W. Up-regulation of enhancer of zeste homolog 2 is associated positively with cyclin D1 overexpression and poor clinical outcome in head and neck squamous cell carcinoma. Cancer. 2012; 118:2858–2871.
19. Cui Z, Cao W, Li J, Song X, Mao L, Chen W. TRIM24 Overexpression Is Common in Locally Advanced Head and Neck Squamous Cell Carcinoma and Correlates with Aggressive Malignant Phenotypes. PLoS One. 2013; 8:e63887.
20. Cao W, Younis RH, Li J, Chen H, Xia R, Mao L, Chen W, Ren H. EZH2 promotes malignant phenotypes and is a predictor of oral cancer development in patients with oral leukoplakia. Cancer Prev Res (Phila). 2011; 4:1816–1824.
21. Asada K, Ando T, Niwa T, Nanjo S, Watanabe N, Okochi-Takada E, Yoshida T, Miyamoto K, Enomoto S, Ichinose M, Tsukamoto T, Ito S, Tatematsu M, et al. FHL1 on chromosome X is a single-hit gastrointestinal tumor-suppressor gene and contributes to the formation of an epigenetic field defect. Oncogene. 2013; 32:2140–2149.
22. Cao W, Zhang ZY, Xu Q, Sun Q, Yan M, Zhang J, Zhang P, Han ZG, Chen WT. Epigenetic silencing of MAL, a putative tumor suppressor gene, can contribute to human epithelium cell carcinoma. Mol Cancer. 2010; 9:296.
23. Cao R, Wang L, Wang H, Xia L, Erdjument-Bromage H, Tempst P, Jones RS, Zhang Y. Role of histone H3 lysine 27 methylation in Polycomb-group silencing. Science. 2002; 298:1039–1043.
24. Kondo Y, Shen L, Cheng AS, Ahmed S, Boumber Y, Charo C, Yamochi T, Urano T, Furukawa K, Kwabi-Addo B, Gold DL, Sekido Y, Huang TH, Issa JP. Gene silencing in cancer by histone H3 lysine 27 trimethylation independent of promoter DNA methylation. Nat Genet. 2008; 40:741–750.
25. Chin L, Gray JW. Translating insights from the cancer genome into clinical practice. Nature. 2008; 452:553–563.
26. Shathasivam T, Kislinger T, Gramolini AO. Genes, proteins and complexes: the multifaceted nature of FHL family proteins in diverse tissues. J Cell Mol Med. 2010; 14:2702–2720.
27. Cowling BS, Cottle DL, Wilding BR, D'Arcy CE, Mitchell CA, McGrath MJ. Four and a half LIM protein 1 gene mutations cause four distinct human myopathies: a comprehensive review of the clinical, histological and pathological features. Neuromuscul Disord. 2011; 21:237–251.
28. Sakashita K, Mimori K, Tanaka F, Kamohara Y, Inoue H, Sawada T, Hirakawa K, Mori M. Clinical significance of loss of Fhl1 expression in human gastric cancer. Ann Surg Oncol. 2008; 15:2293–2300.
29. Niu C, Liang C, Guo J, Cheng L, Zhang H, Qin X, Zhang Q, Ding L, Yuan B, Xu X, Li J, Lin J, Ye Q. Downregulation and growth inhibitory role of FHL1 in lung cancer. Int J Cancer. 2012; 130:2549–2556.
30. Ding L, Niu C, Zheng Y, Xiong Z, Liu Y, Lin J, Sun H, Huang K, Yang W, Li X, Ye Q. FHL1 interacts with oestrogen receptors and regulates breast cancer cell growth. J Cell Mol Med. 2011; 15:72–85.
31. Ding L, Wang Z, Yan J, Yang X, Liu A, Qiu W, Zhu J, Han J, Zhang H, Lin J, Cheng L, Qin X, Niu C, et al. Human four-and-a-half LIM family members suppress tumor cell growth through a TGF-beta-like signaling pathway. J Clin Invest. 2009; 119:349–361.
32. Hubbi ME, Gilkes DM, Baek JH, Semenza GL. Four-and-a-half LIM domain proteins inhibit transactivation by hypoxia-inducible factor 1. J Biol Chem. 2012; 287:6139–6149.
33. McCabe Á, Hashimoto K, Hall WW, Sheehy N. The four and a half LIM family members are novel interactants of the human T-cell leukemia virus type 1 Tax oncoprotein. J Virol. 2013; 87:7435–7444.
34. Zhao JL, Liang SQ, Fu W, Zhu BK, Li SZ, Han H, Qin HY. The LIM domain protein FHL1C interacts with tight junction protein ZO-1 contributing to the epithelial-mesenchymal transition (EMT) of a breast adenocarcinoma cell line. Gene. 2014; 542:182–189.
35. Domenighetti AA, Chu PH, Wu T, Sheikh F, Gokhin DS, Guo LT, Cui Z, Peter AK, Christodoulou DC, Parfenov MG, Gorham JM, Li DY, Banerjee I, et al. Loss of FHL1 induces an age-dependent skeletal muscle myopathy associated with myofibrillar and intermyofibrillar disorganization in mice. Hum Mol Genet. 2014; 23:209–225.
36. Matsumoto M, Kawakami K, Enokida H, Toki K, Matsuda R, Chiyomaru T, Nishiyama K, Kawahara K, Seki N, Nakagawa M. CpG hypermethylation of human four-and-a-half LIM domains 1 contributes to migration and invasion activity of human bladder cancer. Int J Mol Med. 2010; 26:241–247.
37. Koike K, Kasamatsu A, Iyoda M, Saito Y, Kouzu Y, Koike H, Sakamoto Y, Ogawara K, Tanzawa H, Uzawa K. High prevalence of epigenetic inactivation of the human four and a half LIM domains 1 gene in human oral cancer. Int J Oncol. 2013; 42:141–150.
38. Li X, Jia Z, Shen Y, Ichikawa H, Jarvik J, Nagele RG, Goldberg GS. Coordinate suppression of Sdpr and Fhl1 expression in tumors of the breast, kidney, and prostate. Cancer Sci. 2008; 99:1326–1333.
39. Ramshankar V, Krishnamurthy A. Human papilloma virus in head and neck cancers-role and relevance in clinical management. Indian J Surg Oncol. 2013; 4:59–66.