
INTRODUCTION
Over the last decade there have been important advances in understanding the biology of non-small cell lung cancer (NSCLC), identifying oncogene-driven subtypes of tumors such as epidermal growth factor receptor (EGFR) mutations or anaplastic lymphoma kinase (ALK) and ROS proto-oncogene 1 (ROS1) rearrangements [1-3]. Targeted therapies based on molecular diagnostics have opened a new era of personalized medicine in NSCLC treatment, and during the last years new predictive biomarkers have emerged [4, 5].
ROS1 gene (located at chromosome 6q22) encodes for a receptor tyrosine kinase which belongs to the insulin receptor family [6]. In a similar way to ALK aberrant kinase activity, rearrangements involving the ROS1 gene lead to a constitutively activated downstream signaling of several oncogenic pathways [7, 8]. ROS1 rearrangements are rare events accounting for up to 0.6-1.8% of patients with NSCLC [9, 10]. Until now, several fusion partners (n=12) have been described, being CD74, EZR, SLC34A2 and SDC3 the most prevalent [11, 12]. ROS1 rearrangements are more commonly found in never or mild smokers patients with adenocarcinoma (ADC) histology and in triple negative (EGFR/KRAS/ALK) population, similar to patients with ALK-rearranged NSCLC [13, 14].
Crizotinib (Xalkori®, Pfizer), approved by the US Food and Drug Administration (FDA) in treating ALK positive NSCLC, binds also with high affinity to ROS1-rearrangedreceptors [15]. In addition to previous case reports [2, 13], a recent study described marked antitumor responses to Crizotinib in patients harboring ROS1-rearranged NSCLC [11].
Adequate molecular-based selection is essential for NSCLC patients to achieve optimal results from targeted therapies. Fluorescence in-situ hybridization (FISH) with break-apart probes remains the gold standard method for detecting both ALK and ROS1 rearrangements in lung clinical trials [11, 16]. However, other methods such as immunohistochemistry (IHC) using anti-ROS1 antibodies could provide a widely available alternative screening method. Despite previous manuscripts described a reasonable correlation between FISH and IHC, more information about IHC sensitivity and specificity is needed [17, 18].
In this study, we analyzed a Spanish cohort of NSCLC to determine the prevalence and specific features of ROS1 rearranged patients and to explore the correlation between FISH and IHC assays. We also investigated ROS1 copy number alterations (CNAs) to clarify the correlation between ROS1 gene alteration and clinicopathological parameters.
RESULTS
Clinicopathological characteristics
The median age was 64 years, 69% were males and 71% were ever smokers with a median cumulative index of 52 packs per year (Table 1). Fifty-two per cent of the study population presented stage IV disease and 83% were ADC. The predominant histological patterns in ADC were acinar and solid (some of them mucinous type), whereas lepidic and micropapillary patterns were less common. Other histological subtypes were: squamous cell carcinoma (SCC), 3%; large cell carcinoma (LCC), 2%; and non-small cell lung carcinoma not otherwise specified (NSCLC NOS), 12% of patients. Patients with SCC were added in the analysis due to their clinical characteristics (non-smoking patients). KRAS and EGFR mutations were found in 17% and 6% of the samples respectively, whereas 1% (4 cases) presented ALK rearrangements.
Table 1: Clinicopathological features of the 314 ROS1-screened NSCLC patients
Feature |
Global population |
ROS1 positive (n = 5) |
p-value |
n (%) |
|||
Median Age: y (range) (n = 307) |
64 (25-91) |
59 (42-74) |
0.503 |
Sex (n = 309) |
|||
Male |
212 (69) |
1 (20) |
0.039 |
Female |
97 (31) |
4 (80) |
|
Smoking status (n = 287) |
|||
Non smoker |
82 (29) |
4 (80) |
0.030 |
Ever smoker |
205 (71) |
1 (20) |
|
Stage (n = 284) |
|||
I |
63 (22) |
0 |
0.646 |
II |
23 (8) |
0 |
|
III |
51 (18) |
1 (20) |
|
IV |
147 (52) |
4 (80) |
|
Histology (n = 309) |
|||
ADC1 |
256 (83) |
4 (80) |
0.827 |
SCC2 |
11 (3) |
0 |
|
LCC3 |
6 (2) |
0 |
|
NSCLC NOS4 |
36 (12) |
1 (20) |
|
KRAS (n = 210) |
|||
Wild-type |
174 (83) |
5 (100) |
1.000 |
Mutated |
36 (17) |
0 |
|
EGFR (n = 276) |
|||
Wild-type |
260 (94) |
5 (100) |
1.000 |
Mutated |
16 (6) |
0 |
|
ALK (n = 311) |
|||
Non-rearranged |
309 (99) |
5 (100) |
1.000 |
Rearranged |
4 (1) |
0 |
|
1Adenocarcinoma
2Squamous cell carcinoma
3Large cell carcinoma
4Non-small cell lung carcinoma not otherwise specified
ROS1 rearrangements
ROS1 FISH was evaluable in 283 cases (90.1%). The basket cases were due to insufficient tumor material or FISH assay failure. ROS1 rearrangements were found in five cases (1.8%); three of them showed a typical rearranged pattern with deletion of the fused allele (1O1G) and the other two cases had an atypical rearranged pattern with 5’ROS1 deletion (1F1G) and with gains (1F2G) (Figure 1). Of note, one of the typical rearranged cases was heterogeneous showing a negative area with ROS1 deletion. The mean percentage of positive cells in all cases was 70%. Regarding to ROS1 partners, they were identified in three cases: two harbored a t(5;6)(q32;q22)with CD74-ROS1 fusion, one of them showing isolated 5’CD74 signals; and the third presented a t(4;6)(q15.2;q22)with SLC34A2-ROS1 rearrangement.
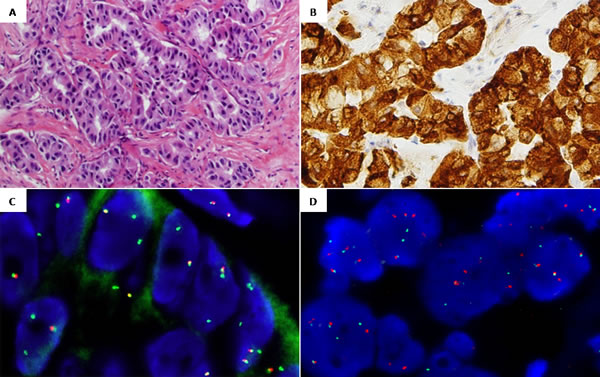
Figure 1: Representative images from case 2 ROS1-rearranged: A. Hematoxylin and eosin, 20x. Adenocarcinoma showing a predominantly acinar pattern. B. ROS1 IHC, 20x. Cytoplasmatic +3/+4 staining pattern. C. ROS1 FISH, 100x. Break-apart probe showing an atypical rearranged pattern with 5’ROS1 deletions (1F2G). D. CD74 FISH, 100x. Break-apart probe showing a typical rearranged pattern with fused and split signals (2F2O2G).
Four of these five tumors presented ADC histology, the other one classified as NSCLC NOS. Two of the confirmed ADC had a predominantly solid pattern, whereas the two remaining cases had a predominantly papillary pattern. Regarding to ROS1 IHC pattern of staining, three out of the five cases presented a cytoplasmic predominant pattern whereas only one case presented a membranous predominant pattern (with mild +1 cytoplasmic associated ROS1 staining). Material was not available from the last case to perform ROS1 IHC assay. Characteristics of ROS1 positive cases are presented in Table 2.
We observed a significant association between ROS1 rearrangement and female gender (p=0.039) as well as with non-smoking history (p=0.030).
Table 2: Histopathological features of ROS1-rearranged specimens
Case |
FISH pattern1 |
Fusion partner |
H-Score |
Staining pattern |
Sample |
Histology, predominant |
ROS1 1 |
1O1G |
SLC34A2 |
400 |
Cytoplasmic |
Visceral pleura |
NSCLC NOS2, N/A3 |
ROS1 2 |
1F2G |
CD74 |
300-400 |
Cytoplasmic |
Lung |
ADC4, acinar |
ROS1 3 |
1O1G |
N/A |
400 |
Membranous |
Lung |
ADC, solid |
ROS1 4 |
1O1G |
CD74 |
300-400 |
Cytoplasmic |
Lung |
ADC, papillary |
ROS1 55 |
1F1G |
N/A |
N/A |
N/A |
Lung |
ADC, papillary |
1 FISH pattern indicates the result of the ROS1 break-apart probe used, labeled 5’ROS1 Spectrum orange (O) and 3’ROS1Spectrum green (G).
2 Non-small cell lung carcinoma not otherwise specified
3 Not available
4 Adenocarcinoma
5 Material was not available to perform FISH fusion partner studies and ROS1 IHC assay.
ROS1 copy number alterations
In ROS1 non-rearranged cases, gains were the most prevalent CNAs observed in 96 cases (33.9%) and in a high proportion of cells (mean percentage of 48%). Using CEP6 control probe, we confirm that gain of ROS1 was due to chromosome 6 polysomy. ROS1 amplifications were identified in eleven cases (3.9%), all of them with ADC histology. Amplified cases were classified in two groups: patients that had ROS1 signal clusters (n=3) and patients with a chromosome 6 high polysomy (n=8) (Figure 2). In addition, 71 cases (25.1%) had ROS1 deletions with a mean percentage of ROS1 deleted cells of 42%. After CEP6 hybridization, heterogeneity in the enumeration of chromosome 6 was observed. Both monosomy and polysomy of CEP6 were observed in the same tumor sample.
All the specimens that were negative for the ROS1 rearrangements by FISH presented negative IHC ROS1 staining. In some of them, mild (+1/+2) and diffuse cytoplasmic staining was detected (presenting H-score: <200). If only 3+ (diffusely) expressing tumors were considered positive, ROS1 IHC is 100% sensitive and 87.5% specific for the presence of ROS1 rearrangements by FISH. Of note, in some cases mild (+1) ROS1 cytoplasmic staining was detected in benign type II pneumocytes.
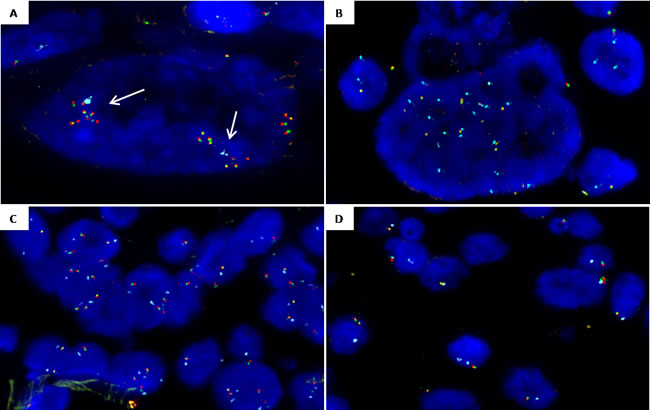
Figure 2: Representative images from ROS1 copy number alterations detected by FISH (ROS1 break-apart probe (spec.orange/green fusion signals) and CEP6 probe (spec.aqua signals). A. ROS1 cluster amplification (arrows) in a nuclei with two copies of CEP6. B. ROS1 amplification with chromosome 6 high polysomy (15 ROS1 and 15 CEP6 copies). C. Polysomic nuclei with 3-4 copies of chromosome 6 and 3-4 copies of ROS1. D. Case showing heterogeneity of ROS1 deletion: nuclei with ROS1 monosomy (1 ROS1 1 CEP6) and nuclei with ROS1 deletion and chromosome 6 disomy (1 ROS1/ 2 CEP6).
Heterogeneity assessment
Focusing on heterogeneity in TMAs, 161 out of 192 cores were assessable for ROS1 FISH analysis and 174 for ROS1 IHC (Figure 3). As no positive ROS1 cases were found in the TMAs, the heterogeneity assessment was performed considering only ROS1 CNAs. When evaluating CNAs as a categorical variable (gain, amplification, deletion and disomic), Kappa agreement index for ROS1 FISH status between cores A and B was 0.24. When ROS1 IHC status was analyzed considering 0, +1, +2 and +3 score criteria, no differences in classification between cores A and the remaining three cores (B to D) were observed. The result changed from negative to borderline +2 only in four cases.
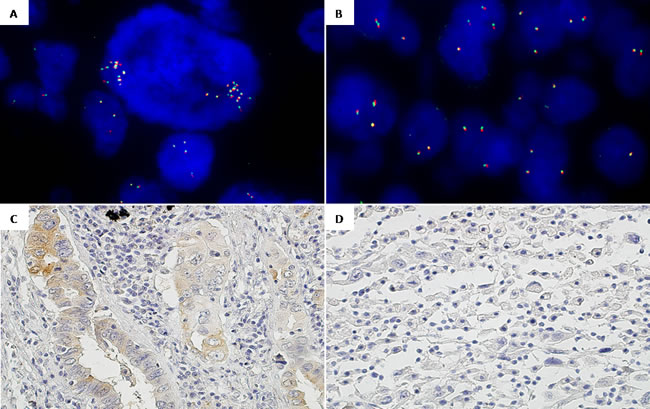
Figure 3: Intra-tumor heterogeneity regarding ROS1 status by FISH and IHC in one TMAs case. A. ROS1 FISH, 100x. Core 1: Negative ROS1 presenting cells with focal amplifications. B. ROS1 FISH, 100x. Core 2: Disomic ROS1 cells and nuclei with ROS1 gene gains without amplification. C. ROS1 IHC, 20x. Core 1: ROS1 +1/+2 predominantly acinar. D. ROS1 IHC, 20x. Core 2: ROS1 0 discohesive (sarcomatoid).
Survival analysis
We sought to explore the potential impact on survival of ROS1 alterations, analyzed only in patients with advanced disease (stages III-IV). Out of 144 cases with available data, 94 death events occurred during the follow-up period. The median follow-up time for the whole series was 15.2 months (95% CI 12-18.3) and median survival time was 26.2 month. One, two and three-year survival rates were 59.1%, 33% and 21.6%, respectively. The median survival time in ROS1-positive patients was significantly higher: 69.8 month vs. 13.7 months (95% CI 9.9-17.5) in the ROS1-negative group (p=0.028) (Figure 4). All positive patients received Crizotinib treatment. Setting survival analysis according to CNAs, neither copy number gains nor deletions of ROS1 gene had impact on survival.
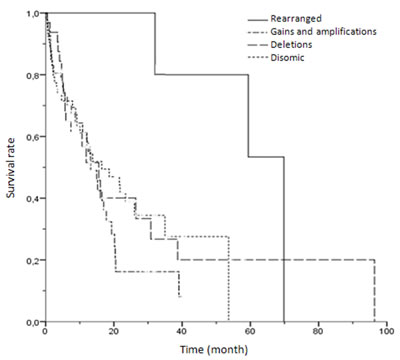
Figure 4: Kaplan-Meier univariate analysis of survival rates among patients with different ROS1 FISH results (rearranged, gains/amplifications, deletions and disomic cases) (p = 0.087).
DISCUSSION
We examined ROS1 status in a cohort of patients with NSCLC. The main findings of our study are the following: (1) the prevalence of ROS1 gene rearrangement in a Spanish cohort is 1.8%; (2) ROS1-rearranged cases are significantly associated with female gender and never smoker patients; (3) IHC correlates with FISH in ROS1-rearranged cases; (4) ROS1 CNAs are frequent, with a remarkably 33.9% of gains, 3.9% of amplifications, and 25.1% of deletions; (5) ROS1 CNAs had no impact on overall survival.
In previous studies, ROS1 rearrangements were detected in 0.8 to 2.5% of unselected NSCLC patients [12, 19]. Here we present a cohort of cases evaluated for ROS1 status using FISH that confirms the low frequency of ROS1 rearrangements in a Caucasian population. Similar to prior reports, we found an association of ROS1 rearrangement with non-smoking history [19, 20]. Moreover our study reports an association with female patients. The clinical profile of these patients is remarkably similar to that of ALK-rearranged, including features like gender and non-smoking history [13] and also advanced stage [21]. As recent publications demonstrate, the frequency of ROS1 rearrangements in clinically selected patients is higher, reaching values of 7.4% [18]. Giving that fact, a properly clinical selection can significantly enrich for the incidence of ROS1 rearrangements in the tested population.
ROS1 rearranged cases were detected also with ROS1 D4D6 IHC. In previous studies, FISH and IHC had a good correlation although optimal IHC criteria need to be established [9, 17]. As other authors mentioned, ROS1 is expressed in NSCLC without concomitant translocation [22] and also some cases with ROS1 rearrangements detected by FISH have low protein expression suggesting a low sensitivity of IHC [9, 23]. In our hands, IHC analysis optimally detects ROS1 positive cases although additional studies are needed to consider this method as a screening routine test.
Regarding FISH characterization of positive cases, we identify two known fusion partners: CD74 and SLC34A2. Clinically, the small numbers of cases preclude any correlation between the specific fusion partner and outcome [12, 24] as well as to date, no correlation has been observed between the type of ROS1 rearrangement and clinical response to Crizotinib [11]. Next generation sequencing (NGS) techniques could be a better approach to identify all ROS1 fusion genes, due to the high number of fusion partners described. Still, the main limitation of these techniques is to have sufficient material to be studied [25].
Regarding ROS1 CNAs, we found a high prevalence of ROS1 gene copy number gains without impact in overall survival. Jin et al. (2015) recently reported that ROS1 gains were significantly associated with both shorter disease-free survival and shorter overall survival [19]. It is remarkable that they only found 4.8% of cases with ROS1 gains whereas in our cohort the percentage of samples with gains/amplifications was significantly higher (37.8%). They studied unselected cohort of surgically resected NSCLC patients, and found that copy number gains are more common in male patients with squamous histology. Most of the patients included in our study had a stage III-IV (70%) with a low representation of squamous histology (3%). Differences in patient selection could explain discrepancies. In our series, amplifications were identified in only eleven specimens, all of them presenting signal clusters or chromosome 6 high polysomy in large cells. Remarkably, ROS1 protein expression was not detectable in any of these cases suggesting that amplification might not be a biologically relevant event or predict response to ROS1 inhibitors [26].
Additionally, the current study demonstrates that ROS1 gene copy number is heterogeneous within surgical NSCLC specimens. This finding has potential diagnostic implications considering that in our routine clinical practice endoscopic, core-needle biopsies or cytology samples containing only a small part of tumor were used to make treatment decisions.
Interestingly, our study is the first to report a high prevalence of ROS1 deletions. Heterogeneity in the enumeration of chromosome 6 was observed, being 6q deletion or monosomy or both, the cause of ROS1 loss. Previous cytogenetic studies demonstrated that loss of 6q, where ROS1 gene is located, is one of the commonest chromosomal aberrations in lung ADC [27, 28]. So, as shown in our cohort, it is expected to observe ROS1-positive samples with concomitant deletion of ROS1 non-rearranged allele. Particularly, one of the ROS1 positive tumors exhibits two distinct areas, one with ROS1 gene deletion without rearrangement and the other with positive ROS1 1O1G pattern suggesting that even though ROS1 rearrangements are driver mutations, 6q deletion/monosomy could occur as a primary event in NSCLC. Opposed to the other ROS1 positive patients that elicited a partial response to Crizotinib, this patient did not respond, suggesting that heterogeneity of genetic alterations could explain differences in response to treatments.
Our study demonstrates a significant increased median overall survival time for ROS1-positive compared to ROS1-negative NSCLC patients (69.8 vs. 13.7 month) (p=0.028). This result is consistent with recently data reported by Scheffler et al. (2015): ROS1 seems to be one of the best prognostic molecular markers in NSCLC and stays in line of recent reports pointing the high efficacy of Crizotinib treatment for these patients [29, 30].
In conclusion, our study confirms the low prevalence of ROS1 rearrangements in Spanish NSCLC patients and shows a high prevalence of ROS1 CNAs that should be taken into account when assessed by FISH although do not present associated clinical implications. ROS1 break-apart FISH is herein validated as a reliable method to diagnose ROS1 rearrangements and also as a detailed method that helps us to understand the biology of NSCLC tumors more deeply.
MATERIAL AND METHODS
Study population
A total of 314 formalin-fixed and paraffin-embedded (FFPE) samples referred between 2012 and 2014 were available for this study. Material confirmed for NSCLC (surgical specimens, core-needle biopsies or cytological cell-blocks) was screened for ROS1 rearrangements using FISH in two Spanish centers: Hospital del Mar, Barcelona (n=247), and Hospital Germans Trias i Pujol, Badalona (n=67). ROS1 FISH was performed in sequence to EGFR, KRAS and ALK testing. This project was approved by the local ethics committee (CEIC-IMAS) and all patients provided written informed consent. Clinical data were extracted from medical records and included age, sex, smoking history, tumor disease stage and clinical follow-up information.
Tissue microarray construction
Based on tissue availability, 47 surgically resected tumors from our Institution were selected to construct three tissue microarrays (TMAs) [31]. Briefly, original hematoxylin and eosin-stained sections were reviewed from each patient to determine different malignant areas and to identify benign lung tissue. Three tissue cores were obtained from each patient, two of them containing different histological areas of the carcinoma (named A and B) and the third containing benign lung parenchyma. The cores then were brought into a new recipient and a paraffin block was constructed using a tissue micro arrayer (Beecher Instruments, Sun Prairie WI). To assess heterogeneity three other TMAs were constructed with different replicas of each tumoral area (named C and D).
ROS1 fluorescence in situ hybridization (FISH)
FISH was conducted on FFPE tissues from the whole tumor samples and the TMAs sections as previously described [32], using commercially break-apart ROS1 locus probes (Abbott Molecular, Des Plaines, IL and/or ZytoVision, Bremerhaven, Germany). A minimum of fifty non-overlapping cells with hybridization signals were examined for each case with a BX51 fluorescence microscope (Olympus, Tokyo, Japan). Samples were considered positive if more than 15% of cells showed split 5’ROS1 (Spec. Orange) and 3’ROS1 (Spec. Green) signals (typical rearranged pattern) or isolated 3’ROS1 signals (atypical rearranged pattern). The FISH rearrangement patterns are described in the text as the number of fusion signals (F) followed by the number of 5’ROS1 signals (O) and 3’ROS1 signals (G). ROS1 CNAs such as gains/amplifications and deletions were also recorded. Gain was defined as a mean copy number greater than 3 fused signals in >40% of nuclei, and amplification as the presence of >15 copies of ROS1 per cell (high polysomy) or clusters, in a minimum of 15% of analyzed cells. Cut-off for ROS1 deletion was assessed in benign lung parenchyma from TMAs cores and established at 1 copy in >30% of nuclei. Moreover, in order to determine the cause of ROS1 CNAs, TMAs and ROS1 amplified cases were analyzed with CEP6 control probe (Spec. Aqua; Abbott Molecular, Des Plaines, IL).
Positive cases were screened for the detection of fusion partners using break-apart non-commercial probes selected from the Human 32K BAC Re-Array Library (BACPAC Resource Center, Oakland, CA). The following clones were selected: CD74 (5q32): RP11-725L10 and RP11-690J03; EZR (6q25.3): RP11-654E18 and RP11-268N15; SLC34A2 (4p15.2): RP11-659J14 and RP11-790A19; and SDC4 (20q12): RP11-69D17 and RP11-220B01.
ROS1 immunohistochemistry (IHC)
ROS1 IHC was performed using the commercially available clone D4D6 (Cell Signalling Technology, Danvers, MA) on unstained FFPE tissue sections from the whole tumor of ROS1 positive and the TMAs samples. The primary antibody was manually applied at 1:50 dilution and incubated at 37°C for 1 hour. Samples were then revealed using the FlexPlus DAB Detection Kit in a Dako Autostainer Plus (Dako, Carpinteria, CA). ROS1 IHC staining was evaluated by two independent pathologists. Staining was graded semiquantitatively as follows: 0 for absent expression or nuclear expression only, 1+ for cytoplasmic faint, barely perceptible staining not exceeding background in any percentage of cells, 2+ for cytoplasmic staining exceeding background in 0 to 50% of tumor cells, and 3+ for cytoplasmic staining exceeding background in >50% of tumor cells [33]. Moreover, H-score was recorded as initially described to evaluate EGFR expression [34]. Briefly, this score ranges from 0 to 400 that result from the combination of the staining intensity (0-4) and the percentage of positive tumor cells (0-100%) in each sample.
Statistical analysis
The whole series of cases were studied in order to characterize associations between clinicopathological variables and FISH data (ROS1 rearrangement and ROS1 CNAs). From TMAs cases, the core with the most prevalent CNA was selected. Statistical associations were assessed using Pearson’s χ2 test or Fisher’s exact test, depending on the sample size. All statistical tests were conducted at the two-sided 0.05 alpha level of significance. Survival curves were obtained with the Kaplan-Meier method, and log-rank test was used for comparison of survival curves between different groups of patients. For each patient, cumulative survival was calculated from the date of diagnosis to death (from any cause) or last follow-up. Heterogeneity of FISH and IHC data of TMAs was assessed using Kappa agreement index for categorical variables. All statistical analyses were carried out with SPSS version 15 (SPSS Inc., Chicago, IL).
ACKNOWLEDGEMENTS
The authors want to thank María Rodríguez-Rivera, Carme Melero and Marta Lorenzo for their technical support. This work was supported in part by a grant from (1) Fundació La Marató de TV3 (666/C/2013), from (2) Red Temática de Investigación Cooperativa en Cáncer (RD12/0036/0044), from (3) Instituto de Salud Carlos III FEDER (PT13/0010/0005), (4) from Xarxa de Bancs de Tumors (XBTC), (5) from Agència de Gestió d’Ajuts Universitaris i de Recerca (2014SGR740) and (6) from Fondo de Investigaciones Sanitarias (FIS-ISCIII) (PI13/00140).
CONFLICT OF INTERESTS
There is no conflict of interest.
Editorial note
This paper has been accepted based in part on peer-review conducted by another journal and the authors’ response and revisions as well as expedited peer-review in Oncotarget.
REFERENCES
1. Lynch TJ, Bell DW, Sordella R, Gurubhagavatula S, Okimoto RA, Brannigan BW, Harris PL, Haserlat SM, SupkoJG, Haluska FG, Louis DN, Christiani DC, Settleman J, et al. Activating mutations in the epidermal growth factor receptor underlying responsiveness of non-small-cell lung cancer to gefitinib. N Engl J Med. 2004; 350:2129-39.
2. Davies KD, Le AT, Theodoro MF, Skokan MC, Aisner DL, Berge EM, Terracciano LM, Cappuzzo F, Incarbone M, Roncalli M, Alloisio M, Santoro A, Camidge DR, et al. Identifying and targeting ROS1 gene fusions in non-small cell lung cancer. Clin Cancer Res. 2012; 18:4570-9.
3. Soda M, Choi YL, Enomoto M, Takada S, Yamashita Y, Ishikawa S, Fujiwara S, Watanabe H, Kurashina K, Hatanaka H, Bando M, Ohno S, Ishikawa Y, et al. Identification of the transforming EML4-ALK fusion gene in non-small-cell lung cancer. Nature. 2007; 448:561-6.
4. Li T, Kung HJ, Mack PC and Gandara DR. Genotyping and genomic profiling of non-small-cell lung cancer: implications for current and future therapies. J Clin Oncol. 2013; 31:1039-49.
5. Oxnard GR, Binder A and Janne PA. New targetable oncogenes in non-small-cell lung cancer. J Clin Oncol. 2013; 31:1097-104.
6. Birchmeier C, Birnbaum D, Waitches G, Fasano O and Wigler M. Characterization of an activated human ros gene. Mol Cell Biol. 1986; 6:3109-16.
7. Chin LP, Soo RA, Soong R and Ou SH. Targeting ROS1 with anaplastic lymphoma kinase inhibitors: a promising therapeutic strategy for a newly defined molecular subset of non-small-cell lung cancer. J Thorac Oncol. 2012; 7:1625-30.
8. Davies KD and Doebele RC. Molecular pathways: ROS1 fusion proteins in cancer. Clin Cancer Res. 2013; 19:4040-5.
9. Warth A, Muley T, Dienemann H, Goeppert B, Stenzinger A, Schnabel PA, Schirmacher P, Penzel R and Weichert W. ROS1 expression and translocations in non-small-cell lung cancer: clinicopathological analysis of 1478 cases. Histopathology. 2014; 65:187-94.
10. Go H, Kim DW, Kim D, Keam B, Kim TM, Lee SH, Heo DS, Bang YJ and Chung DH. Clinicopathologic analysis of ROS1-rearranged non-small-cell lung cancer and proposal of a diagnostic algorithm.J Thorac Oncol. 2013; 8:1445-50.
11. Shaw AT, Ou SH, Bang YJ, Camidge DR, Solomon BJ, Salgia R, Riely GJ, Varella-Garcia M, Shapiro GI, Costa DB, Doebele RC, Le LP, Zheng Z, et al. Crizotinib in ROS1-Rearranged Non-Small-Cell Lung Cancer. N Engl J Med. 2014; 371:1963-71.
12. Yoshida A, Kohno T, Tsuta K, Wakai S, Arai Y, Shimada Y, Asamura H, Furuta K, Shibata T and Tsuda H. ROS1-rearranged lung cancer: a clinicopathologic and molecular study of 15 surgical cases. Am J Surg Pathol. 2013; 37:554-62.
13. Bergethon K, Shaw AT, Ou SH, Katayama R, Lovly CM, McDonald NT, Massion PP, Siwak-Tapp C, Gonzalez A, Fang R, Mark EJ, Batten JM, Chen H, et al. ROS1 rearrangements define a unique molecular class of lung cancers. J Clin Oncol. 2012; 30:863-70.
14. Gainor JF and Shaw AT. Novel targets in non-small cell lung cancer: ROS1 and RET fusions. Oncologist. 2013; 18:865-75.
15. Huber KV, Salah E, Radic B, Gridling M, Elkins JM, Stukalov A, Jemth AS, Gokturk C, Sanjiv K, Stromberg K, Pham T, Berglund UW, Colinge J, et al. Stereospecific targeting of MTH1 by (S)-crizotinib as an anticancer strategy. Nature. 2014; 508:222-7.
16. Kwak EL, Bang YJ, Camidge DR, Shaw AT, Solomon B, Maki RG, Ou SH, Dezube BJ, Janne PA, Costa DB, Varella-Garcia M, Kim WH, Lynch TJ, et al. Anaplastic lymphoma kinase inhibition in non-small-cell lung cancer. N Engl J Med. 2010; 363: 1693-703.
17. Yoshida A, Tsuta K, Wakai S, Arai Y, Asamura H, Shibata T, Furuta K, Kohno T and Kushima R. Immunohistochemical detection of ROS1 is useful for identifying ROS1 rearrangements in lung cancers. Mod Pathol. 2014; 27:711-20.
18. Mescam-Mancini L, Lantuejoul S, Moro-Sibilot D, Rouquette I, Souquet PJ, Audigier-Valette C, Sabourin JC, Decroisette C, Sakhri L, Brambilla E and McLeer-Florin A. On the relevance of a testing algorithm for the detection of ROS1-rearranged lung adenocarcinomas. Lung Cancer. 2014; 83:168-73.
19. Jin Y, Sun PL, Kim H, Park E, Shim HS, Jheon S, Kim K, Lee CT and Chung JH. ROS1 gene rearrangement and copy number gain in non-small cell lung cancer. Virchows Arch. 2015; 466:45-52.
20. Kim HR, Lim SM, Kim HJ, Hwang SK, Park JK, Shin E, Bae MK, Ou SH, Wang J, Jewell SS, Kang DR, Soo RA, Haack H, et al. The frequency and impact of ROS1 rearrangement on clinical outcomes in never smokers with lung adenocarcinoma. Ann Oncol. 2013; 24:2364-70.
21. Vidal J, Clave S, de Muga S, Gonzalez I, Pijuan L, Gimeno J, Remon J, Reguart N, Vinolas N, Girones R, Bernet L, Majem M, Bosch-Barrera J, et al. Assessment of ALK Status by FISH on 1000 Spanish Non-Small Cell Lung Cancer Patients. J ThoracOncol. 2014; 9:1816-20.
22. Lee HJ, Seol HS, Kim JY, Chun SM, Suh YA, Park YS, Kim SW, Choi CM, Park SI, Kim DK, Kim YH and Jang SJ. ROS1 receptor tyrosine kinase, a druggable target, is frequently overexpressed in non-small cell lung carcinomas via genetic and epigenetic mechanisms. Ann Surg Oncol. 2013; 20:200-8.
23. Rogers TM, Russell PA, Wright G, Wainer Z, Pang JM, Henricksen LA, Singh S, Stanislaw S, Grille J, Roberts E, Solomon B and Fox SB. Comparison of methods in the detection of ALKand ROS1 rearrangements in lung cancer. Journal of thoracic oncology. 2015; 10:611-8.
24. Gold KA. ROS1--targeting the one percent in lung cancer. N Engl J Med. 2014; 371:2030-1.
25. Ou SH, Chalmers ZR, Azada MC, Ross JS, Stephens PJ, Ali SM and Miller VA. Identification of a novel TMEM106B-ROS1 fusion variant in lung adenocarcinoma by comprehensive genomic profiling. Lung Cancer. 2015; 88:352-4.
26. Salido M, Pijuan L, Martinez-Aviles L, Galvan AB, Canadas I, Rovira A, Zanui M, Martinez A, Longaron R, Sole F, Serrano S, Bellosillo B, Wynes MW, et al. Increased ALK gene copy number and amplification are frequent in non-small cell lung cancer. J ThoracOncol. 2011; 6:21-7.
27. Zhu H, Wong MP and Tin V. High-resolution detection of recurrent aberrations in lung adenocarcinomas by array comparative genomic hybridization and expression analysis of selective genes by quantitative PCR. Int J Oncol. 2014; 44:2068-76.
28. Shen H, Zhu Y, Wu YJ, Qiu HR and Shu YQ. Genomic alterations in lung adenocarcinomas detected by multicolor fluorescence in situ hybridization and comparative genomic hybridization.Cancer Genet Cytogenet. 2008; 181:100-7.
29. Scheffler M, Schultheis A, Teixido C, Michels S, Morales-Espinosa D, Viteri S, Hartmann W, Merkelbach-Bruse S, Fischer R, Schildhaus HU, Fassunke J, Sebastian M, Serke M, et al. ROS1 rearrangements in lung adenocarcinoma: prognostic impact, therapeutic options and genetic variability. Oncotarget. 2015; 6:10577-85. doi: 10.18632/oncotarget.3387
30. Mazieres J, Zalcman G, Crino L, Biondani P, Barlesi F, Filleron T, Dingemans AM, Lena H, Monnet I, Rothschild SI, Cappuzzo F, Besse B, Thiberville L, et al. Crizotinib therapy for advanced lung adenocarcinoma and a ROS1 rearrangement: results from the EUROS1 cohort. Journal of clinical oncology. 2015; 33:992-9.
31. Kononen J, Bubendorf L, Kallioniemi A, Barlund M, Schraml P, Leighton S, Torhorst J, Mihatsch MJ, Sauter G and Kallioniemi OP. Tissue microarrays for high-throughput molecular profiling of tumor specimens. Nat Med. 1998; 4:844-7.
32. Salido M, Tusquets I, Corominas JM, Suarez M, Espinet B, Corzo C, Bellet M, Fabregat X, Serrano S and Sole F. Polysomy of chromosome 17 in breast cancer tumors showing an overexpression of ERBB2: a study of 175 cases using fluorescence in situ hybridization and immunohistochemistry. Breast Cancer Res. 2005; 7:R267-73.
33. Sholl LM, Sun H, Butaney M, Zhang C, Lee C, Janne PA and Rodig SJ. ROS1 immunohistochemistry for detection of ROS1-rearranged lung adenocarcinomas. The American journal of surgical pathology. 2013; 37:1441-9.
34. Cappuzzo F, Hirsch FR, Rossi E, Bartolini S, Ceresoli GL, Bemis L, Haney J, Witta S, Danenberg K, Domenichini I, Ludovini V, Magrini E, Gregorc V, et al. Epidermal growth factor receptor gene and protein and gefitinib sensitivity in non-small-cell lung cancer. J Natl Cancer Inst. 2005; 97:643-55.