
INTRODUCTION
Drug targets, a class of biological targets, are in vivo binding sites which include receptors, enzymes, ion channels and nucleic acids, etc. Drugs bind to their corresponding targets and perform the desirable therapeutic effects [1]. To date, thousands of drug targets have been identified and stored in databases such as DrugBank [2], Therapeutic Target Database (TTD) [3], Potential Drug Target Database (PDTD) [4] and TDR Targets Database [5].
Previous researches have shown that evolutionary features offer fresh views to many important fields that are related to drug discovery, including immunology [6], physiology [7, 8], epidemiology [9] and neurosciences [10]. Wang et al. [11] conducted an analysis and showed that some targeted genes shared common evolutionary features, which suggested that evolutionary information might provide novel insights for characterizing drug targets from new perspectives.
However, most of the current studies about evolutionary conservation focus on a single gene or several genes belonging to a same protein family, rather than a large group of genes with same or similar features [12–16]. Compared with conventional analyses of evolutionary conservation, gene sets with a large number of genes can better reflect the characteristics of evolution. In addition, evolution conservation can be not only reflected by the general features such as evolutionary rate, the percentage of orthologous genes and protein sequence identity, but also by the network features [17, 18]. Therefore, we wondered whether there was difference in evolutionary features between drug target genes and non-target genes. We hoped to integrate comprehensive evolutionary information and investigate the evolutionary conservation characteristics of drug target genes from a global perspective.
Therefore, we compared the evolutionary features between drug target genes and non-target genes combining both regular evolutionary features and some network features. All the evolutionary features were categorized into two groups: (1) evolutionary features of 21 species including evolutionary rate, conservation score and the percentage of orthologous genes; (2) topological features of human protein-protein interaction network including the average shortest path length, betweenness centrality, clustering coefficient and degree. In this research, we hope to explore the evolutionary conservation features of drug targets and help to enhance the efficiency of target identification.
RESULTS
Drug target genes had lower evolutionary rates than non-target genes
For each of the 21 species, we calculated the evolutionary rate dN/dS of both the drug target genes and non-target genes. We also respectively calculated the median dN/dS of drug target genes and non-target genes for each species and compared them using a line chart (Figure 1A). The results showed that the median dN/dS of drug target genes was significantly lower than that of non-target genes (P = 6.41E−05). For each species, a box plot was given to display the difference of dN/dS between the two groups of genes (Figure 1B). The results of box plots and Wilcoxon rank sum tests showed that the evolutionary rate of drug target genes was lower than that of the non-drug target genes for each of the 21 species. Detailed information about the dN/dS for each species is given in Table 1.
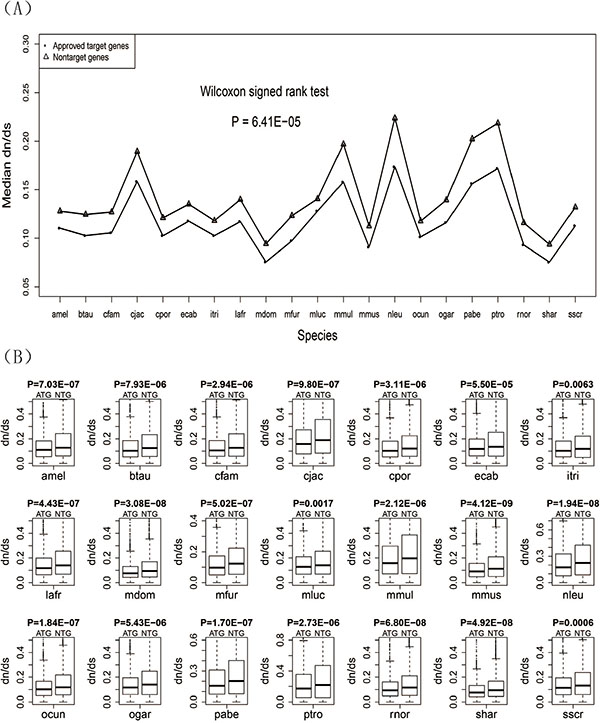
Figure 1: Evolutionary rates (dN/dS ratios) for the drug target genes and non-target genes. (A) Line chart of the drug target genes and non-target genes. (B) Box plots of the drug target genes against non-target genes for each of the 21 species.
Table 1: Summary statistics for the comparisons of dn/ds in species
Species |
dn/ds of Approved Drug Target Genes |
dn/ds of Non-Target Genes |
Wilcoxon Rank Sum test P-value |
||||
|---|---|---|---|---|---|---|---|
Median |
Upper Quartile |
Lower Quartile |
Median |
Upper Quartile |
Lower Quartile |
||
amel |
0.1104 |
0.1831 |
0.0555 |
0.1280 |
0.2426 |
0.0608 |
7.03E–07 |
btau |
0.1028 |
0.1851 |
0.0535 |
0.1246 |
0.2344 |
0.0564 |
7.93E–06 |
cfam |
0.1057 |
0.1857 |
0.0576 |
0.1270 |
0.2408 |
0.0591 |
2.94E–06 |
cjac |
0.1584 |
0.2733 |
0.0779 |
0.1893 |
0.3575 |
0.0838 |
9.80E–07 |
cpor |
0.1026 |
0.1800 |
0.0534 |
0.1211 |
0.2247 |
0.0578 |
3.11E–06 |
ecab |
0.1177 |
0.1984 |
0.0613 |
0.1352 |
0.2528 |
0.0595 |
5.50E–05 |
itri |
0.1027 |
0.1817 |
0.0538 |
0.1181 |
0.2212 |
0.0487 |
0.0063 |
lafr |
0.1173 |
0.1990 |
0.0645 |
0.1400 |
0.2551 |
0.0684 |
4.43E–07 |
mdom |
0.0757 |
0.1308 |
0.0425 |
0.0943 |
0.1692 |
0.0451 |
3.08E–08 |
mfur |
0.0975 |
0.1736 |
0.0502 |
0.1233 |
0.2235 |
0.0537 |
5.02E–07 |
mluc |
0.1281 |
0.2104 |
0.0684 |
0.1407 |
0.2547 |
0.0693 |
0.00172 |
mmul |
0.1578 |
0.2966 |
0.0709 |
0.1970 |
0.3870 |
0.0730 |
2.12E–06 |
mmus |
0.0910 |
0.1558 |
0.0479 |
0.1125 |
0.2100 |
0.0497 |
4.12E–09 |
nleu |
0.1735 |
0.3260 |
0.0781 |
0.2235 |
0.4261 |
0.0881 |
1.94E–08 |
ocun |
0.1014 |
0.1662 |
0.0510 |
0.1178 |
0.2184 |
0.0570 |
1.84E–07 |
ogar |
0.1163 |
0.1950 |
0.0604 |
0.1395 |
0.2482 |
0.0593 |
5.43E–06 |
pabe |
0.1561 |
0.3096 |
0.0743 |
0.2022 |
0.4018 |
0.0792 |
1.70E–07 |
ptro |
0.1718 |
0.3559 |
0.0578 |
0.2184 |
0.4715 |
0.0574 |
2.73E–06 |
rnor |
0.0931 |
0.1616 |
0.0487 |
0.1159 |
0.2105 |
0.0521 |
6.80E–08 |
shar |
0.0756 |
0.1326 |
0.0426 |
0.0938 |
0.1676 |
0.0451 |
4.92E–08 |
sscr |
0.1130 |
0.1944 |
0.0585 |
0.1321 |
0.2378 |
0.0595 |
0.0006 |
Drug target genes had higher conservation scores than non-target genes
We aligned the protein sequence of both human drug target genes and non-target genes to the orthologous protein sequence of the other 21 species by using BLAST software and got conservation scores from the blast results. The median conservation scores of the two gene sets for 21 species were calculated and displayed by a line chart (Figure 2A) showing that the median conservation score of drug target genes was higher than that of non-target genes. The Wilcoxon signed rank test gave a P-value of 6.40E-05 confirming that there was significant difference in the conservation scores between human drug target genes and non-target genes. For each of the 21 species, the conservation scores of drug target genes are significantly higher than that of the non-target genes (Figure 2B). Detailed information about the conservation score for each species is given in Table 2.
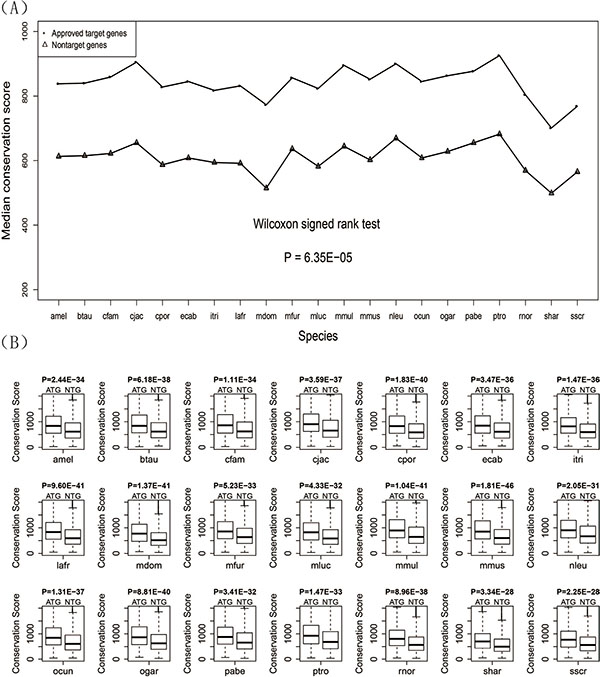
Figure 2: Conservation scores for the drug target genes and non-target genes. (A) Line chart of the drug target genes and non-target genes. (B) Box plots of the drug target genes against non-target genes for each of the 21 species.
Table 2: Summary statistics for the comparisons of conservation score in species
Species |
Sequence Identity of Approved drug Target Genes |
Sequence Identity of Non-Target Genes |
Wilcoxon Rank Sum test P-value |
||||
|---|---|---|---|---|---|---|---|
Median |
Upper Quartile |
Lower Quartile |
Median |
Upper Quartile |
Lower Quartile |
||
amel |
838.00 |
1213.00 |
548.00 |
613.00 |
957.00 |
361.00 |
2.44E–34 |
btau |
840.00 |
1257.50 |
571.50 |
615.00 |
965.00 |
373.50 |
6.18E–38 |
cfam |
859.00 |
1279.00 |
557.25 |
622.00 |
988.00 |
371.00 |
1.11E–34 |
cjac |
905.00 |
1299.50 |
620.00 |
655.00 |
1054.25 |
394.00 |
3.59E–37 |
cpor |
828.00 |
1221.00 |
545.00 |
587.00 |
919.50 |
352.00 |
1.83E–40 |
ecab |
845.00 |
1228.00 |
552.50 |
608.00 |
952.00 |
360.25 |
3.47E–36 |
itri |
817.50 |
1153.00 |
553.25 |
594.00 |
909.00 |
367.50 |
1.47E–36 |
lafr |
831.50 |
1205.25 |
555.00 |
591.50 |
926.00 |
359.00 |
9.60E–41 |
mdom |
773.00 |
1135.75 |
472.00 |
514.50 |
808.25 |
314.00 |
1.37E–41 |
mfur |
856.50 |
1238.75 |
576.00 |
636.00 |
981.25 |
389.00 |
5.23E–33 |
mluc |
823.50 |
1197.00 |
525.00 |
582.00 |
925.00 |
354.00 |
4.33E–32 |
mmul |
895.00 |
1315.75 |
613.00 |
644.00 |
1023.50 |
390.00 |
1.04E–41 |
mmus |
852.00 |
1271.50 |
565.00 |
602.00 |
932.00 |
361.00 |
1.81E–46 |
nleu |
900.00 |
1290.50 |
610.00 |
669.00 |
1064.00 |
403.00 |
2.05E–31 |
ocun |
845.00 |
1233.25 |
568.50 |
608.00 |
949.75 |
360.00 |
1.31E–37 |
ogar |
863.00 |
1272.25 |
580.00 |
628.00 |
974.00 |
382.00 |
8.81E–40 |
pabe |
877.00 |
1257.50 |
595.50 |
655.00 |
1038.00 |
399.00 |
3.41E–32 |
ptro |
925.50 |
1332.00 |
611.00 |
682.00 |
1087.00 |
410.00 |
1.47E–33 |
rnor |
804.00 |
1141.00 |
541.50 |
569.00 |
876.00 |
343.00 |
8.96E–38 |
shar |
701.00 |
1007.00 |
432.50 |
499.00 |
796.00 |
305.00 |
3.34E–28 |
sscr |
768.50 |
1098.75 |
482.25 |
565.00 |
876.00 |
328.00 |
2.25E–28 |
Drug target genes had higher percentages of orthologous genes than non-target genes
We calculated the percentage of orthologous genes of drug target genes and non-target genes for each species and displayed the line chart of this evolutionary feature in Figure 3, which showed that the drug target genes had a higher percentage of orthologous genes than the non-target genes. The P-value of Wilcoxon signed rank test was 9.54E-07 confirming that there was significant difference in the percentage of orthologous genes between the two groups of genes.
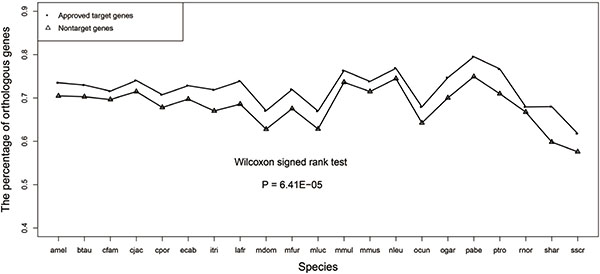
Figure 3: Line chart of the percentage of orthologous genes for the drug target genes and non-target genes.
Drug target genes had a tighter network topology structure than non-target genes
We further analyzed the topological properties of the human protein-protein interaction network downloaded from HPRD and extracted the network features of both drug target genes and non-target genes. Then we compared these features between drug target genes and non-target genes. These following results were obtained: 1) The average shortest path length of drug target genes was significantly smaller than that of non-target genes (Figure 4A) and 2) The betweenness centrality, clustering coefficient and degree of drug target genes were significantly higher than those of non-target genes (Figure 4B–4D). These results showed that drug target genes had a tighter topological structure than non-target genes in the human protein-protein interaction network.
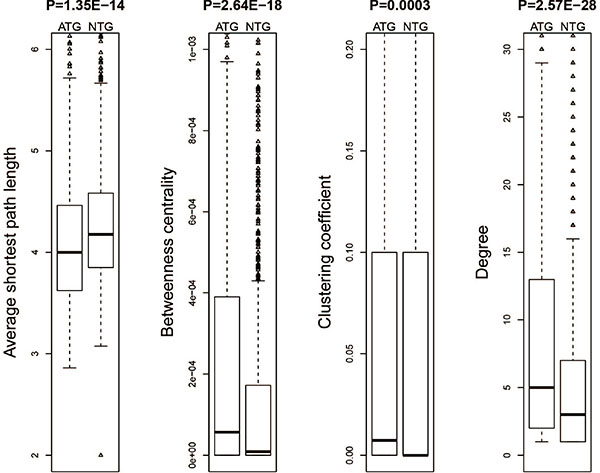
Figure 4: Network topological properties for the drug target genes and non-target genes.
DISCUSSION
It is an important task to investigate the evolutionary conservation of drug target genes, which helps to well characterize drug targets. In this study we analyzed the evolutionary conservation of drug target genes by comparing multiple evolutionary characteristics including both classical features (evolutionary rate, conservation score and percentage of orthologous genes) and network topological properties (average shortest path length, betweenness centrality, clustering coefficient and degree). Through comprehensive analyses, we got consistent results supporting that drug target genes were more evolutionarily conserved during the evolutionary history.
Previous studies about drug targets have identified genes or genome regions with higher evolutionary conservation as potential or candidate drug targets. For instance, the nucleoprotein (NP) of the influenza A virus which is a protein of high conservation was identified as a potential target of universally effective antivirals [19]. Heat shock proteins (HSPs), a ubiquitous group of evolutionary conserved proteins, which are involved in binding antigens and presenting them to the immune system, were determined as possible therapeutic targets [20]. Nonstructural proteins (NS3) are components of flavivirus polyprotein. Shiryaev et al. [21] performed a study focusing on the structural and functional characteristics of flaviviral protease. They found that the N-terminal and C-terminal parts of NS3 were composed by serine protease and the RNA helicase. Individual virus proteins were produced and a new progeny would be assembled if the polyprotein was cleaved by protease or RNA helicase. Since both the protease and the RNA helicase were conserved among flaviviruses, NS3 was identified as a promising drug target in flaviviral infections.
Furthermore, some genes or proteins involved in conserved cellular progress such as DNA replication and apoptosis during evolution can also be identified as potential drug targets. For instance, Robinson et al. [22] explored the architecture and conservation of the bacterial DNA replication machinery and found that genes or proteins involved in maintaining the machinery of DNA replication had the greatest potential as drug targets. The mitochondrial permeability transition (mPT) is a mechanism that enables the secretion of Cytochrome-c (Cyt-c), Apoptosis Inducing Factor (AIF) and other pro-apoptotic proteins which initiate and promote apoptosis. A research conducted by Hellebrand et al. [23] suggested that some mPT inhibitory agents might become promising drug targets against apoptosis.
With the rapid development of computer technology and machine learning theory, evolution information has been used to identify and prioritize drug targets. Ludin et al. [24] predicted antimalarial drug target candidates by utilizing evolution information and found 40 candidate drug targets with high evolution conservation. Another study about drug target identification and prioritization also indicated that many potential drug target genes could be predicted by orthologues information [25].
The comparison analysis results obtained in our study and the previous studies focusing on evolutionary conservation of drug targets or drug target identification based on evolution information suggest that drug targets are closely correlated with evolution conservation and they are characterized by higher evolutionary conservation during evolution process compared with non-target genes. This indicates that the results in our study are quite reliable and they might have the potential to expand the understanding of evolutionary characteristics of drug target genes.
MATERIALS AND METHODS
Human drug target genes
The human drug target gene set used in our study came from the DrugBank database that is a unique bioinformatics and cheminformatics resource combing detailed drug data with comprehensive drug target information [2]. We downloaded the data of Food and Drug Administration (FDA) approved drugs and the corresponding drug targets, which contained a total of 1857 terms for multiple species. We then extracted the human drug targets from the original data and finally obtained 1347 FDA-approved drug target genes for the following analyses.
Non-target genes
With the purpose of getting non-target gene set, we downloaded protein family data from Pfam database (ftp://ftp.sanger.ac.uk/pub/databases/Pfam/releases/Pfam27.0/), a collection of protein families, each represented by multiple sequence alignments and hidden Markov models (HMMs) [26], and obtained the human protein family information. After filtering out the protein families to which drug targets belonged, we got the non-target gene set containing 4181 non-redundant genes. It’s worth noting that non-targets refer to those proteins that do not have similar domains with target proteins.
Calculation of evolutionary rate, percentage of orthologous genes and conservation score
We downloaded the orthologous gene data which included 21 species from the Ensembl database [27–29] (ftp://ftp.ensembl.org/pub/release-69/mysql/ensembl_mart_69). The full names and abbreviations of the 21 species can be found in Table 3. Then we extracted one-to-one ortholog genes [30] with non-null dN (rate of non-synonymous substitutions) and dS (rate of synonymous substitutions) values and calculated the evolutionary rate as the ratio of dN/dS.
Table 3: Full names and abbreviations
Calss |
Abbreviation |
Full name |
|---|---|---|
Species 1 |
amel |
Ailuropoda melanoleuca |
Species 2 |
btau |
Bos taurus |
Species 3 |
cfam |
Canis familiaris |
Species 4 |
cjac |
Callithrix jacchus |
Species 5 |
cpor |
Cavia porcellus |
Species 6 |
ecab |
Equus caballus |
Species 7 |
itri |
Ictidomys tridecemlineatus |
Species 8 |
lafr |
Loxodonta africana |
Species 9 |
mdom |
Monodelphis domestica |
Species 10 |
mfur |
Mustela putorius furo |
Species 11 |
mluc |
Myotis lucifugus |
Species 12 |
mmul |
Macaca mulatta |
Species 13 |
mmus |
Mus musculus |
Species 14 |
nleu |
Nomascus leucogenys |
Species 15 |
ocun |
Oryctolagus cuniculus |
Species 16 |
ogar |
Otolemur garnrttii |
Species 17 |
pabe |
Pongo abelii |
Species 18 |
ptro |
Pan troglodytes |
Species 19 |
rnor |
Rattus norvegicus |
Species 20 |
shar |
Sarcophilus harrisii |
Species 21 |
sscr |
Sus scrofa |
For both drug target genes and non-target genes, we counted the numbers of one-to-one orthologous genes in each of the 21 species and then calculated the percentage of orthologsous genes for each species.
Conservation score is defined as a score assigned to each orthologous gene by sequence alignment between species to determine how conserved a gene is. Here the sequence conservation score is used to evaluate the degree of similarity between a human sequence and another species sequence for the orthologous gene. The higher scores indicate the higher degree of conservation. To compute the sequence conservation score, we downloaded the pair-wise protein sequences of human and other species from BioMart [31] (http://www.ensembl.org/biomart/martview) and performed alignment using BLASTP program and the BLOSUM62 matrix [32].
Calculation of topological properties of human protein-protein interaction network
We downloaded the protein-protein interaction (PPI) network data containing 39240 interaction pairs from the Human Protein Reference Database (HPRD) [33]. In the PPI network, a node denotes a protein and a path denotes a finite sequence of edges which connect proteins. Then we calculated 4 topological properties which included the average shortest path length, betweenness centrality, clustering coefficient and degree [34] by using MCODE, a plug-in of Cytoscape software [35]. The average shortest path length reflecting how tight one node is connected to the other nodes in a network is defined as the average length of all shortest paths passing through a certain node. The normalized betweenness centrality of node v is defined as 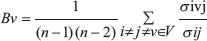 where σij is the number of shortest paths from node i to node j and is the number of shortest paths passing through node v out of σivj. The betweenness centrality is an indicator used to measure a node’s centrality in a network. The clustering coefficient in an undirected network is defined as
 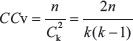 where n is the number of edges connecting the k direct neighbors of node v and
  is the max possible number of edges between k nodes. The clustering coefficient represents the degree to which nodes in a network tend to cluster together. The degree of node v is the number of nodes directly connecting with node v. To compare the network features of the drug target genes and non-target genes, we extracted the topological properties for the two gene sets.
Statistical analysis
We used the Wilcoxon rank sum test to evaluate the statistical significance of the difference in an evolutionary feature or a network feature between the drug target genes and non-target genes. We used the Wilcoxon signed rank test to check whether the median of an evolutionary feature of drug target genes was significantly different from that of the non-target genes for each species. In our study, Perl scripts were used for data processing (http://www.activestate.com/activeperl) and R scripts were used for statistical graphics and calculations (http://cran.r-project.org).
ACKNOWLEDGMENTS AND FUNDING
This work was supported in part by grants from the National Natural Science Foundation of China [grant numbers 31200934, 61300116, and 81300945] and the Natural Science Foundation of Heilongjiang Province, China [grant numbers C201206 and QC2013C063].
CONFLICTS OF INTEREST
The authors declare that they have no conflicts of interest.
REFERENCES
1. Landry Y, Gies JP. Drugs and their molecular targets: an updated overview. Fundamental & clinical pharmacology. 2008; 22:1–18.
2. Wishart DS, Knox C, Guo AC, Shrivastava S, Hassanali M, Stothard P, Chang Z, Woolsey J. DrugBank: a comprehensive resource for in silico drug discovery and exploration. Nucleic Acids Res. 2006; 34:D668–672.
3. Zhu F, Shi Z, Qin C, Tao L, Liu X, Xu F, Zhang L, Song Y, Liu X, Zhang J. Therapeutic target database update 2012: a resource for facilitating target-oriented drug discovery. Nucleic Acids Res. 2011:gkr797.
4. Gao Z, Li H, Zhang H, Liu X, Kang L, Luo X, Zhu W, Chen K, Wang X, Jiang H. PDTD: a web-accessible protein database for drug target identification. BMC Bioinformatics. 2008; 9:104.
5. Agüero F, Al-Lazikani B, Aslett M, Berriman M, Buckner FS, Campbell RK, Carmona S, Carruthers IM, Chan AE, Chen F. Genomic-scale prioritization of drug targets: the TDR Targets database. Nature Reviews Drug Discovery. 2008; 7:900–907.
6. Riou O, Azria D, Larbouret C, Robert B. Biologic modulation of ionizing radiation by Toll-like receptors agonists: towards an increase in the therapeutic index of radiotherapy? [Article in French]. Bull Cancer. 2012; 99:545–550.
7. Trauner A, Borrell S, Reither K, Gagneux S. Evolution of drug resistance in tuberculosis: recent progress and implications for diagnosis and therapy. Drugs. 2014; 74:1063–1072.
8. Johnson RJ, Sautin YY, Oliver WJ, Roncal C, Mu W, Gabriela Sanchez-Lozada L, Rodriguez-Iturbe B, Nakagawa T, Benner SA. Lessons from comparative physiology: could uric acid represent a physiologic alarm signal gone awry in western society? J Comp Physiol B. 2009; 179:67–76.
9. Small ST, Tisch DJ, Zimmerman PA. Molecular epidemiology, phylogeny and evolution of the filarial nematode Wuchereria bancrofti. Infect Genet Evol. 2014; 28C:33–43.
10. Jaaro H, Beck G, Conticello SG, Fainzilber M. Evolving better brains: a need for neurotrophins? Trends Neurosci. 2001; 24:79–85.
11. Wang Z-Y, Fu L-Y, Zhang H-Y. Can medical genetics and evolutionary biology inspire drug target identification? Trends Mol Med. 2012; 18:69–71.
12. Wang W, Zhong J, Wang YQ. Comparative genomic analysis reveals the evolutionary conservation of Pax gene family. Genes Genet Syst. 2010; 85:193–206.
13. Musson MC, Jepeal LI, Sharifnia T, Wolfe MM. Evolutionary conservation of glucose-dependent insulinotropic polypeptide (GIP) gene regulation and the enteroinsular axis. Regul Pept. 2010; 164:97–104.
14. Tindall EA, Hayes VM. Comprehensive sequence analysis of the human IL23A gene defines new variation content and high rate of evolutionary conservation. DNA Res. 2010; 17:117–122.
15. Arango NA, Huang TT, Fujino A, Pieretti-Vanmarcke R, Donahoe PK. Expression analysis and evolutionary conservation of the mouse germ cell-specific D6Mm5e gene. Dev Dyn. 2006; 235:2613–2619.
16. Bennetts JS, Fowles LF, Berkman JL, van Bueren KL, Richman JM, Simpson F, Wicking C. Evolutionary conservation and murine embryonic expression of the gene encoding the SERTA domain-containing protein CDCA4 (HEPP). Gene. 2006; 374:153–165.
17. Ostaszewski M, Eifes S, del Sol A. Evolutionary conservation and network structure characterize genes of phenotypic relevance for mitosis in human. PloS one. 2012; 7:e36488.
18. Tsaparas P, Mariño-Ramírez L, Bodenreider O, Koonin EV, Jordan IK. Global similarity and local divergence in human and mouse gene co-expression networks. BMC Evol Biol. 2006; 6:70.
19. Kukol A, Hughes DJ. Large-scale analysis of influenza A virus nucleoprotein sequence conservation reveals potential drug-target sites. Virology. 2014; 454:40–47.
20. Nakamura H, Minegishi H. HSP60 as a drug target. Curr Pharm Des. 2013; 19:441–451.
21. Shiryaev SA, Strongin AY. Structural and functional parameters of the flaviviral protease: a promising antiviral drug target. Future virology. 2010; 5:593–606.
22. Robinson A, Causer RJ, Dixon NE. Architecture and conservation of the bacterial DNA replication machinery, an underexploited drug target. Curr Drug Targets. 2012; 13:352.
23. Hellebrand EE, Varbiro G. Development of mitochondrial permeability transition inhibitory agents: a novel drug target. Drug discoveries & therapeutics. 2010; 4:54–61.
24. Ludin P, Woodcroft B, Ralph SA, Mäser P. In silico prediction of antimalarial drug target candidates. International Journal for Parasitology: Drugs and Drug Resistance. 2012; 2:191–199.
25. Doyle MA, Gasser RB, Woodcroft BJ, Hall RS, Ralph SA. Drug target prediction and prioritization: using orthology to predict essentiality in parasite genomes. BMC Genomics. 2010; 11:222.
26. Finn RD, Tate J, Mistry J, Coggill PC, Sammut SJ, Hotz HR, Ceric G, Forslund K, Eddy SR, Sonnhammer EL, Bateman A. The Pfam protein families database. Nucleic Acids Res. 2008; 36:D281–288.
27. Hubbard T, Barker D, Birney E, Cameron G, Chen Y, Clark L, Cox T, Cuff J, Curwen V, Down T, Durbin R, Eyras E, Gilbert J, et al. The Ensembl genome database project. Nucleic Acids Res. 2002; 30:38–41.
28. Flicek P, Amode MR, Barrell D, Beal K, Brent S, Carvalho-Silva D, Clapham P, Coates G, Fairley S, Fitzgerald S, Gil L, Gordon L, Hendrix M, et al. Ensembl 2012. Nucleic Acids Res. 2012; 40:D84–90.
29. Flicek P, Amode MR, Barrell D, Beal K, Billis K, Brent S, Carvalho-Silva D, Clapham P, Coates G, Fitzgerald S, Gil L, Giron CG, Gordon L, et al. Ensembl 2014. Nucleic Acids Res. 2014; 42:D749–755.
30. Vilella AJ, Severin J, Ureta-Vidal A, Heng L, Durbin R, Birney E. EnsemblCompara GeneTrees: Complete, duplication-aware phylogenetic trees in vertebrates. Genome Res. 2009; 19:327–335.
31. Zhang J, Haider S, Baran J, Cros A, Guberman JM, Hsu J, Liang Y, Yao L, Kasprzyk A. BioMart: a data federation framework for large collaborative projects. Database (Oxford). 2011; 2011:bar038.
32. Altschul SF, Madden TL, Schaffer AA, Zhang J, Zhang Z, Miller W, Lipman DJ. Gapped BLAST and PSI-BLAST: a new generation of protein database search programs. Nucleic Acids Res. 1997; 25:3389–3402.
33. Goel R, Harsha HC, Pandey A, Prasad TS. Human Protein Reference Database and Human Proteinpedia as resources for phosphoproteome analysis. Mol Biosyst. 2012; 8:453–463.
34. Cahalane DJ, Clancy B, Kingsbury MA, Graf E, Sporns O, Finlay BL. Network structure implied by initial axon outgrowth in rodent cortex: empirical measurement and models. PloS one. 2011; 6:e16113.
35. Shannon P, Markiel A, Ozier O, Baliga NS, Wang JT, Ramage D, Amin N, Schwikowski B, Ideker T. Cytoscape: a software environment for integrated models of biomolecular interaction networks. Genome Res. 2003; 13:2498–2504.