
INTRODUCTION
Lung adenocarcinoma contributes to over 500,000 deaths annually and an average 5-year survival rate of less than 15% despite great advances in cancer therapy [1]. Identifying and characterizing prognostic determinants are essential for aiding in developing better therapeutic strategies to lower its mortality [2]. While clinical and pathological characteristics are considered major determinants in the variability in outcomes of this disease, genetic factors may also contribute [3].
In past decades, molecular biomarkers, especially single nucleotide polymorphisms (SNPs), assessing an individual's genetic predisposition for diseases have shown potential for guiding clinical treatment of lung cancer [4–6]. Recently, increasing evidence suggests that copy number variations (CNVs) may also account for a large proportion of the heritability of lung cancer [7–9].
A CNV is a large structural genetic aberration that consists of duplications or deletions covering more than 1 kb and may result in phenotypic variation through the alteration of biological function or gene expression [10, 11]. Various methods have been developed to detect CNVs at genome-wide and locus-specific levels, including hybridization, polymerase chain reaction (PCR) amplification and fluorescence resonance energy transfer technology (FRET) [12, 13]. Recently, sequencing, especially next generation sequencing technology, has provided us a better tool with which to completely characterize genomic CNVs. Besides, the technology assists in overcoming the hurdle of the unfixed design and imprecise boundaries of these CNVs [14]. Sequencing has presented advance in detection of biomarkers to progression of various cancers. By whole genome sequencing (WGS) or target sequencing, some studies have demonstrated the prognostic prediction role of high copy number alteration burden in the prostate cancer relapse [15], FGFR1 and PIK3CA amplifications in oral cavity squamous cell carcinoma [16], and MYC amplification in pancreatic adenosquamous carcinoma and lung adenocarcinomas [17, 18].
Here, we performed comprehensive WGS to detect CNVs associated with carcinogenesis of lung adenocarcinoma. After the assessment of CNV frequency and screening for potential biological function, the most notable CNVs were detected to find the hallmarks of lung adenocarcinoma prognosis in Chinese patients through survival analysis.
RESULTS
Participant characteristics
Seven male lung adenocarcinoma patients who were smokers and had no family history of cancer were recruited to participate in WGS. At the time of diagnosis, their age ranged from 47 to 64 years with a mean age of 56 years. Four of the 7 had stage II lung adenocarcinoma, while the rest had stage III. Samples from 114 patients with lung adenocarcinoma that had been diagnosed by histology were used to validate the frequencies of top 10 CNVs by quantitative polymerase chain reaction (qPCR). Among these patients, 69 (60.52%) were male, 59 (51.75%) were smokers, 35 (30.70%) were drinkers and 17 (14.91%) had a family history of cancer. Three hundred thirteen patients with lung adenocarcinoma were recruited to determine if there was an association between target CNVs previously identified and disease prognosis. Among the 313 patients, 180 (57.51%) were male, 158 (50.48%) were smokers, 93 (29.71%) were drinkers, 39 (12.46%) had a family history of cancer, 113 (36.10%) died and 153 (48.88%) presented disease progression during the follow-up period (Table 1). 260 of 313 lung adenocarcinoma patients (83.07%) completed the last follow-up assessment or died during the follow up, with a median survival time of 46.36 months. There were no difference of characteristics between patients lost of follow-up and patients with completed follow-up.
Table 1: Characteristics of study population
Discovery set (n = 7)a |
Validation Set I (n = 114)b |
Validation Set II (n = 313)c |
|
|---|---|---|---|
Age at surgery (mean ± SD) |
56.00 ± 5.01 |
58.96 ± 9.35 |
57.68 ± 9.49 |
Sex |
|||
male |
7(100.00%) |
69(60.52%) |
180(57.51%) |
female |
0(0.00%) |
45(39.48%) |
133(42.49%) |
BMI(mean ± SD) |
22.14 ± 4.12 |
22.04 ± 5.78 |
23.17 ± 3.19 |
Smoking Status |
|||
No |
0(0.00%) |
55(48.25%) |
155(49.52%) |
Yes |
7(100.00%) |
59(51.75%) |
158(50.48%) |
Smoking indexd |
|||
≤ 20 |
1(14.29%) |
14(24.56%) |
42(27.10%) |
> 20 |
6(85.71%) |
43(75.44%) |
113(72.90%) |
Alcohol use |
|||
No |
5(71.43%) |
79(69.30%) |
220(70.29%) |
Yes |
2(28.57%) |
35(30.70%) |
93(29.71%) |
TNM stage |
|||
I |
0(0.00%) |
19(17.76%) |
78(24.92%) |
II |
4(57.14%) |
20(18.69%) |
65(20.77%) |
III |
3(42.86%) |
55(51.40%) |
127(40.58%) |
IV |
0(0.00%) |
13(12.15%) |
43(13.74%) |
Family history of cancer |
|||
No |
7(100.00%) |
97(85.09%) |
274(87.54%) |
Yes |
0(0.00%) |
17(14.91%) |
39(12.46%) |
Postoperative chemotherapy |
|||
No |
4(57.14%) |
64(56.14%) |
134(42.81%) |
Yes |
3(42.86%) |
50(43.86%) |
179(57.19%) |
Postoperative radiotherapy |
|||
No |
5(71.43%) |
84(73.68%) |
229(73.16%) |
Yes |
2(28.57%) |
30(26.32%) |
84(26.84%) |
Recurrence |
|||
No |
2(28.57%) |
108(94.74%) |
286(91.37%) |
Yes |
5(71.43%) |
6(5.26%) |
27(8.63%) |
Metastasis |
|||
No |
4(57.14%) |
84(73.68%) |
228(72.84%) |
Yes |
3(42.86%) |
30(26.32%) |
85(27.16%) |
Death |
|||
No |
4(57.14%) |
59(51.75%) |
200(63.90%) |
Yes |
3(42.86%) |
55(48.25%) |
113(36.10%) |
aDiscovery set was used to screen copy number variations correlated with lung adenocarcinoma
bValidation set I was used to verify the frequency of target copy number variations
cValidation set II was used to detect the correlation between target copy number variations and lung adenocarcinoma survival
dSmoking index = cigarette per day × smoking years
Overview of the somatic CNV landscape
WGS was performed on 7 cancerous and noncancerous paired tissues. The number of reads for a genomic region in the tumor compared to adjacent normal tissue was calculated in order to identify CNVs. The mean sequencing coverage was 2.5× with a range of 2.0× to 5.1 × . 1272, 824 and 2756 CNVs were detected by the CNVseq, BICseq and CNVer algorithm, respectively. After matching CNV areas detected by the three algorithms, 2604 somatic CNVs were identified differently expressed between cancerous and noncancerous tissues, among which, 2488 were amplifications and 116 were deletions. There were 4, 6, 25, 65, 132, 310, 650, 1281 and 131 CNVs were detected with total frequency of 11, 10, 9, 8, 7, 6, 5, 4 and 3, respectively. The distribution of CNVs is presented as Circos plots in Figure 1. The locations of these CNVs on chromosomes are listed in Supplementary Table 1. Chr5_262301_297746, chr5_565873_681306, chr5_1607662_1663720, chr19_37756707_37760335, chr5_209198_257662, chr5_482152_508485, chr5_843417_1023251, chr5_1157300_1368500, chr1_154919397_154921901 and chr3_129101148_129103476 were the top 10 most frequently mutant CNVs detected by the three algorithms (Table 2). The top 100 CNVs and mutant driver genes located in these CNVs are listed in Supplementary Table 2.
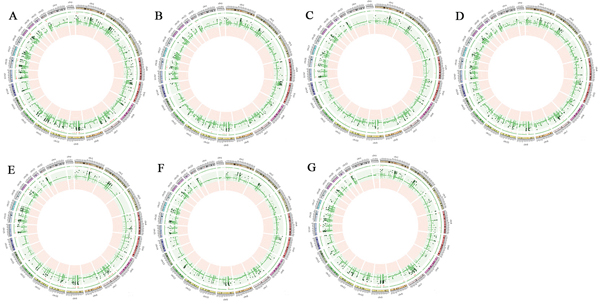
Figure 1: Genomic profiles for comparison between cancerous tissues and paired noncancerous tissues from 7 lung adenocarcinoma patients. Green point indicates increased copy number and red point indicates decreased copy number. The circle starts with chromosome 1 and ends with Y chromosome. Only statistical significant amplification and deletion are shown (Fisher's exact test; FDR < 0.05) for each chromosome. A. T2-P2 B. T4-P4 C. T12-P12 D. T19-P19 E. T25-P25 F. T26-P26 G. T29-P29
Table 2: Genes with most significant copy number variant burdens in 7 lung adenocarcinoma patients
CNV Position |
Gene Symbol |
CNV Statusa |
Total Frequencyb |
Frequency called by BICseq |
Frequncy called by CNVseq |
Frequency called by CNVer |
|---|---|---|---|---|---|---|
chr5_262301_297746 |
PDCD6 |
Amplification |
11 |
5 |
2 |
4 |
chr5_565873_681306 |
CEP72 |
Amplification |
11 |
5 |
2 |
4 |
chr5_565873_681306 |
TPPP |
Amplification |
11 |
5 |
2 |
4 |
chr5_565873_681306 |
FREP1 |
Amplification |
11 |
5 |
2 |
4 |
chr5_1607662_1663720 |
NR_003713 |
Amplification |
11 |
5 |
3 |
3 |
chr19_37756707_37760335 |
NR_029390 |
Amplification |
11 |
4 |
2 |
5 |
chr5_209198_257662 |
SDHA |
Amplification |
10 |
5 |
2 |
3 |
chr5_209198_257662 |
CCDC127 |
Amplification |
10 |
5 |
2 |
3 |
chr5_482152_508485 |
SLC9A3 |
Amplification |
10 |
5 |
3 |
2 |
chr5_843417_1023251 |
NM_001242737 |
Amplification |
10 |
5 |
3 |
2 |
chr5_843417_1023251 |
BRD9 |
Amplification |
10 |
5 |
3 |
2 |
chr5_843417_1023251 |
NKD2 |
Amplification |
10 |
5 |
3 |
2 |
chr5_843417_1023251 |
TRIP13 |
Amplification |
10 |
5 |
3 |
2 |
chr5_1157300_1368500 |
BC032469 |
Amplification |
10 |
5 |
3 |
2 |
chr5_1157300_1368500 |
SLC6A19 |
Amplification |
10 |
5 |
3 |
2 |
chr5_1157300_1368500 |
SLC6A18 |
Amplification |
10 |
5 |
3 |
2 |
chr5_1157300_1368500 |
TERT |
Amplification |
10 |
5 |
3 |
2 |
chr5_1157300_1368500 |
CLPTM1L |
Amplification |
10 |
5 |
3 |
2 |
chr1_154919397_154921901 |
PBXIP1 |
Amplification |
10 |
4 |
4 |
2 |
chr3_129101148_129103476 |
NR_003111 |
Amplification |
10 |
3 |
2 |
5 |
aCNV status represents the comparison between cancerous and paired noncarcerous tisses
bTotal Frequency represents the sum of CNV frequency detected by three algorithms (BICseq, CNVseq and CNVer)
Target genotyping of CNVs most frequently detected by qPCR
The biological functions of the single genes located in chr3_129101148_129103476, chr5_1607662_1663720 and chr19_37756707_37760335 are undefined, therefore, only the remaining 7 CNVs of interest were followed-up on. Totally, there were 17 pairs of primers were successfully designed to amplify the 7 CNVs. However, only 12 primers targeting 12 genes presented optimal amplification, which included PBXIP1, SDHA, PDCD6, SLC9A3, CEP72, TPPP, BRD9, TRIP13, LOC100506688, SLC6A19, SLC6A18 and TERT. Detailed information on the primers used for the 12 genes is presented in Supplementary Table 3. The rates of amplification of PBXIP1, SDHA, PDCD6, SLC9A3, CEP72, TPPP, BRD9, TRIP13, LOC100506688, SLC6A19, SLC6A18 and TERT were 38.68%, 61.61%, 68.18%, 25.44%, 60.98%, 9.65%, 16.38%, 23.68%, 40.35%, 23.48%, 7.89% and 83.78%, respectively (Table 3).
Table 3: Frequencies of candidate CNVs in the validation set I by qPCR
Position |
Gene Symbol |
Frequencya |
|
|---|---|---|---|
Amplification |
Nonamplification |
||
chr1_154919397_154921901 |
PBXIP1 |
41 (38.68%) |
65 (61.32%) |
chr5_209198_257662 |
SDHA |
69 (61.61%) |
43 (38.39%) |
chr5_262301_297746 |
PDCD6 |
75 (68.18%) |
35 (21.82%) |
chr5_482152_508485 |
SLC9A3 |
29 (25.44%) |
85 (74.56%) |
chr5_565873_681306 |
CEP72 |
75 (60.98%) |
48 (39.02%) |
TPPP |
11 (9.65%) |
103 (90.35%) |
|
chr5_843417_023251 |
BRD9 |
19 (16.38%) |
97 (83.62%) |
TRIP13 |
27 (23.68%) |
87 (76.32%) |
|
LOC100506688 |
46 (40.35%) |
68 (59.65%) |
|
chr5_1157300 _1368500 |
SLC6A19 |
27 (23.48%) |
88 (76.52%) |
SLC6A18 |
9 (7.89%) |
105 (92.11%) |
|
TERT |
93 (83.78%) |
18 (16.22%) |
|
aPatients with different copy numbers were divided into the two groups of amplification and nonamplification, which were distinguished by a cut-off point of 2−ΔΔCt as 1.3.
CNVs associated with lung adenocarcinoma patient prognosis
CNVs with low amplification (TPPP and SLC6A18) and undefined biological function (LOC100506688) were excluded from further studies on the associations between target CNVs and lung adenocarcinoma prognosis.
From the Cox proportional hazards analysis, significant associations between clinical stage and overall survival and progression free survival were found (Supplementary Table 4). Compared with stage I lung adenocarcinoma patients, stage II, III and IV patients had a 1.79, 4.93 and 6.11-fold increased risk of death, respectively. The corresponding HRs of progression free survival were 1.98, 4.42 and 3.96, respectively (Figure 2A–2B and Supplementary Table 4).
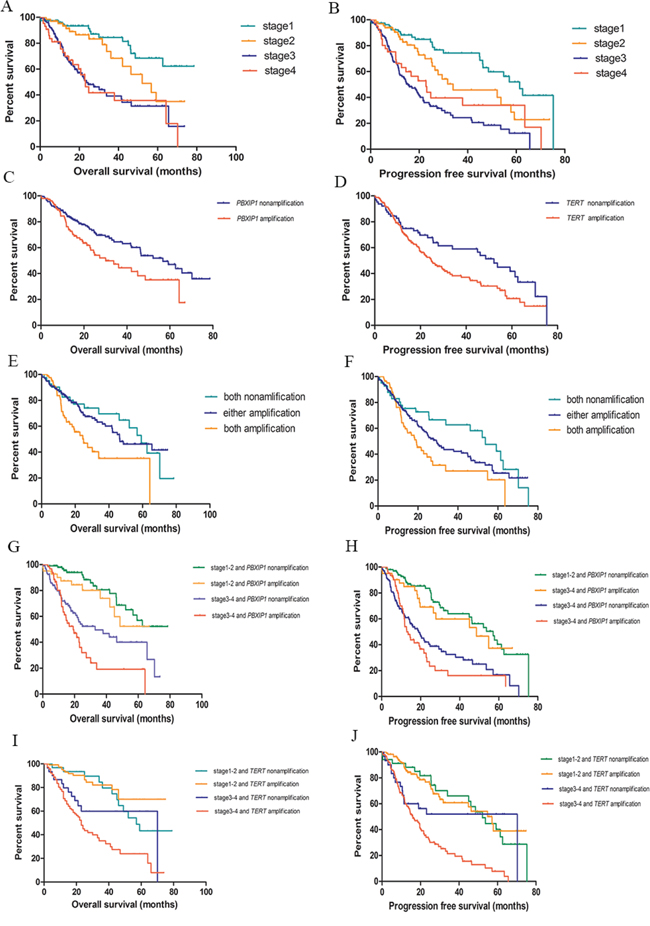
Figure 2: Kaplan-Meier survival curves for survival of lung adenocarcinoma. A. TNM stage and overall survival; B. TNM stage and progression free survival; C. PBXIP1 copy number variations and overall survival of lung adenocarcinoma; D. TERT copy number variations and progression free survival of lung adenocarcinoma; E. Combination of PBXIP1 and TERT copy number variations in overall survival of lung adenocarcinoma; F. Combination of PBXIP1 and TERT copy number variations in progression free survival of lung adenocarcinoma; G. Combination of clinical stage and PBXIP1 copy number variations in overall survival of lung adenocarcinoma; H. Combination of clinical stage and PBXIP1 copy number variations in progression free survival of lung adenocarcinoma; I. Combination of clinical stage and TERT copy number variations in overall survival of lung adenocarcinoma; J. Combination of clinical stage and TERT copy number variations in progression free survival of lung adenocarcinoma;
Among 9 genes from the 7 CNV areas of interest, PBXIP1 was significantly associated with overall survival. Compared with the PBXIP1 amplified copy number, unamplified carriers had a 0.62-fold (95%CI = 0.43–0.91) decreased risk of death with a prolonged median survival time of 26.63 months. This association remained after adjusting for age, sex, cigarette use, and clinical stage with an HR of 0.58 (95% CI = 0.39–0.86). The 5-year overall survival rate of patients with an unamplified PBXIP1 was 47.0% (95% CI: 33.3%–56.7%) compared with 35.1% (95% CI: 21.7%–48.8%) in patients with an amplified PBXIP1 (Table 4 and Figure 2C). Further analysis found that CNV of TERT was correlated with progression free survival of lung adenocarcinoma. Compared with an amplified TERT, those with an unamplified TERT had a 35% reduction (95% CI = 3%–56%) in risk of disease progression. A similar effect was seen after adjusting for age, sex, cigarette use, and clinical staging with an HR of 0.67 (95% CI = 0.45–0.99). In comparison to the amplified variant, the unamplified TERT was associated with a median delay in disease progression of 23.77 months. The 3-year progression free survival rate of patients with an unamplified TERT was 59.0% (95% CI: 45.0%–70.7%) compared to 38.0% (95% CI: 30.0%–45.9%) of those with an amplified TERT (Table 4 and Figure 2D).
Table 4: The relationship between copy number variations and prognosis of lung adenocarcinoma
Overall survivala (N = 313) |
Progression free survivalb (N = 313) |
|||
|---|---|---|---|---|
Crude HR(95%CI) |
Adjusted HRc(95%CI) |
Crude HR(95%CI) |
Adjusted HRc(95%CI) |
|
PBXIP1 |
||||
amplification |
1.00 |
1.00 |
1.00 |
1.00 |
nonamplification |
0.62(0.43–0.91) |
0.58(0.39–0.86) |
0.80(0.58–1.11) |
0.81(0.58–1.13) |
TERT |
||||
amplification |
1.00 |
1.00 |
1.00 |
1.00 |
nonamplification |
0.81(0.52–1.25) |
0.85(0.54–1.32) |
0.65(0.44–0.97) |
0.67(0.45–0.99) |
CEP72 |
||||
amplification |
1.00 |
1.00 |
1.00 |
1.00 |
nonamplification |
0.78(0.53–1.15) |
0.88(0.60–1.31) |
0.90(0.64–1.25) |
1.03(0.73–1.44) |
BRD9 |
||||
amplification |
1.00 |
1.00 |
1.00 |
1.00 |
nonamplification |
1.00(0.62–1.62) |
1.35(0.82–2.23) |
1.20(0.78–1.85) |
1.49(0.95–2.33) |
TRIP13 |
||||
amplification |
1.00 |
1.00 |
1.00 |
1.00 |
nonamplification |
0.87(0.55–1.38) |
1.09(0.68–1.74) |
0.99(0.65–1.49) |
1.19(0.78–1.81) |
SLC9A3 |
||||
amplification |
1.00 |
1.00 |
1.00 |
1.00 |
nonamplification |
1.12(0.66–1.91) |
1.07(0.63–1.83 |
0.88(0.59–1.33) |
0.84(0.55–1.27) |
SDHA |
||||
amplification |
1.00 |
1.00 |
1.00 |
1.00 |
nonamplification |
1.15(0.78–1.69) |
1.18(0.79–1.75) |
0.99(0.71–1.36) |
0.95(0.68–1.32) |
SLC6A19 |
||||
amplification |
1.00 |
1.00 |
1.00 |
1.00 |
nonamplification |
0.83(0.55–1.25) |
0.93(0.61–1.42) |
0.95(0.66–1.37) |
0.99(0.69–1.44) |
PDCD6 |
||||
amplification |
1.00 |
1.00 |
1.00 |
1.00 |
nonamplification |
1.13(0.77–1.66) |
1.14(0.77–1.68) |
0.83(0.60–1.15) |
0.82(0.59–1.15) |
aOverall survival was calculated by subtracting the date when the patient was first treated from the date of death, and patients were censored when lost of follow-up.
bProgression free survival was calculated by subtracting the date of first treatment from the date of recurrence of, metastasis of or death from lung adenocarcinoma.
cAdjustment: age, gender, smoking status and TNM stage.
In addition, the combined effect of the CNVs of PBXIP1 and TERT on lung adenocarcinoma prognosis was assessed. Patients with no amplifications in either gene had a 34.32-month longer median survival time with an HR of 0.51(95% CI = 0.28–0.93) compared with those with both genes amplified. Similarly, cases with both unamplified genes had a 34.55-month delay in disease progression compared with patients with amplifications in both genes (HR = 0.55, 95% CI = 0.32–0.94). Even patients with only one nonamplification had a 11.63-month longer overall survival compared with those with both amplifications (HR = 0.54, 95% CI = 0.35–0.84) (Table 5 and Figure 2E–2F).
Table 5: The interactions between copy number variations and TNM stage on the prognosis of lung adenocarcinoma
Overall survivala (N = 313) |
Progression free survival b(N = 313) |
|||
|---|---|---|---|---|
Crude HR(95%CI) |
Adjusted HR(95%CI) |
Crude HR(95%CI) |
Adjusted HR(95%CI) |
|
PBXIP1 and TERT |
||||
both amplification |
1.00 |
1.00 |
1.00 |
1.00 |
either amplification |
0.53(0.35–0.81) |
0.54(0.35–0.84)c |
0.72(0.50–1.03) |
0.76(0.52–1.10)c |
both nonamplification |
0.52(0.29–0.94) |
0.51(0.28–0.93)c |
0.52(0.31–0.89) |
0.55(0.32–0.94)c |
Stage and PBXIP1 |
||||
stage 3–4 and amplification |
1.00 |
1.00 |
1.00 |
1.00 |
stage 3–4 and nonamplification |
0.64(0.41–1.00) |
0.59(0.37–0.93)d |
0.89(0.60–1.31) |
0.85(0.57–1.27)d |
stage 1–2 and amplification |
0.28(0.14–0.55) |
0.26(0.13–0.53)d |
0.37(0.21–0.66) |
0.36(0.20–0.66)d |
stage 1–2 and nonamplification |
0.18(0.10–0.33) |
0.15(0.08–0.28)d |
0.29(0.18–0.47) |
0.27(0.17–0.44)d |
Stage and TERT |
||||
stage 3–4 and amplification |
1.00 |
1.00 |
1.00 |
1.00 |
stage 3–4 and nonamplification |
0.53(0.28–0.98) |
0.50(0.27–0.94)d |
0.48(0.28–0.84) |
0.46(0.26–0.80)d |
stage 1–2 and amplification |
0.19(0.11–0.33) |
0.18(0.10–0.32)d |
0.28(0.19–0.43) |
0.28(0.19–0.42)d |
stage 1–2 and nonamplification |
0.38(0.21–0.68) |
0.35(0.19–0.62)d |
0.32(0.19–0.53) |
0.30(0.18–0.52)d |
aOverall survival was calculated by subtracting the date when the patient was first treated from the date of death, and patients were censored when lost of follow-up.
bProgression free survival was calculated by subtracting the date of first treatment from the date of recurrence of, metastasis of or death from lung adenocarcinoma.
cAdjustment: age, gender, smoking status and TNM stage.
dAdjustment: age, gender and smoking status.
We also explored the effect of the two genes in CNVs and clinical stage on lung adenocarcinoma prognosis. Compared with stage III-IV patients with an amplified PBXIP1, stage I-II patients with an unamplified PXBIP1 had an 85% lower risk of death (95% CI = 72%–92%) and a 73% lower risk of progression (95% CI = 56%–83%). Similarly, stage I-II patients with an unamplified TERT had a 65% lower risk (95% CI = 38%–81%) of death than stage III-IV patients with an amplified TERT and a 70% lower risk (95% CI = 48%-82%) of disease progression (Table 5 and Figure 2G–2J).
The genes CEP72, BRD9, TRIP13, SLC9A3, SDHA, SLC6A19 and PDCD6 did not have any predictive role in lung adenocarcinoma prognosis (Table 4). There was no association between the 9 mutant driver genes and the prognosis of patients with lung squamous cell carcinoma (Supplementary Table 5), which supports the concept that lung adenocarcinoma and lung squamous cell carcinoma are genetically heterogeneous cancer types.
CNVs and expression of PBXIP1 and TERT based on TCGA
From The Cancer Genome Atlas (TCGA) database, whole genome copy number variations of 511 lung adenocarcinoma and whole gene expressions of 512 lung adenocarcinoma were downloaded. Based on the data from TCGA, the amplification rates of PBXIP1 and TERT were 58.8% and 64.1%. Along with an increased copy number, expression of PBXIP1 and TERT mRNA increased significantly. The median gene expressions for unamplified and amplified PBXIP1 were 3448.71 and 4764.52, respectively (P < 0.001). Similarly, the median gene expressions for unamplified and amplified TERT were 3.77 and 5.16, respectively (P = 0.041). (Figure 3)
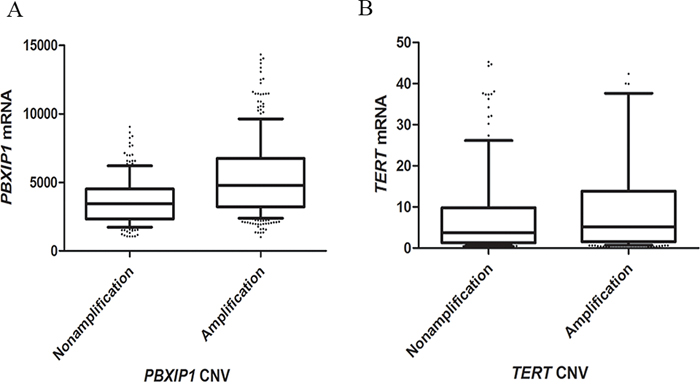
Figure 3: Box plot of gene expression according to copy number variants of PBXIP1. A. and TERT B. Upper horizontal line of box, 75th percentile; lower horizontal line of box, 25th percentile; horizontal bar within box, median; upper horizontal bar outside box, 90th percentile; lower horizontal bar outside box, 10th percentile. The median gene expressions for the unamplified and amplified PBXIP1, and unamplified and amplified TERT were 3448.71, 4764.52, 3.77 and 5.16 for, respectively.
DISCUSSION
To our knowledge, this is the first study on the association between CNVs and the prognosis of lung adenocarcinoma in Chinese patients using WGS. Overall, we found a gain in the short arm of chromosome 5 (5p) correlated with lung adenocarcinoma carcinogenesis. Also, the CNVs of PBXIP1 and TERT presented significant upregulation of corresponding gene expressions and were found to be independently predictive of lung adenocarcinoma patient survival. Furthermore, these two structural mutations strengthen the clinical role of stage in disease prognosis.
Deep sequencing is a well-known technology that has resulted in the most comprehensive collection of biomarkers for various diseases, including cancers [19]. The development of sequencing technologies has opened the door to novel methods for detecting genetic mutations using low-coverage sequencing. Recent published studies have demonstrated the comparability of low-coverage sequencing to deep sequencing for detecting large structural mutations, especially for mutations larger than 20 kb [20]. Additionally, three CNV calling algorithms, CNVseq, CNVer and BICseq, were incorporated into the analysis to improve upon statistical power. CNVseq and BICseq captured many more CNVs than CNVer, and BICseq had a higher detection rate than CNVseq for the same CNVs. Assessment of CNVs using three algorithms may reduce the false positives and negatives normally obtained when using a single algorithm.
In this study, a significant role for the short arm of chromosome 5 (5p) was found in carcinogenesis. Previous molecular cytogenetic studies have shown that chromosomal aberrations occur on 5p in all major lung tumor types [21–25]. Besides a role in carcinogenesis, aberrations in 5p are also biomarkers for cancer prognosis. A genome-wide analysis revealed that copy number gains in chromosome 5p were correlated with to the survival of early-stage non-small cell lung cancer [26]. Sarit et al. even presented direct evidence for this with the finding that amplification of genes in chromosome 5p may be responsible for the malignant progression of bronchioloalveolar carcinoma, which is a subtype of lung adenocarcinoma [27].
Telomerase is an enzyme consisting of a reverse transcriptase called telomerase reverse transcriptase (TERT) and an RNA component that adds repeats of a DNA sequence (TTAGGG) to the ends of chromosomes in order to prevent shortening. Telomerase activity is high in embryonic and stem cells but nearly undetectable in most somatic cells, due primarily to transcriptional downregulation of TERT. However, recent identification of highly recurrent point mutations in the TERT promoter in multiple cancer types suggests one potential mechanism for up-regulation of telomerase via reactivation of TERT [21, 28]. The importance of TERT reactivation in cellular immortalization and carcinogenesis is supported by its expression in more than 90% of immortal cell lines and tumors. The gain of TERT is the most frequent amplification event occurring in early stage cancers [29]. A recently published whole genome study directly supports our finding by demonstrating amplification of TERT in lung adenocarcinoma [27]. Additionally, overexpression of TERT is a biomarker for the progression of and poor outcomes from lung cancer [30–33].
Pre-B-cell leukemia homeobox (PBX) interacting protein 1 (PBXIP1) is a scaffolding protein of the PBX-family interacting microtubule-binding protein. It promotes cell migration which is necessary for cancer cell proliferation, migration and invasion through activation of the PI3K/AKT/mTOR and Raf/MEK/ERK pathways [34]. Little direct evidence has been published for the carcinogenic role of PBXIP1 in lung adenocarcinoma. However, a recent study indicated that the gene was overexpressed in breast infiltrative ductal carcinoma, as well as promoted cell adhesion and migration through modulation of focal adhesion dynamics. Similar overexpression of PBXIP1 was also found in high-grade glioma and ependymoma [35], oral squamous cell carcinoma [36] and liver cancer [37]. Moreover, an amplified copy number of PBXIP1 was found to be predictive of poor outcomes in undifferentiated pleomorphic sarcomas and leiomyosarcomas [38]. Overall, the above evidence supports plausibly role for PBXIP1 in promoting lung adenocarcinoma.
We acknowledge several limitations to our study. First, the modest sample size of the WGS may not have had optimal statistical power to identify and validate some well-known lung cancer-related genes, such as TP53, EGRF, KRAS and BRAF. In our study, these genes were captured by the low-coverage sequencing with relative low frequencies of 19.0%, 28.6%, 28.6% and 9.5%, which was not significant enough to follow-up on in further association studies. Second, given the small sample size in WGS, we picked up 7 typical lung adenocarcinoma patients with similar histology to scan potential somatic copy number variations associated with the disease. Further validation of the positive findings was conducted in general lung adenocarcinoma patients to ensure the good extrapolation of final results. Since the characteristics of the discovery set and validation sets were not consistent especially in gender and smoking status, CNVs contributing to female or non-smoking lung adenocarcinoma may be underestimated. Third, although three copy number calling algorithms were used during analysis, low-coverage sequencing is not as sensitive and specific as deep-sequencing at detecting small structural mutations. This may explain why most of the target CNVs detected were larger than 20 kb. Fourth, we only selected top 7 frequently detected CNVs in the discovery set for further validation. The selection may omit some important CNVs with lower mutation frequency.
In conclusion, this study advances the complete characterization of the genomic CNVs in lung adenocarcinoma in Chinese patients and expands our understanding of tumor biology. Furthermore, a prognostic significance for the CNVs of TERT and PBXIP1 in lung adenocarcinoma was found, which may lead to translation into the clinic and improve outcomes for patients with this fatal disease.
MATERIALS AND METHODS
Ethics statement
This study protocol was reviewed and approved by the Institutional Review Board of Huazhong University of Science and Technology. All patients in this study gave written informed consent. This study was carried out in accordance with the recommendations of the Declaration of Helsinki for biomedical research involving human subjects.
Study population
This study included three populations (discovery set, validation set I and validation set II). Discovery set was used to scan the differently expressed copy number variations between cancerous and paired noncancerous tissues by WGS. Validation set I was used to verify the frequency of top CNVs found in the discovery set. Validation set II was applied to detect the correlation between mutant driver genes from target CNVs with prognosis of lung adenocarcinoma. The population of discovery set and validation sets were from the same library of lung adenocarcinoma patients, but recruited in different stages. The participants of discovery set and validation set I were recruited from Tongji Hospital, Wuhan, China in 2007. The participants of validation set II were recruited from the same hospital since 2008 up to 2013. Follow-up was conducted by researchers since three months later after surgical resection of the tumor from April 2008 to December 2014. Patients with indefinable histological type or lost of follow-up at the first time were excluded from this study. Totally, 434 lung adenocarcinoma patients were recruited. Besides, 303 lung squamous cell carcinoma patients were identified from 2008 to 2013. Questionnaires were used to collect information on patient demographics and lifestyles, including concerning age, gender, cigarette use, alcohol use, family history of cancer, and body mass index (BMI). Participants who had smoked ≥100 cigarettes in their lifetime were defined as “ever smokers”, while those who had smoked fewer were classified as “never smokers”. Similarly, participants who consumed alcoholic beverages at least once a week for ≥1 year were defined as “ever drinkers”, while the remaining cases were “never drinkers”. Patients with any first and/or second-degree relative(s) with a history of cancer were defined as “with a family history of cancer”, while the remaining subjects were “without a family history of cancer”. Patient's clinical data were obtained from medical records. Tumors were staged according to the Union for International Cancer Control (UICC) tumor-node-metastasis (TNM) staging system. The primary endpoint of follow-up was overall survival and the secondary outcome was progression free survival. Overall survival was calculated by subtracting the date when the patient was first treated from the date of death, and patients were censored when lost of follow-up. Progression free survival was calculated by subtracting the date of first treatment from the date of recurrence of, metastasis of or death from lung adenocarcinoma. Patients were censored if death was due to other causes or the annual follow-up was unsuccessful.
Detection of CNVs by WGS
Paired cancerous and noncancerous tissues from 7 typical lung adenocarcinoma patients with similar histology types recruited in 2007 were enrolled into WGS. Using haematoxylin and eosin (H&E) staining, cancerous tissues were identified as areas made up of more than 80% tumor cells, while noncancerous tissues were defined as areas lacking tumor cells. DNA extraction was then performed using the TIANGEN DNA kit (TIANGEN BIOTECH, Beijing, China) according to the manufacturer's instructions. Sequence capture, enrichment and elution from 14 genomic DNA (gDNA) samples were performed by IntegraGen using Agilent in-solution enrichment (SureSelect Human All Exon Kit v2) with the provided biotinylated oligonucleotide probe library (Human All Exon v2–46 Mb). Briefly, 3 μg of each gDNA sample were sonicated and purified to yield fragments of 150–200 bp. Adaptor oligonucleotides were ligated onto A-tailed fragments and enriched for using 4–6 PCR cycles. The purified libraries, 500ng/library, were hybridized to the SureSelect library for 24 h. Then the eluted fraction was PCR amplified for 10–12 cycles and sequenced on an Illumina HiSeq2000 sequencer as paired-end 75-bp reads [39]. Image analysis and base calling were performed using the Illumina Real Time Analysis (RTA) Pipeline version 1.9 with default parameters. Initial analysis of WGS was based on the Illumina pipeline (CASAVA1.7) against the reference genome of hg19. Because none of the algorithms were optimal for the detection of CNV and to improve the power and compensate for the disadvantage of using a single algorithm, three algorithms, CNVseq [40], CNVer [41] and BICseq [42], were used to identify CNVs in each tumor against the matched noncancerous tissues. The packages used for CNVseq, CNVer and BICseq were CNV-seq, BIC-seq2.1.1 and CNVer-0.81, respectively. CNVs called by each algorithm were produced with the corresponding frequency among 7 patients and then matched with each other to find the common parts. The total frequency of each common CNV was summed from the frequencies called by three algorithms. Then CNVs were ranked according to their total frequency. Circos plots were generated for each patient to summarize the results from the CNV analyses [43].
Detection of CNVs by qPCR
To verify the findings from WGS, the frequency of the top CNVs in cancerous tissues from 114 lung adenocarcinoma patients was measured by qPCR. After excluding target genes that had only low levels of amplification or an undefined biological function, verified CNVs were further analyzed for an association with survival in 313 lung adenocarcinomas. To explore whether predictive biomarkers for survival of lung adenocarcinoma may also be applicable to lung squamous cell carcinoma, target CNVs were also measured in 303 lung squamous cell carcinomas by qPCR. Primer Premier 5.0 was used to design primers for each CNV. At least one optimal primer was picked for each target CNV. The primer performance was confirmed to have an r2 > 0.99 and an amplification efficiency of 90%–110%. The qPCR reaction was performed in a total of 20 ul containing 10 μl SYBR Green I Master mix (Toyobo, China), 0.8 mM primers and approximately 50 ng of template DNA. The housekeeping gene β-glubin was used as an internal control for normalization. The pooled DNA from peripheral blood lymphocytes from 100 healthy subjects was used as the standard. PCR reactions for each sample were performed in triplicate using a StepOnePlus Real-time PCR System (Applied Biosystem). The raw data were analyzed using StepOne™ Software v2.1. Amplification levels were calculated using the 2−ΔΔCt method, where ΔΔCt for a target gene was defined as (ΔCt of lung cancer sample −ΔCt of standard) and ΔCt was the difference in threshold cycles for the sample in question normalized against the reference gene of β-glubin. Patients with different copy numbers were divided into the two groups of nonamplification and amplification, which were distinguished by a cut-off point of 1.3.
CNV and gene expression data from TCGA
To verify the role of CNVs in gene expressions, whole genome copy number alterations (Affymetrix SNP 6.0 SNP array) and mRNA expressions (RNA seq V2 RSEM) of lung adenocarcinoma were downloaded from The Cancer Genome Atlas Project (TCGA) (https://tcga-data.nci.nih.gov/tcga/tcgaHome2.jsp). According to the recommended cut off point, we divided the segment ratio into CNV as follow rule: unamplification was called if the probe log-ratio ≤ 0.18, otherwise, amplification was called as usual recommended.
Statistical analysis
The Kaplan-Meier curve and log-rank test were used to estimate the differences in overall survival and progression free survival based on individual CNV. The single effect of CNV and combination effects of CNVs and clinical stage on lung adenocarcinoma prognosis were evaluated by Cox proportional hazards model. Furthermore, the Wilcoxon signed-ranks test was used to analyze the association between target CNVs and their gene expression based on data from TCGA. All tests were two sided and with a P < 0.05 was considered significant. All statistical analyses were performed using SAS (version 9.4; SAS Institute, Cary, NC).
ACKNOWLEDGMENTS AND FUNDING
This work is supported by grant from the National Natural Science Foundation of China (Grant No. 81172754, No. 81302491) and the Fundamental Research Funds for the Central Universities, HUST (Grant No. 2011QN203, No. 2013QN001).
CONFLICTS OF INTEREST
The authors declare no conflict of interest.
REFERENCES
1. Parkin DM, Bray F, Ferlay J, Pisani P. Global cancer statistics, 2002. CA Cancer J Clin. 2005; 55:74–108.
2. Molina JR, Yang P, Cassivi SD, Schild SE, Adjei AA. Non-small cell lung cancer: epidemiology, risk factors, treatment, and survivorship. Mayo Clin Proc. 2008; 83:584–594.
3. Hu Z, Chen J, Tian T, Zhou X, Gu H, Xu L, Zeng Y, Miao R, Jin G, Ma H, Chen Y, Shen H. Genetic variants of miRNA sequences and non-small cell lung cancer survival. Journal of Clinical Investigation. 2008; 118:2600–2608.
4. Chen G, Kim SH, King AN, Zhao L, Simpson RU, Christensen PJ, Wang Z, Thomas DG, Giordano TJ, Lin L, Brenner DE, Beer DG, Ramnath N. CYP24A1 is an independent prognostic marker of survival in patients with lung adenocarcinoma. Clin Cancer Res. 2011; 17:817–826.
5. Galvan A, Colombo F, Frullanti E, Dassano A, Noci S, Wang Y, Eisen T, Matakidou A, Tomasello L, Vezzalini M, Sorio C, Dugo M, Ambrogi F, et al. Germline polymorphisms and survival of lung adenocarcinoma patients: a genome-wide study in two European patient series. Int J Cancer. 2015; 136:E262–271.
6. Han JY, Yoon KA, Park JH, Lee YJ, Lee GK, Han JH, Yoon SJ, Yun T, Kim HT, Lee JS. DNA repair gene polymorphisms and benefit from gefitinib in never-smokers with lung adenocarcinoma. Cancer. 2011; 117:3201–3208.
7. Cappuzzo F, Varella-Garcia M, Shigematsu H, Domenichini I, Bartolini S, Ceresoli GL, Rossi E, Ludovini V, Gregorc V, Toschi L, Franklin WA, Crino L, Gazdar AF, et al. Increased HER2 gene copy number is associated with response to gefitinib therapy in epidermal growth factor receptor-positive non-small-cell lung cancer patients. J Clin Oncol. 2005; 23:5007–5018.
8. Hirsch FR, Varella-Garcia M, Bunn PA Jr., Di Maria MV, Veve R, Bremmes RM, Baron AE, Zeng C, Franklin WA. Epidermal growth factor receptor in non-small-cell lung carcinomas: correlation between gene copy number and protein expression and impact on prognosis. J Clin Oncol. 2003; 21:3798–3807.
9. Hirsch FR, Herbst RS, Olsen C, Chansky K, Crowley J, Kelly K, Franklin WA, Bunn PA Jr., Varella-Garcia M, Gandara DR. Increased EGFR gene copy number detected by fluorescent in situ hybridization predicts outcome in non-small-cell lung cancer patients treated with cetuximab and chemotherapy. J Clin Oncol. 2008; 26:3351–3357.
10. Stranger BE, Forrest MS, Dunning M, Ingle CE, Beazley C, Thorne N, Redon R, Bird CP, de Grassi A, Lee C, Tyler-Smith C, Carter N, Scherer SW, et al. Relative impact of nucleotide and copy number variation on gene expression phenotypes. Science. 2007; 315:848–853.
11. Ionita-Laza I, Rogers AJ, Lange C, Raby BA, Lee C. Genetic association analysis of copy-number variation (CNV) in human disease pathogenesis. Genomics. 2009; 93:22–26.
12. Dhawan D, Padh H. Pharmacogenetics: technologies to detect copy number variations. Curr Opin Mol Ther. 2009; 11:670–680.
13. Lee JH, Jeon JT. Methods to detect and analyze copy number variations at the genome-wide and locus-specific levels. Cytogenet Genome Res. 2008; 123:333–342.
14. Hanahan D, Weinberg RA. Hallmarks of cancer: the next generation. Cell. 2011; 144:646–674.
15. Hieronymus H, Schultz N, Gopalan A, Carver BS, Chang MT, Xiao Y, Heguy A, Huberman K, Bernstein M, Assel M, Murali R, Vickers A, Scardino PT, et al. Copy number alteration burden predicts prostate cancer relapse. Proc Natl Acad Sci U S A. 2014; 111:11139–11144.
16. Peng CH, Liao CT, Ng KP, Tai AS, Peng SC, Yeh JP, Chen SJ, Tsao KC, Yen TC, Hsieh WP. Somatic copy number alterations detected by ultra-deep targeted sequencing predict prognosis in oral cavity squamous cell carcinoma. Oncotarget. 2015; 6:19891–19906.
17. Witkiewicz AK, McMillan EA, Balaji U, Baek G, Lin WC, Mansour J, Mollaee M, Wagner KU, Koduru P, Yopp A, Choti MA, Yeo CJ, McCue P, et al. Whole-exome sequencing of pancreatic cancer defines genetic diversity and therapeutic targets. Nat Commun. 2015; 6:6744.
18. Seo AN, Yang JM, Kim H, Jheon S, Kim K, Lee CT, Jin Y, Yun S, Chung JH, Paik JH. Clinicopathologic and prognostic significance of c-MYC copy number gain in lung adenocarcinomas. Br J Cancer. 2014; 110:2688–2699.
19. Meyerson M, Gabriel S, Getz G. Advances in understanding cancer genomes through second-generation sequencing. Nat Rev Genet. 2010; 11:685–696.
20. Xie C, Tammi MT. CNV-seq, a new method to detect copy number variation using high-throughput sequencing. BMC Bioinformatics. 2009; 10:80.
21. Horn S, Figl A, Rachakonda PS, Fischer C, Sucker A, Gast A, Kadel S, Moll I, Nagore E, Hemminki K, Schadendorf D, Kumar R. TERT promoter mutations in familial and sporadic melanoma. Science. 2013; 339:959–961.
22. Garnis C, Davies JJ, Buys TP, Tsao MS, MacAulay C, Lam S, Lam WL. Chromosome 5p aberrations are early events in lung cancer: implication of glial cell line-derived neurotrophic factor in disease progression. Oncogene. 2005; 24:4806–4812.
23. Kang JU, Koo SH, Kwon KC, Park JW, Shin SY, Kim JM, Jung SS. High frequency of genetic alterations in non-small cell lung cancer detected by multi-target fluorescence in situ hybridization. J Korean Med Sci. 2007; :S47–51.
24. Shen H, Gao W, Wu YJ, Qiu HR, Shu YQ. Multicolor fluorescence in situ hybridization and comparative genomic hybridization reveal molecular events in lung adenocarcinomas and squamous cell lung carcinomas. Biomed Pharmacother. 2009; 63:396–403.
25. Iwakawa R, Kohno T, Kato M, Shiraishi K, Tsuta K, Noguchi M, Ogawa S, Yokota J. MYC amplification as a prognostic marker of early-stage lung adenocarcinoma identified by whole genome copy number analysis. Clin Cancer Res. 2011; 17:1481–1489.
26. Huang YT, Heist RS, Chirieac LR, Lin X, Skaug V, Zienolddiny S, Haugen A, Wu MC, Wang Z, Su L, Asomaning K, Christiani DC. Genome-wide analysis of survival in early-stage non-small-cell lung cancer. J Clin Oncol. 2009; 27:2660–2667.
27. Aviel-Ronen S, Coe BP, Lau SK, da Cunha Santos G, Zhu CQ, Strumpf D, Jurisica I, Lam WL, Tsao MS. Genomic markers for malignant progression in pulmonary adenocarcinoma with bronchioloalveolar features. Proc Natl Acad Sci U S A. 2008; 105:10155–10160.
28. Huang FW, Hodis E, Xu MJ, Kryukov GV, Chin L, Garraway LA. Highly recurrent TERT promoter mutations in human melanoma. Science. 2013; 339:957–959.
29. Eldholm V, Haugen A, Zienolddiny S. CTCF mediates the TERT enhancer-promoter interactions in lung cancer cells: identification of a novel enhancer region involved in the regulation of TERT gene. Int J Cancer. 2014; 134:2305–2313.
30. Lantuejoul S, Soria JC, Moro-Sibilot D, Morat L, Veyrenc S, Lorimier P, Brichon PY, Sabatier L, Brambilla C, Brambilla E. Differential expression of telomerase reverse transcriptase (hTERT) in lung tumours. Br J Cancer. 2004; 90:1222–1229.
31. Wang L, Soria JC, Kemp BL, Liu DD, Mao L, Khuri FR. hTERT expression is a prognostic factor of survival in patients with stage I non-small cell lung cancer. Clin Cancer Res. 2002; 8:2883–2889.
32. Azad AK, Qiu X, Boyd K, Kuang Q, Emami M, Perera N, Palepu P, Patel D, Chen Z, Cheng D, Feld R, Leighl NB, Shepherd FA, et al. A genetic sequence variant (GSV) at susceptibility loci of 5p15.33 (TERT-CLPTM1L) is associated with survival outcome in locally advanced and metastatic non-small-cell lung cancer (NSCLC). Lung Cancer. 2014; 84:289–294.
33. Bugide S, David D, Nair A, Kannan N, Samanthapudi VS, Prabhakar J, Manavathi B. Hematopoietic PBX-interacting protein (HPIP) is over expressed in breast infiltrative ductal carcinoma and regulates cell adhesion and migration through modulation of focal adhesion dynamics. Oncogene. 2014.
34. Wang X, Yang Z, Zhang H, Ding L, Li X, Zhu C, Zheng Y, Ye Q. The estrogen receptor-interacting protein HPIP increases estrogen-responsive gene expression through activation of MAPK and AKT. Biochim Biophys Acta. 2008; 1783:1220–1228.
35. van Vuurden DG, Aronica E, Hulleman E, Wedekind LE, Biesmans D, Malekzadeh A, Bugiani M, Geerts D, Noske DP, Vandertop WP. Pre-B-cell leukemia homeobox interacting protein 1 is overexpressed in astrocytoma and promotes tumor cell growth and migration. Neuro Oncol. 2014; 16:946–959.
36. Okada S, Irie T, Tanaka J, Yasuhara R, Yamamoto G, Isobe T, Hokazono C, Tachikawa T, Kohno Y, Mishima K. Potential role of hematopoietic pre-B-cell leukemia transcription factor-interacting protein in oral carcinogenesis. J Oral Pathol Med. 2015; 44:115–125.
37. Xu X, Jiang C, Wang S, Tai Y, Wang T, Kang L, Fan Z, Li S, Li L, Fu J, Liu J, Ji Q, Wang X, et al. HPIP is upregulated in liver cancer and promotes hepatoma cell proliferation via activation of G2/M transition. IUBMB Life. 2013; 65:873–882.
38. Silveira SM, Villacis RA, Marchi FA, Barros Filho Mde C, Drigo SA, Neto CS, Lopes A, da Cunha IW, Rogatto SR. Genomic signatures predict poor outcome in undifferentiated pleomorphic sarcomas and leiomyosarcomas. PLoS One. 2013; 8:e67643.
39. Adzhubei IA, Schmidt S, Peshkin L, Ramensky VE, Gerasimova A, Bork P, Kondrashov AS, Sunyaev SR. A method and server for predicting damaging missense mutations. Nat Methods. 2010; 7:248–249.
40. Wood HM, Belvedere O, Conway C, Daly C, Chalkley R, Bickerdike M, McKinley C, Egan P, Ross L, Hayward B, Morgan J, Davidson L, MacLennan K, et al. Using next-generation sequencing for high resolution multiplex analysis of copy number variation from nanogram quantities of DNA from formalin-fixed paraffin-embedded specimens. Nucleic Acids Res. 2010; 38:e151.
41. Medvedev P, Fiume M, Dzamba M, Smith T, Brudno M. Detecting copy number variation with mated short reads. Genome Res. 2010; 20:1613–1622.
42. Xi R, Hadjipanayis AG, Luquette LJ, Kim TM, Lee E, Zhang J, Johnson MD, Muzny DM, Wheeler DA, Gibbs RA, Kucherlapati R, Park PJ. Copy number variation detection in whole-genome sequencing data using the Bayesian information criterion. Proc Natl Acad Sci U S A. 2011; 108:E1128–1136.
43. Krzywinski M, Schein J, Birol I, Connors J, Gascoyne R, Horsman D, Jones SJ, Marra MA. Circos: an information aesthetic for comparative genomics. Genome Res. 2009; 19:1639–1645.