
INTRODUCTION
Cancer initiation and development are associated with the accumulation of numerous genetic alterations in the cancer genome. These alterations include both small-size mutations and large-scale genomic alterations consisting of copy number variants (CNVs - deletions, duplications or amplifications), as well as copy-number-neutral genomic rearrangements (inversions or translocations). Interactions between these alterations (in certain situations, in addition to germline mutations) allow cancer to clonally evolve due to deactivation of tumor suppressor genes (loss-of-function mutations) and activation of oncogenes (gain-of-function mutations).
Lung cancer is the leading cause of cancer-related death (http://www.who.int/mediacentre/factsheets/fs297/en/; [1]). There are several subtypes of lung cancer, the most common of which is non-small-cell lung cancer (NSCLC). NSCLC can be further divided into adenocarcinoma, squamous-cell carcinoma, and large-cell carcinoma. Lung cancer occurs predominantly in smokers (>60%). Regardless of histological and risk-factor divisions, lung cancer is one of the most genomically heterogeneous type of cancer. Recently, several whole-genome sequencing projects utilizing next-generation sequencing technologies revealed the presence of thousands of small-size mutations in the individual lung cancer genome [2–5], with an almost 10 times higher frequency of mutations in smoker than in non-smoker samples [6]. An even higher level of variation seems to be attributed to copy number alterations. It was shown with the use of SNP-array-based analysis that approximately 50% of the lung cancer genome undergoes recurrent copy number alterations [7]. On average, over 40% of the genome undergoes copy number alteration in individual lung cancers [8]. However, only a small fraction of alterations occurring in cancer genomes are functional (“driver”) mutations; others are “passenger” mutations that occur as a consequence of the general cancer genome destabilization. Although “passenger” mutations are not critical for cancer genome evolution, they are often selected in parallel with closely located or commonly regulated targets of “driver” mutations. The role of “passenger” mutations for particular cancers is mostly unknown (it is not necessarily neutral).
A substantial progress in lung cancer treatment (especially adenocarcinomas) has been made recently due to personalized therapy based on genomic biomarkers. The distinctive biomarkers in lung cancer are mutations in the epidermal growth factor receptor (EGFR) [9] or gain-of-function translocations and inversions involving the anaplastic lymphoma receptor tyrosine kinase (ALK) [10]. However, the general prognosis of lung cancer is still poor and its 5-year survival is one of the lowest among cancer patients at approximately 10%. Therefore, many lung cancer studies are currently focused on understanding the impact of genetic alterations on cancer biology and development and on the identification of new prognostic biomarkers.
Among the most intensively studied candidate biomarkers are microRNAs (miRNAs), a class of short (~21 nt long), single-stranded, noncoding RNAs. MiRNAs are primarily involved in the post-transcriptional regulation of gene expression, either by mRNA degradation or inhibition of translation efficiency [11, 12]. Mature miRNAs are generated in two subsequent steps from long primary precursors (pri-miRNAs). Pri-miRNAs are encoded either by independent transcriptional units or by protein-coding genes. In the first step of miRNA biogenesis that takes place in the nucleus, the secondary precursor (~60 nt long pre-miRNA), which adopts a hairpin structure, is cleaved out from pri-miRNA by the nuclease DROSHA. Upon export to the cytoplasm, the pre-miRNA is further processed into a miRNA-duplex by the nuclease DICER. One of the miRNA-duplex strands is released, and the other becomes the mature miRNA that, as a key element of the miRNA-induced silencing complex (miRISC) recognizes complementary target sequences usually located within the 3’ untranslated regions of mRNAs.
The biological functions of most miRNAs identified so far (miRBase; http://www.mirbase.org; [13, 14] remain unknown. However, it has been well documented that miRNAs downregulate numerous genes and either stimulate or inhibit many important biological processes and diseases, including cell proliferation and differentiation, apoptosis, development and cancer [15–18].
The role of miRNAs in the development of cancer was first identified in chronic lymphocytic leukemia in 2002 [19]. Since then, it has been shown that overexpression or downregulation of certain miRNAs contributes to the development, progression and metastasis of many types of cancer. Such miRNAs can therefore be classified as either oncogenes (oncomirs) or tumor suppressors [20]. It has also been shown that some miRNAs, such as miR-21, miR-205 or miR-155, seem to be universal for different cancers [12].
There have been numerous studies of miRNA expression in lung cancer, and many miRNAs that are specifically over- or underexpressed in lung cancer or in particular lung cancer subtypes were identified. For example, it was shown that 6 miRNAs constituting the polycistronic miRNA cluster, miR-17/92, are overexpressed in lung cancer and enhance cell proliferation [21]. It was later shown that an elevated level of these miRNAs may be detected in the plasma of lung cancer patients [22, 23] and is associated with poor disease prognosis [24]. Other miRNAs consistently found to be either overexpressed or underexpressed in lung cancer are miR-21, miR-210 and miR-126. However, it should be noted that substantial discordances between miRNA profiling results also exist.
Although the functional relevance of some of the miRNAs that are differentially expressed in lung cancer has been demonstrated (e.g., [25–27]), the roles of most of these miRNAs in cancer are unknown or poorly recognized. One factor that may shed more light on the role of particular miRNAs in cancer is the mechanism underlying their aberrant expression. Among the most pronounced mechanisms underlying aberrant expression in cancer are point mutations, epigenetic modifications and copy number alterations. However, it has been suggested that point mutations and epigenetic modifications are not important factors in the global miRNA regulation in lung cancer [24, 28]. It has also been shown that miRNA genes are overrepresented and cluster in genomically fragile sites and other regions that undergo frequent copy number changes in cancer genomes. Thus, it has been suggested that somatic copy number variation may lead to the activation/deactivation of miRNAs in cancer [29, 30]. For example, systematic analysis of three cancer types (ovarian, breast, and melanoma) with the use of comparative genome hybridization microarrays showed that 37% (ovarian) to 89% (melanoma) of analyzed miRNA genes undergo copy number changes [30]. There are known examples of both miRNA- and protein-coding genes whose expression in cancer is either increased or decreased by their copy number variation. These high-copy-number amplifications and recurrent deletions (loss of heterozygosity) are often used as a confirmation of oncogenic and tumor-suppressive function of the analyzed gene, respectively. The role of copy number variations in the regulation of miRNAs in cancer and the potential cancer-related implications have been reviewed before [31–33]. The most recent review provides an excellent summary and discusses this notion using ovarian cancer as an example [33].
In this study, with the use of homemade multiplex ligation-dependent probe amplification (MLPA) assays, we analyzed the somatic copy number variation of 14 miRNA genes consistently found to be either over or underexpressed in lung cancer. Additionally, we analyzed the copy number variation of DICER1 and DROSHA, two main miRNA biogenesis genes. We analyzed these genes in 254 NSCLC samples and observed high copy number variation in most of the analyzed genes. Among the frequently amplified miRNA genes were miR-21, miR-17/92 and miR-155, which are commonly recognized as oncomirs, as well as miR-30a and miR-30d which were downregulated in lung cancer. Surprisingly, a high average copy number value and frequent amplifications were present in both miRNA biogenesis genes. We also showed that amplification of DROSHA is not driven by other closely located oncogenes. The most frequently deleted miRNA gene turned out to be miR-126, which is commonly found to be downregulated in lung cancer. Our analysis showed that a substantial fraction of differentially expressed miRNAs may be explained by and are consistent with the copy number variation of their genes.
RESULTS
Selection of miRNA genes for copy number analysis in lung cancer
To select miRNA genes for our analysis, we took advantage of two recently published meta-analysis studies [34, 35] summarizing the results of dozens of whole-genome miRNA expression studies in lung cancer (references within [34, 35]). Although these two studies utilized completely different strategies of meta-analyses, the top significantly up- and downregulated miRNAs identified in both studies overlap perfectly (with minor differences in the order of identified miRNAs). Based on these meta-analyses, we selected 6 genes/genomic regions (miR-21, miR-210, miR-182, mir-31, mir-200b, mir-205) encoding miRNAs most consistently identified as upregulated, and 6 genes (miR-126, miR-30a, miR-30d, miR-486, miR-451a, miR-143) encoding miRNAs most consistently identified as downregulated in lung cancer. Additionally, for our analysis we selected the genomic regions of miR-155 and miR-17 (identified in one meta-analysis), which were consistently associated with poor prognosis of lung cancer, as well as two genes (DICER1 and DROSHA) encoding miRNA processing enzymes. The genomic positions of all selected genes are indicated in Figure 1, and the criteria for their selection are summarized in Table 1. Note that some of the selected miRNA genes encompass miRNA clusters (e.g., miR-17/92 and miR-143/145).
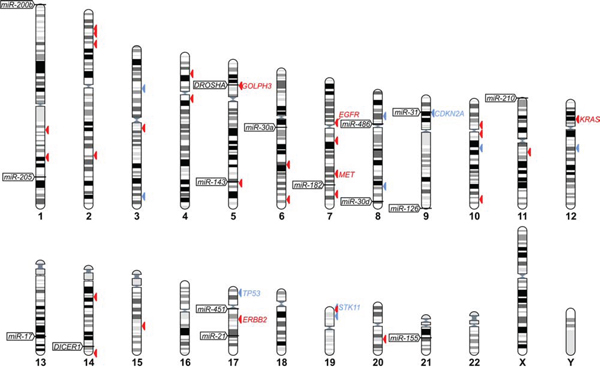
Figure 1: The positions of selected miRNA and miRNA biogenesis genes in human genome. The positions of miRNA and miRNA biogenesis genes are indicated on chromosome ideograms (left-hand side). Arrowheads on the right-hand side of the ideograms indicate lung cancer relevant genes catalogued in COSMIC: the Cancer Gene Census (associated with one of the following terms: “lung”, “NSCLC” or “multiple tumor types”), the most reliable list of cancer-related genes annotated and curated by the Wellcome Trust Sanger Institute (originally published in [78]). Additionally, the position of GOLPH3, which is discussed in this study, is indicated. Red and blue arrowheads indicate oncogenes and tumor suppressor genes, respectively. IDs of the most relevant genes are indicated next to the arrowheads. The figure was prepared with the use of the “Ensembl karyotypes” tool available on the Ensembl portal.
Table 1: List of miRNA and miRNA biogenesis genes selected for analysis
expression change top-ranked in meta-analysis |
other lung cancer relevant features |
||||||
analyzed loci IDs |
miRs in cluster |
Vosa et al.[35] [corrected p-value] |
Guan et al.[34] [mean fold change] |
association with poor prognosis |
potential biomarkersB |
frequently deregulated in other solid tumors |
|
miRNA and miRNA-cluster genes |
miR-21 |
↑ 2E-14 |
↑ 4.4 |
||||
miR-210 |
↑ 6E-11 |
↑ 2.7 |
+ [23] |
||||
miR-182 |
↑ 3E-8, 4E-2 |
↑ 6.3, 5.9 |
+ [84] |
||||
miR-31 |
↑ 1E-4 |
↑ 2.89 |
+ [84] |
||||
miR-200b |
200bE, 200a, 429 |
↑ 1E-3 |
↑ 3.7 |
+ [84] |
|||
miR-205 |
↑ 7E-3 |
↑ 23.2 |
+ [83] |
||||
miR-126 |
↓ 7E-12 |
↓ .33 |
+ [56] |
||||
miR-30a |
30aE, 30b |
↓ 1E-9 |
↓ .36 |
||||
miR-30d |
↓ 2E-8 |
↓ .34 |
|||||
miR-486 |
↓ 4E-7 |
↓ .39 |
|||||
miR-451a |
451aE, 4732, 144 |
↓ 7E-5 |
↓ .37 |
+ [83] |
|||
miR-143 |
↓ 7E-4, 1E-3 |
↓ .33, .23 |
+ [24] |
+ [83] |
|||
miR-155 |
+ [85] |
||||||
miR-17 |
17, 18a, 19a, 20a, 19b-1, 92a-1 |
+ [24] |
|||||
miRNA biogenesis genes |
DICER1 |
||||||
DROSHA |
+ [87] |
||||||
EmiRNAs reported as top-ranked in both meta-analyses;
*expression changes non top-ranked or not analyzed in meta-analyses;
Baltered in plasma/serum/blood/sputum of lung cancer patients and/or associated with early stage NSCLC [23, 82, 85, 86]
MLPA assays design
To analyze the somatic copy number variation of selected genomic regions, we designed two MLPA assays, each covering 7 miRNA genes and 1 miRNA biogenesis gene. Each miRNA or miRNA cluster region was covered by two MLPA probes located in close proximity (mostly within 1 kb) to an annotated pre-miRNA sequence, preferentially on both sides of the pre-miRNA sequence. Each of the miRNA biogenesis genes (DICER1 and DROSHA) was covered by 3 MLPA probes located in exons distributed about equally across the genes. Additionally, each MLPA probe-set contained 4 control probes specific for different chromosomes. The exact genomic location and sequence of each probe is indicated in Supplementary Table S1. MLPA assays were designed and generated according to a strategy developed and have been described in detail previously [36, 37]. We validated the performance of the assays with the panel of reference non-cancer DNA samples and showed that all covered genomic regions are genetically stable and always occur in 2 copies.
Analysis of the somatic copy number variation of selected miRNA genes
With the use of the developed MLPA assay, we analyzed 254 NSCLC samples and determined the relative copy number value of all analyzed regions in these samples. As shown in Figure 2, the signals of probes representing particular regions in most cases are strongly synchronized. If one probe in a particular region indicates a copy number increase, the other probe or probes in these regions also show similar levels of copy number increase. As each MLPA probe recognizes different target sequence, such a correlation provides independent validation of the obtained results. The copy number value of a particular region was calculated as the average of the copy number values of the respective probes. The regions for which inter-probe variation was too high were considered uninterpretable and were excluded from further analysis. The relative copy number values of all analyzed regions are shown in Supplementary Table S2 and graphically summarized in Figure 3. As analyzed NSCLC samples are contaminated with different amounts of normal DNA (in most samples percentage of tumor cells (PTC) is >50%, and an average PTC is approximately 70%) the estimated copy number changes are generally diluted and lower than in actual cancer cells. For comparison, copy number values corrected for PTC (dilution) factor are shown in Supplementary Figure S1. As shown in Figure 3 and Supplementary Figure S1, the average copy number of analyzed regions differs substantially and is highest for DROSHA, miR-30d, miR-30a, miR-21, DICER1, miR-205, miR-17, and miR-155 and lowest for the miR-126 region (Table 2).
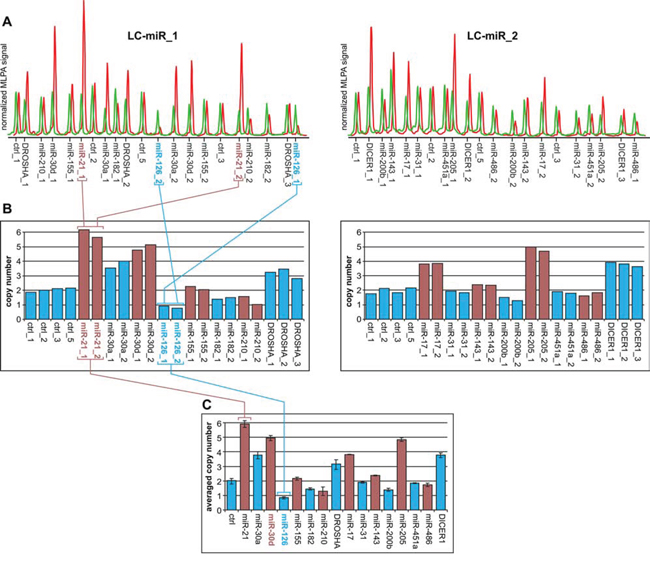
Figure 2: Copy number analysis of the selected genomic regions in a representative lung cancer sample. A. Electropherograms of MLPA results obtained with the use of LC-miR_1 (left-hand) and LC-miR_2 (right-hand) MLPA assays. The electropherograms of the cancer sample (red) are presented along the electropherograms from a reference non-cancer sample (green) and normalized against the signal of control probes. Probe IDs are indicated below the electropherograms. The probe signals (peak heights) correspond to the copy number of targeted regions. B. Bar plots (corresponding to the electropherograms of the cancer sample shown above (A)) represent the copy number value (y-axis) of each probe (x-axis) normalized by comparison of its signal in cancer samples to the corresponding signal in reference sample. The colors were used purely for sake of visualization purposes to better distinguish probes of subsequent genomic regions. Note that the signals of probes specific to the same genomic region are synchronized (e.g., probes miR-21_1 and miR-21_1 or miR-126_1 and miR-126_2; indicated in panels A and B). C. Bar plot representing the average copy number values of investigated regions in analyzed samples. Whiskers indicate maximum and minimum copy number values detected in particular regions, as shown in panel B. Note that genomic regions in which the difference between the maximum and minimum signal was higher than one-third of an average copy number value were excluded from further analysis (miR-210).
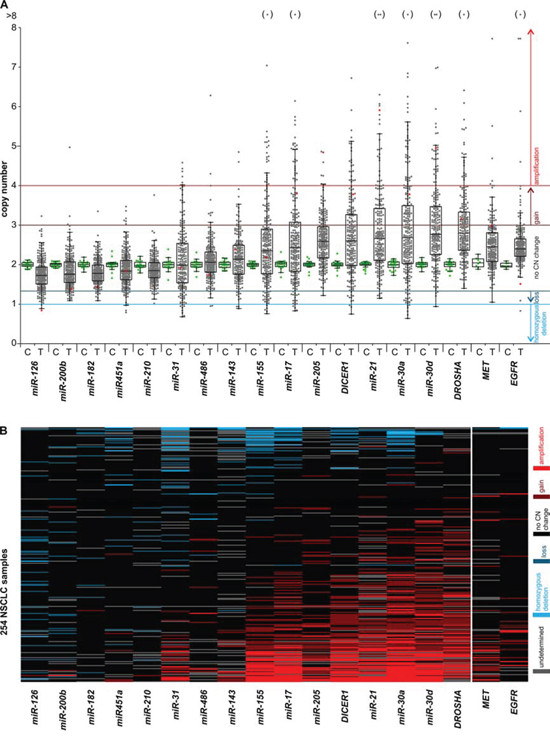
Figure 3: Graphical summary of the copy number variation of the analyzed genes in NSCLC samples. The graph shows the results of copy number analysis of the selected miRNA and miRNA biogenesis genes as well as two lung cancer related oncogenes, MET and EGFR. A. The graph shows the relative copy number values (y-axis) of selected genes (x-axis) of all studied samples. The genes were ordered from the lowest to highest median copy number value. Each dot represents the copy number value of individual control (C – green dot) or lung cancer (T – grey dot) samples. Red dots indicate copy number values of the representative lung cancer sample, analysis of which is shown in Figure 2. Dots in brackets (above) indicate samples with a copy number value >8. Color lines represent threshold values of homozygous deletions, losses, gains and amplifications. The outlined Tukey box-and-whisker plots indicate 1st quartile, median and 3rd quartile, and summarize the distribution of the presented copy number values. B. The heatmap graph showing the distribution of copy number categories of analyzed genes (columns) in 254 lung cancer samples (rows). The genes (from the left) and samples (from the top) were ordered from the lowest to highest average copy number value. Copy number categories are indicated by colors as shown in the legend on the right.
Table 2: Summary of copy number changes observed in analyzed miRNA and miRNA biogenesis genes in NSCLC samples
expression |
copy number: median (average) |
gains: number (%) |
amplifications: number (%) |
losses: number (%) |
hom. deletions: number (%) |
informative samples # |
|
miR-126 |
↓ |
1.73 (1.76) |
1 (0.4) |
0 (0) |
26 (10.8) |
3 (1.2) |
241 |
miR-200b |
↑ |
1.76 (1.84) |
2 (0.9) |
1 (0.4) |
18 (7.7) |
0 (0) |
235 |
miR-182 |
↑ |
1.78 (1.81) |
1 (0.4) |
0 (0) |
9 (3.8) |
0 (0) |
240 |
miR-451a |
↓ |
1.84 (1.89) |
6 (2.5) |
0 (0) |
12 (5.0) |
4 (1.7) |
239 |
miR-210 |
↑ |
1.85 (1.87) |
1 (0.4) |
0 (0) |
9 (4.0) |
0 (0) |
227 |
miR-31 |
↑ |
1.99 (2.11) |
22 (10.0) |
6 (2.7) |
20 (9.1) |
8 (3.7) |
219 |
miR-486 |
↓ |
2.06 (2.11) |
7 (3.0) |
2 (0.9) |
3 (1.3) |
2 (0.9) |
233 |
miR-143 |
↓ |
2.14 (2.16) |
12 (5.9) |
2 (1.0) |
8 (3.9) |
3 (1.5) |
205 |
miR-155 |
↑ |
2.33 (2.50) |
33 (13.5) |
23 (9.4) |
21 (8.6) |
5 (2.0) |
245 |
miR-17 |
↑ |
2.42 (2.62) |
39 (16.0) |
28 (11.5) |
15 (6.1) |
5 (2.0) |
244 |
miR-205 |
↑ |
2.59 (2.61) |
45 (19.0) |
8 (3.4) |
1 (0.4) |
0 (0) |
237 |
DICER1 |
↓/↑ |
2.60 (2.69) |
51 (21.8) |
23 (9.8) |
8 (3.4) |
3 (1.3) |
234 |
miR-21 |
↑ |
2.63 (2.90) |
48 (22.7) |
25 (11.8) |
6 (2.8) |
0 (0) |
211 |
miR-30a |
↓ |
2.67 (2.90) |
59 (23.8) |
40 (16.1) |
14 (5.6) |
6 (2.4) |
248 |
miR-30d |
↓ |
2.77 (3.02) |
63 (26.6) |
35 (14.8) |
3 (1.3) |
1 (0.4) |
237 |
DROSHA |
↑ |
2.79 (3.00) |
67 (30.7) |
23 (10.6) |
0 (0) |
0 (0) |
218 |
MET |
↑ |
2.45 (2.50) |
23 (9.9) |
5 (2.2) |
1 (0.4) |
0 (0) |
232 |
EGFR |
↑ |
2.41 (2.55) |
13 (5.3) |
5 (2.0) |
1 (0.4) |
1 (0.4) |
246 |
Pronounced copy number changes may be more indicative of the role of a particular region in cancer. Therefore, based on criteria similar to those applied before [38, 39], we classified the identified copy number changes to the following categories (from highest to lowest copy number): amplifications (≥4 copies; ≥2x increase), gains (≥3 copies; ≥1.5x increase), losses (≤1.33 copies; ≤1.5x decrease) and homozygous deletions (≤1 copy; ≤2x decrease). The categorized copy number changes of all analyzed samples are visualized in a heatmap graph (Figure 3B) and are summarized in Table 2. The results indicate that the number of amplifications detected in particular genes generally correlates with an increase in the average copy number value of these genes. The highest frequency of amplifications was observed in miR-30a, miR-30d, miR-21, miR-17, DROSHA, DICER1, and miR-155. In some of these genes both amplifications and isolated cases of deletions were detected. The genes for miR-182, miR-200b and miR-210 turned out to be relatively stable, showing neither amplifications nor homozygous deletions. Only a few homozygous deletions but no amplifications were detected in miR-126 and miR-451a. For comparison, the results of copy number changes of genes analyzed in this study are presented along with corresponding results of two oncogenes, EGFR and MET, obtained previously with the use of a similar methodology [40].
Extended analysis of the DROSHA locus on chromosome 5
One of the genes with the highest average copy number and the highest frequency of amplifications was DROSHA. To investigate whether copy number increases in DROSHA result from amplification of other nearby genes or regions, we designed an additional MLPA assay (LC-5p) covering the short arm of chromosome 5 (5p-arm). Except for the 4 control probes that were used before, the assay was composed of (i) 6 probes more or less evenly distributed along the entire chromosome arm, (ii) 5 probes covering the DROSHA gene (3 probes used before and 2 new probes), and 3 probes covering the GOLPH3 gene, recently identified as oncogene [41] located in close proximity (~0.5 Mb upstream) to DROSHA. The locations of the probes are indicated in Figure 4A and Supplementary Table S1. With the use of the developed assay, we analyzed 20 samples selected based on the increased signal of DROSHA observed in the first experiment (18 amplifications and 2 gains). The copy number values of DROSHA determined by two independent experiments (with the use of LC-miR_1 and LC-5p assays) showed a very strong correlation (R = 0.92, p < 0.0001, data not shown). As shown in Figure 4, increased copy number is observed along almost the entire 5p-arm and no specific region shows sign of focal amplification. The region of amplifications observed in particular samples extends from the probe 5p_10, 2M to the probes covering DROSHA, and usually does not encompass GOLPH3 (Figure 4). The above experiment clearly demonstrates that amplification of DROSHA is part of a chromosome-level amplification of the 5p-arm and is not a “passenger” effect of focal amplification of some other oncogene.
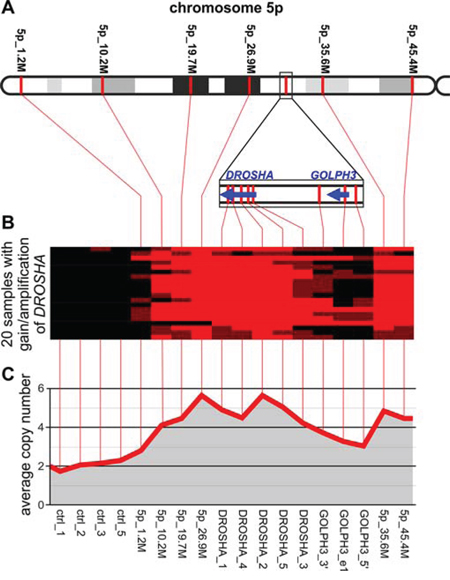
Figure 4: Analysis of copy number changes in the 5p-arm in NSCLC samples with gain/amplification of DROSHA. A. The schematic map of the 5p-arm with indicated positions of LC-5p MLPA probes (spaced by approximately 10 Mbp). The DROSHA/GOLPH3 region, more densely covered by MLPA probes, is zoomed in on below. B. A heatmap graph showing copy number categories of all analyzed samples (18 with DROSHA amplification and 2 with DROSHA gain; rows) in control regions and in regions along the 5p-arm (columns). Red, brown and black colors indicate amplification, gain and no copy number change, respectively. C. A line-graph indicating the average copy number values (y-axis) of analyzed samples in control regions and in regions along the 5p-arm (x-axis). Note that in B and C, the spacing of consecutive probe signals depicted on the graphs does not correspond to their exact genomic distance.
Survival analysis of patients stratified by copy number categories of miRNA and miRNA biogenesis genes
The overall survival data were available for 120 of the analyzed patient samples. Median overall survival of these patients was 416 days (14 months). Kaplan-Meier survival analysis of patients grouped based on copy number categories showed significant decreases in the survival of patients with the miR-200b deletion (log-rank test, p = 0.022) and patients with gain or amplification of miR-30d (p = 0.013) (Figure 5). This corresponds to a lower 5-year survival rate (0%) of patients with the above mentioned copy number aberrations compared to patients without the aberrations in miR-200b (6%) and miR-30d (10%).
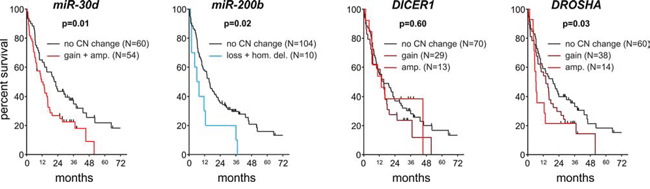
Figure 5: Survival analysis of NSCLC patients. Kaplan-Meier graphs presents the survival of patients stratified based on copy number categories of (from the left) miR-30d, miR-200b, DICER1 and DROSHA.
Similar analyses performed for DICER1 and DROSHA showed that samples with an increased copy number of DROSHA have significantly decreased survival and that the survival rate corresponds to the degree of copy number increase (log-rank test for trend, p = 0.032) (Figure 5).
Association of clinical data with copy number categories of miRNA and miRNA biogenesis genes
The copy number categories of any of the analyzed regions showed substantial association with the sex or age of the analyzed patients (Supplementary Table S3). Somewhat higher average age of diagnosis showed samples with miR-126 deletion (with del/without del; 64.9/61.2 years; p = 0.046), miR-451a deletion (with del/without del; 66.8/61.2 years; p = 0.041), and with miR-31 deletion (with del/without del; 65.7/61.0 years; p = 0.017). It has to be noted, however, that these associations are only marginally significant on the nominal level but not after adjustment for multiple comparisons. We also did not find any significant association of copy number categories with clinical data, such as stage of lung cancer at time of sample collection and metastasis/progression/remission status during the last examination (Supplementary Table S3). It has to be noted, however, that clinical data were available only for part of the analyzed samples (N = 120) and therefore, the lack of association may result from relatively low statistical power of our analysis.
Computational analysis of the association of DICER1 and DROSHA copy number categories with their expression and cancer patient survival
Because we do not have access to mRNA/cDNA material or the expression data for our samples to determine whether copy number changes in DICER1 and DROSHA correlate with their expression, we used data deposited in the cBioPortal for Cancer Genomics [42, 43]. As shown in Figure 6, there is a dose-dependent correlation between the copy number categories and the expression of DICER1 and DROSHA in lung cancer (based on TCGA Cancer Genome ATLAS data [44]). A similar correlation can be observed in other cancers analyzed in different studies (Supplementary Figure S2). Further analysis with the use of another oncogenomic tool, PPISURV [45], showed that the increased expression of DROSHA generally (across cancers/datasets) correlates with decreased survival (Figure 6B and Supplementary Figure S2). In most deposited datasets/cancer types, including lung cancer, correlations show the same negative direction (in 6 of 36 datasets association show significance at p ≤ 0.05). Similar analysis performed for DICER1 shows the opposite effect of increased expression. In most deposited datasets, increased expression of DICER1 shows the association (positive correlation) with increased survival (14 of 42 datasets show association at p-≤ 0.05; Figure 6B and Supplementary Figure S2).
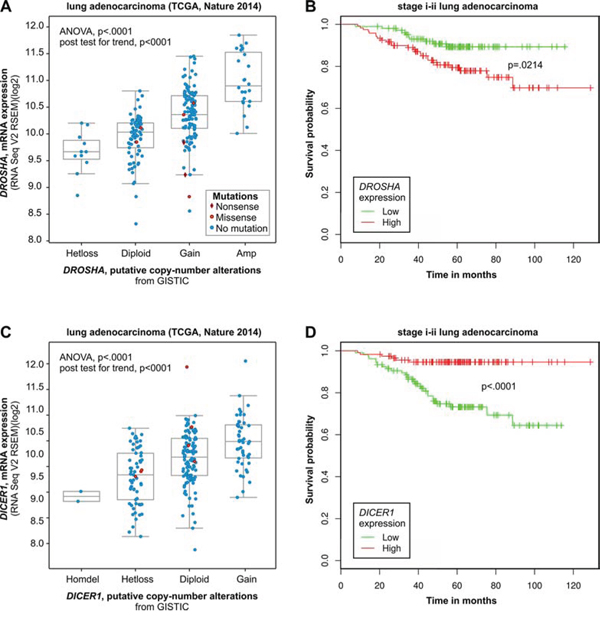
Figure 6: Computational analysis of clinical (survival) and oncogenomic data of DROSHA and DICER1. Mutual relation between copy number and expression (oncogenomic data) of DROSHA A and B. and DICER1 C and D. and the relation of their expression to survival of cancer patients. A) and C) Correlation analysis of copy number categories and expression level performed with the use of a dataset (lung adenocarcinoma TCGA [79]) deposited and tools available in cBioPortal for Cancer Genomics. B) and D) Survival analysis performed with the use of a dataset (stage i-ii lung adenocarcinoma; GEO: GSE31210) deposited in and tools available from the PPISURV web portal.
DISCUSSION
With the use of two homemade MLPA assays, we analyzed the copy number variation of 14 miRNA genes reported as either over- or underexpressed in lung cancer. Additionally, we analyzed two critical miRNA biogenesis genes, DROSHA and DICER1. Each analyzed gene was tested by at least two independent MLPA probes, providing additional internal validation for the obtained results. To avoid any potential false results, the substantially discordant signals of matched probes were excluded from analysis. A similar strategy of somatic copy number variation analysis may be applied to almost any genomic region of interest in cancer samples. It should be noted, however, that the obtained copy number values are relative and to some extent may depend on the copy number variation of selected control regions (probes).
The analysis showed a substantial somatic copy number variation (both gains and losses) of all selected regions in cancer samples (compared variation in cancer vs. control, non-cancer samples; Figure 3). However, the observed copy number alterations are not random, and some regions show a substantial increase (frequent amplifications), while the others show decrease in the average copy number value. The genes showing the highest average level of copy number include miR-30d, miR-30a, miR-21, miR-205, miR-17, miR-155 as well as DROSHA and DICER1. Surprisingly, the average copy number and the frequency of amplifications of some of these genes (e.g., DROSHA, miR-30d, miR-30a and miR-21) are substantially higher than the corresponding values of well-known lung cancer-related oncogenes, EGFR and MET, analyzed in the same set of samples. In contrast, miR-126 showed the lowest average copy number and a relatively high frequency of deletions and homozygous deletions. It should be noted, however, that due to the contamination of cancer samples with normal DNA and the inherent lower amplitude of copy number losses than copy number gains, the power of our analysis to detect deletions was substantially lower than the power to detect copy number gains/amplifications. Some genes, such as miR-31, show a relatively high frequency of both gains/amplifications and deletions.
As expected, the copy number variation of analyzed miRNAs does not correlate perfectly with the global expression changes of these miRNAs observed in lung cancer. However, our results indicate that copy number gains/amplifications may contribute substantially and may be an important mechanism underlying overexpression of miRNAs such as miR-21, miR-17, miR-205 or miR-155. In short, these miRNAs are the best known oncomirs implicated not only in lung cancer but also in many other types of cancer (reviewed in [20, 26, 46, 47]). MiR-21 was originally recognized as an antiapoptotic miRNA [48] that was strongly overexpressed in most types of cancer. Later, it was shown that miR-21 promotes growth, metastasis and invasiveness, as well as chemo- and radioresistance of NSCLC, most likely by targeting tumor suppressor PTEN [49, 50]. In our experiment, miR-17 represents 6 miRNAs coded in the miR-17/92 cluster located within intron 3 of the C13orf25 on chromosome 13. It was shown that the miR-17/92 cluster may be upregulated by gene amplification, which is consistent with our results, or by MYC overexpression. It was also shown that upregulation of the miR-17/92 cluster promotes cell proliferation and inhibits lung cell differentiation (the role of miR-17/92 cluster was reviewed in [51]). MiR-205 acts either as a tumor suppressor or as an oncogene. As an oncogene, it promotes tumor initiation, progression, resistance to therapies and inhibits apoptosis. It was shown that the oncogenic role of miR-205 is expressed mostly by downregulation of tumor suppressors such as PTEN and SHIP2 (references within [46]). MiR-155 is encoded by the non-protein-coding gene BIC, originally identified as B-cell integration cluster for the avian leukosis virus, inducing lymphomas [52]. It was shown that miR-155 targets several tumor suppressors such as SOCS1, FOXO3, and VHL and is involved in the regulation of cell survival, growth, chemosensitivity and tumor angiogenesis [53–55].
On the other hand, miR-126 showed the lowest average copy number and frequent deletions in our study and is also recurrently found as downregulated in lung cancer. MiR-126 was recognized as a tumor suppressor in most of the cancers studied. It was shown that miR-126 may negatively control and inhibit cell proliferation, migration, invasion, and cancer cell survival. Among the validated targets of miR-126 are such oncogenes as ADAM9, CRK, EGFL7, HOXA9, IRS1, KRAS, PI3K, SLC7A5, SOX2, and VEGF (reviewed and references within [56]).
The example of miRNAs which show discordant directions of expression and copy number changes are miR-30a and miR-30d, both belonging to miR-30 family. MiR-30a and miR-30d belong to the miRNAs most frequently reported to be downregulated in lung cancer. On the other hand, these two miRNAs exhibit average copy number values and amplification frequencies that are among the highest of the genes analyzed in our study. It should be noted, however, that the copy number increases in miR-30d observed in our study correspond well to the results obtained previously by Li et al.. They showed that miR-30d is frequently amplified in different types of cancer (~30%) including lung cancer (27%), and that amplification of miR-30d correlates with its overexpression [57]. It was also shown that miR-30d downregulates many cancer-related genes, including apoptotic caspase CASP3, and is involved in the upregulation of such processes as cell proliferation, apoptosis, and migration [57]. The above facts strongly suggest the oncogenic character of miR-30d. Additionally, our results suggest that increased copy number of miR-30d (gains or amplifications vs. others) correlate with significantly reduced survival (Figure 5). On the other hand, miR-30a has been frequently implicated as a tumor suppressor. It was shown that miR-30a targets and downregulates the transcription factor Snai1 and consequently inhibits the epithelial-to-mesenchymal transition (EMT), invasion, mobility and metastasis of NSCLC cells [25]. The opposite characteristics of these two miRNAs may be reflected by the different frequency of deletions of these two miRNAs observed in our study. Although miR-30a showed a substantially increased average copy number, it was also one of the most frequently deleted in our analysis. Of our analyzed samples, 20 (8%) showed deletion of miR-30a, including 6 samples (2.4%) with homozygous deletions. For comparison, only 5 samples showed deletion of miR-30d.
Another example of miRNA with opposite trends in global expression and copy number changes is miR-200b. Although upregulation of miR-200b was recurrently identified in lung cancer, its character suggests it is likely a tumor suppressor. MiR-200b belongs to the miR-200 family that maintains the general characteristics of the epithelia and inhibits EMT, tumor cell motility, and invasiveness ([58] and references within). Among the experimentally identified and validated targets of miR-200b are numerous genes involved in the regulation of cytoskeletal organization and cell morphology in addition to EGFR [58]. Additionally, our analysis showed significantly decreased survival of patients with either deletion or homozygous deletion of miR-200b.
In addition to miRNA genes, we analyzed also two key miRNA biogenesis genes, DICER1 and DROSHA. Both of these genes, but especially DROSHA, show substantial copy number increases and frequent high-copy number amplifications in analyzed samples. Review of the Cancer Gene Census (COSMIC database) reveals no proto-oncogene in close proximity of either DROSHA or DICER1 that might drive their amplification. However, meticulous review of the literature allowed us to identify GOLPH3 located in direct proximity (~600 kb upstream) of DROSHA. GOLPH3 encodes a Golgi-localizing protein that was recently identified as a candidate oncogene driving the amplification of the 5p13 region. This amplification has frequently been observed in multiple solid tumors, including lung cancer [41]. It was shown that Golph3 enlarges cell size, enhances growth-factor-induced mTOR signaling in human cancer cells, and increases the sensitivity to an mTOR inhibitor [41]. The detailed analysis showed that the region of amplification comprising GOLPH3 is very narrow and does not extend to DROSHA. However, the frequency of GOLPH3 amplification in lung cancer observed previously (56%) corresponded well to the frequency of gains/amplifications of DROSHA observed in our study (42%). To verify whether the DROSHA amplifications observed in our study might be driven by the closely located GOLPH3, we reanalyzed this region with the use of the new 5p-arm-specific MLPA assay. This experiment confirmed DROSHA amplifications in analyzed samples and showed that amplification of DROSHA results mostly from the chromosome-level amplification of almost the entire 5p-arm. This experiment clearly demonstrated that amplification of DROSHA does not depend on the focal amplification of closely located GOLPH3 or any other specific oncogene on the 5p-arm. Regardless of whether DROSHA and DICER1 are drivers of their amplifications, the amplifications of these two key miRNA biogenesis genes may increase their expression and, as a consequence, may contribute to the global destabilization of miRNA expression observed in many types of cancer.
The computational analysis of publically available oncogenomic data showed that the copy number variation of DROSHA correlates well with its expression and that increased expression of DROSHA is associated with worse survival. The above analyses of oncogenomic data are in line with our experimental results suggesting decreased survival of patients with gain or amplification of DROSHA (Figure 5). A similar computational analysis of DICER1 also showed a good correlation between its copy number categories and expression. However, in contrast to DROSHA, increased expression of DICER1 was associated with longer survival in various cancers including lung cancer. Although such results must be interpreted with caution, the opposite effects of increased expression of DROSHA and DICER1 on survival (positive and negative, respectively) may suggest the oncogenic role of intermediate products of these two enzymes, that is, pre-miRNAs (either specific or as a class). It should be noted that the advantage of the computational results discussed above is that they are based on independent (objectified) whole genome datasets generated in projects not focused specifically on DICER1, DROSHA or any other miRNA biogenesis gene.
Our results add to the complex picture of the role of DICER1 and DROSHA in cancer. The miRNA biogenesis genes were primarily considered as haploinsufficient tumor suppressors [59]. This notion results mostly from the observation that the overall level of miRNAs is often reduced in cancer [60–62] and from the fact that germline loss-of-function mutations in DICER1 are causative variants in the so called DICER1 syndrome, which is associated with increased risk of numerous, mostly early, childhood malignancies and benign tumors [63]. The representative (most common) malignancy for this syndrome is pleuropulmonary blastoma, which occurs in the lungs. More recently, analysis of cancers associated with DICER1 syndrome as well as other early childhood cancers (e.g., Wilms tumor) led to the identification of a peculiar pattern of somatic second-hit mutations in DICER1 and DROSHA. These mostly missense mutations are not randomly distributed over the genes but form clear hotspots, mostly affecting few amino acid residues located in or adjacent to metal-ion-binding residues in the RNaseIIIb domain of either DICER1 (D1709, E1813) or DROSHA (E1147, D1151) [63–68]. Functional analyses suggest that these mutations are not deleterious (as expected for typical second-hit mutations) but rather modify the function of DICER1 or DROSHA, making it favorable for cancer (oncogenic) (recently discussed in [69, 70]). It was shown that modified enzymes selectively reduce the processing of miRNAs generated from the 5′ arm of pre-miRNA hairpins and as a consequence modify the miRNA expression profile in cancer [65, 66, 71, 72].
Our results and the notion about the oncogenic role of DROSHA are very much in line with previous results suggesting that DROSHA is a key gene driving frequent gains of the 5p-arm in cervical squamous cell carcinoma (SCC) [73, 74]. Analysis of primary cervical SCC samples and cell lines showed that the frequent copy number gains and overexpression of DROSHA led to an altered profile of miRNA expression, including the expression of many cancer-related miRNAs. Among the miRNAs showing the highest overexpression was miR-31. Functional in vitro analyses (including wound healing test) showed that upregulation of DROSHA increases motility and invasiveness of squamous SCC cell lines [73, 74]. It was also shown that overexpression of DROSHA is associated with metastasis and decreased survival in esophageal cancer patients [75].
It should be noted that other genes of miRNA biogenesis enzymes may contribute to the regulation of global or individual miRNA expression in cancer. Therefore, to better understand and evaluate the impact of somatic copy number variation of miRNA biogenesis genes on miRNA expression in cancer, a more complex analysis is needed.
In conclusion, our results show a substantial somatic copy number variation in genomic regions comprising miRNA genes. Among these regions were those showing a substantial increase in the average copy number (frequently amplified), and regions with decreased average copy number. Concordance of copy number and expression changes of some miRNAs suggest that copy number variation may be an important mechanism responsible for regulation of these miRNAs in lung cancer. Therefore our observations support the proposed earlier notion, implying the high genomic instability of miRNA gene regions and contribution of copy number variation in the regulation of miRNA expression in cancer [29, 30]. It should be emphasized however that the amplitude and recurrence of copy number changes cannot be simply interpreted as the oncogenic role of a variable region/gene in cancer.
Our results also indicate the important role of miRNA biogenesis genes, especially DROSHA, in lung cancer. Even if these genes are not drivers of their copy number changes, they may affect global regulation of miRNA expression in cancer.
Finally, somatic copy number changes of some of the analyzed genes including DROSHA correlate with survival of cancer patients. Although the results of our survival analyses are only marginally significant (relatively low number of samples) and must be replicated in an independent group of samples, the copy number changes would be attractive biomarkers due to (i) the relatively high stability of genomic DNA, even extracted from formalin-fixed paraffin embedded (FFPE) samples; (ii) the small amount of DNA necessary for analysis; (iii) relatively low cost; (iv) simplicity; and (v) the reliability of copy number analysis. The drawback of such analysis is, however, contamination of the cancer samples with a difficult to estimate amount of normal DNA.
MATERIALS AND METHODS
Selection and processing of NSCLC samples for molecular analysis
We retrospectively reviewed a cohort of 254 patients with histopathologically confirmed NSCLC diagnosed at the Franciszek Lukaszczyk Oncology Center in Bydgoszcz (central Poland). The age of the patients ranged from 35 to 81. A total of 254 specimens that passed the quality control steps (microscopic analysis and tumor content qualification as well as qualitative and quantitative DNA analysis) were obtained following surgeries, fine-needle aspirations (FNAs), endobronchial ultrasound with guided transbronchial needle aspiration (EBUS-TBNA) procedures or pleural fluid sampling. The samples were stained with hematoxylin and eosin for the qualitative and quantitative analysis of tumor cells in the analyzed material (including macrodissection in marked out samples) as described previously [76]. The study was approved by the Committee of Ethics of Scientific Research of Collegium Medicum of Nicolaus Copernicus University, Poland (KB 265/2012). The data were analyzed anonymously.
DNA extraction was performed after the microdissection of a region indicated by the pathomorphologist, and the quality and quantity of DNA samples were evaluated as described previously [40].
Copy number analysis by MLPA
MLPA analysis was performed with the use of three in-house designed and generated assays, LC-miR_1, LC-miR_2 and LC-5p. Both LC-miR_1 and LC-miR_2 assays contained 14 probes specific for 7 miRNA genes (two probes for each miRNA or miRNA-cluster gene), 3 probes specific for one of miRNA biogenesis gene, and 4 control probes (located on different chromosomes outside of chromosome 5 and regions of known cancer-related genes). The LC-5p assay contained 6 probes more or less evenly covering the short arm of chromosome 5 (5p-arm), 5 probes specific for DROSHA, 3 probes specific for GOLPH3, and 4 control probes. The detailed characteristics, genomic positions and sequences of all probes used in this study are presented in Supplementary Table S1.
The MLPA probes and the general layout of the probe sets were designed according to a previously proposed strategy [36, 37]. This strategy utilizes only short oligonucleotide probes that can easily be generated via standard chemical synthesis. Briefly, each probe was composed of two half-probes of equal size, and the total probe length ranged from 93 to 164 nt. The target sequences for the probes were selected to avoid SNPs, repeat elements and sequences of extremely high or low GC content. The MLPA probes were synthesized by IDT (Skokie, IL, USA).
The MLPA reactions were run according to the manufacturer's general recommendations (MRC-Holland, Amsterdam, the Netherlands), as described earlier in [37, 77]. All reagents except the probe mixes were purchased form MRC-Holland (http://www.mlpa.com). The products of the MLPA reaction were subsequently diluted 20x in HiDi formamide containing GS Liz600, which was used as a DNA sizing standard, and separated via capillary electrophoresis (POP7 polymer) in an ABI Prism 3130XL apparatus (Applied Biosystems, Carlsbad, CA, USA).
The obtained electropherograms were analyzed using GeneMarker software v2.4.0 (SoftGenetics, State College, PA, USA). The signal intensities (peak heights) were retrieved and transferred to prepared Excel sheets (available upon request). For each individual sample, the signal intensity of each probe was divided by the average signal intensity of the control probes to normalize the obtained values and to equalize run-to-run variation. Due to high signal variation, the control probe 3 (ctrl_3) was excluded from analysis. To calculate relative copy number value of particular probe, the normalized signal of this probe was divided by a corresponding value of this probe in the reference (non-cancer) sample and multiplied by 2. The relative copy number of a particular gene was calculated as an average of the normalized copy number value of 2 or 3 probes specific to this gene. If the difference between the maximum and minimum signal of the averaged probes was higher than one-third of an average copy number value or if the coefficient of variation of the averaged probes was higher than 0.3, the result was excluded from further analyses.
Databases and statistical analysis
All statistical analyses were performed using Statistica (StatSoft, Tulsa, OK) or Prism v. 4.0 (GraphPad, San Diego, CA). All p-values were provided for two-sided tests. All human genome positions indicated in this report refer to the February 2009 (GRCh37/hg19) human reference sequence. The datasets for analysis and visualization of the relationship between copy number category and expression level of DROSHA and DICER1 were obtained from cBioPortal for Cancer Genomics (MemorialSloan-Kettering Cancer Center, New York, NY, USA; http://www.cbioportal.org/) [42, 43] and were analyzed with the use of the cBioPortal Plots tool. The survival analyses of the cancer patients with high and low levels of either DICER1 or DROSHA expression were performed with the use of datasets and tools available in the PPISURV portal (http://www.bioprofiling.de/GEO/PPISURV/ppisurv.html) [45].
ACKNOWLEDGMENTS
This work was supported by National Science Centre 2011/01/B/NZ5/02773, and KNOW program of the Polish Ministry of Science and Higher Education.
CONFLICTS OF INTEREST
All authors declare no conflict of interest.
REFERENCES
1. Torre LA, Bray F, Siegel RL, Ferlay J, Lortet-Tieulent J, Jemal A. Global cancer statistics, 2012. CA Cancer J Clin. 2015; 65:87–108.
2. Hagemann IS, Devarakonda S, Lockwood CM, Spencer DH, Guebert K, Bredemeyer AJ, Al-Kateb H, Nguyen TT, Duncavage EJ, Cottrell CE, Kulkarni S, Nagarajan R, Seibert K, et al. Clinical next-generation sequencing in patients with non-small cell lung cancer. Cancer. 2015; 121:631–639.
3. Liu P, Morrison C, Wang L, Xiong D, Vedell P, Cui P, Hua X, Ding F, Lu Y, James M, Ebben JD, Xu H, Adjei AA, et al. Identification of somatic mutations in non-small cell lung carcinomas using whole-exome sequencing. Carcinogenesis. 2012; 33:1270–1276.
4. Zhao Y, Yang J, Chen Z, Gao Z, Zhou F, Li X, Li J, Shi S, Feng X, Sun N, Yao R, Zhou C, Chang S, et al. Identification of somatic alterations in stage I lung adenocarcinomas by next-generation sequencing. Genes Chromosomes Cancer. 2014; 53:289–298.
5. Ding L, Getz G, Wheeler DA, Mardis ER, McLellan MD, Cibulskis K, Sougnez C, Greulich H, Muzny DM, Morgan MB, Fulton L, Fulton RS, Zhang Q, et al. Somatic mutations affect key pathways in lung adenocarcinoma. Nature. 2008; 455:1069–1075.
6. Imielinski M, Berger AH, Hammerman PS, Hernandez B, Pugh TJ, Hodis E, Cho J, Suh J, Capelletti M, Sivachenko A, Sougnez C, Auclair D, Lawrence MS, et al. Mapping the hallmarks of lung adenocarcinoma with massively parallel sequencing. Cell. 2012; 150:1107–1120.
7. Weir BA, Woo MS, Getz G, Perner S, Ding L, Beroukhim R, Lin WM, Province MA, Kraja A, Johnson LA, Shah K, Sato M, Thomas RK, et al. Characterizing the cancer genome in lung adenocarcinoma. Nature. 2007; 450:893–898.
8. Beroukhim R, Mermel CH, Porter D, Wei G, Raychaudhuri S, Donovan J, Barretina J, Boehm JS, Dobson J, Urashima M, Mc Henry KT, Pinchback RM, Ligon AH, et al. The landscape of somatic copy-number alteration across human cancers. Nature. 2010; 463:899–905.
9. Paez JG, Janne PA, Lee JC, Tracy S, Greulich H, Gabriel S, Herman P, Kaye FJ, Lindeman N, Boggon TJ, Naoki K, Sasaki H, Fujii Y, et al. EGFR mutations in lung cancer: correlation with clinical response to gefitinib therapy. Science. 2004; 304:1497–1500.
10. Soda M, Choi YL, Enomoto M, Takada S, Yamashita Y, Ishikawa S, Fujiwara S, Watanabe H, Kurashina K, Hatanaka H, Bando M, Ohno S, Ishikawa Y, et al. Identification of the transforming EML4-ALK fusion gene in non-small-cell lung cancer. Nature. 2007; 448:561–566.
11. Du L, Pertsemlidis A. microRNAs and lung cancer: tumors and 22-mers. Cancer Metastasis Rev. 2010; 29:109–122.
12. Volinia S, Calin GA, Liu CG, Ambs S, Cimmino A, Petrocca F, Visone R, Iorio M, Roldo C, Ferracin M, Prueitt RL, Yanaihara N, Lanza G, et al. A microRNA expression signature of human solid tumors defines cancer gene targets. Proc Natl Acad Sci U S A. 2006; 103:2257–2261.
13. Griffiths-Jones S. The microRNA Registry. Nucleic Acids Res. 2004; 32:D109–111.
14. Kozomara A, Griffiths-Jones S. miRBase: annotating high confidence microRNAs using deep sequencing data. Nucleic acids research. 2014; 42:D68–73.
15. Bartel DP. MicroRNAs: genomics, biogenesis, mechanism, and function. Cell. 2004; 116:281–297.
16. Harfe BD. MicroRNAs in vertebrate development. Curr Opin Genet Dev. 2005; 15:410–415.
17. Boehm M, Slack FJ. MicroRNA control of lifespan and metabolism. Cell Cycle. 2006; 5:837–840.
18. Carleton M, Cleary MA, Linsley PS. MicroRNAs and cell cycle regulation. Cell Cycle. 2007; 6:2127–2132.
19. Calin GA, Dumitru CD, Shimizu M, Bichi R, Zupo S, Noch E, Aldler H, Rattan S, Keating M, Rai K, Rassenti L, Kipps T, Negrini M, et al. Frequent deletions and down-regulation of micro- RNA genes miR15 and miR16 at 13q14 in chronic lymphocytic leukemia. Proc Natl Acad Sci U S A. 2002; 99:15524–15529.
20. Esquela-Kerscher A, Slack FJ. Oncomirs - microRNAs with a role in cancer. Nat Rev Cancer. 2006; 6:259–269.
21. Hayashita Y, Osada H, Tatematsu Y, Yamada H, Yanagisawa K, Tomida S, Yatabe Y, Kawahara K, Sekido Y, Takahashi T. A polycistronic microRNA cluster, miR-17–92, is overexpressed in human lung cancers and enhances cell proliferation. Cancer Res. 2005; 65:9628–9632.
22. Zandberga E, Kozirovskis V, Abols A, Andrejeva D, Purkalne G, Line A. Cell-free microRNAs as diagnostic, prognostic, and predictive biomarkers for lung cancer. Genes Chromosomes Cancer. 2013; 52:356–369.
23. Shen J, Todd NW, Zhang H, Yu L, Lingxiao X, Mei Y, Guarnera M, Liao J, Chou A, Lu CL, Jiang Z, Fang H, Katz RL, et al. Plasma microRNAs as potential biomarkers for non-small-cell lung cancer. Lab Invest. 2011; 91:579–587.
24. Yanaihara N, Caplen N, Bowman E, Seike M, Kumamoto K, Yi M, Stephens RM, Okamoto A, Yokota J, Tanaka T, Calin GA, Liu CG, Croce CM, et al. Unique microRNA molecular profiles in lung cancer diagnosis and prognosis. Cancer Cell. 2006; 9:189–198.
25. Kumarswamy R, Mudduluru G, Ceppi P, Muppala S, Kozlowski M, Niklinski J, Papotti M, Allgayer H. MicroRNA-30a inhibits epithelial-to-mesenchymal transition by targeting Snai1 and is downregulated in non-small cell lung cancer. Int J Cancer. 2012; 130:2044–2053.
26. Kumarswamy R, Volkmann I, Thum T. Regulation and function of miRNA-21 in health and disease. RNA Biol. 2011; 8:706–713.
27. Zernecke A, Bidzhekov K, Noels H, Shagdarsuren E, Gan L, Denecke B, Hristov M, Koppel T, Jahantigh MN, Lutgens E, Wang S, Olson EN, Schober A, et al. Delivery of microRNA-126 by apoptotic bodies induces CXCL12-dependent vascular protection. Sci Signal. 2009; 2. ra81.
28. Diederichs S, Haber DA. Sequence variations of microRNAs in human cancer: alterations in predicted secondary structure do not affect processing. Cancer Res. 2006; 66:6097–6104.
29. Calin GA, Sevignani C, Dumitru CD, Hyslop T, Noch E, Yendamuri S, Shimizu M, Rattan S, Bullrich F, Negrini M, Croce CM. Human microRNA genes are frequently located at fragile sites and genomic regions involved in cancers. Proc Natl Acad Sci U S A. 2004; 101:2999–3004.
30. Zhang L, Huang J, Yang N, Greshock J, Megraw MS, Giannakakis A, Liang S, Naylor TL, Barchetti A, Ward MR, Yao G, Medina A, O’Brien-Jenkins A, et al. microRNAs exhibit high frequency genomic alterations in human cancer. Proc Natl Acad Sci U S A. 2006; 103:9136–9141.
31. Huppi K, Volfovsky N, Mackiewicz M, Runfola T, Jones TL, Martin SE, Stephens R, Caplen NJ. MicroRNAs and genomic instability. Semin Cancer Biol. 2007; 17:65–73.
32. Zhang L, Coukos G. MicroRNAs: a new insight into cancer genome. Cell Cycle. 2006; 5:2216–2219.
33. Kan CW, Howell VM, Hahn MA, Marsh DJ. Genomic alterations as mediators of miRNA dysregulation in ovarian cancer. Genes Chromosomes Cancer. 2015; 54:1–19.
34. Guan P, Yin Z, Li X, Wu W, Zhou B. Meta-analysis of human lung cancer microRNA expression profiling studies comparing cancer tissues with normal tissues. J Exp Clin Cancer Res. 2012; 31:54.
35. Vosa U, Vooder T, Kolde R, Vilo J, Metspalu A, Annilo T. Meta-analysis of microRNA expression in lung cancer. Int J Cancer. 2013; 132:2884–2893.
36. Marcinkowska M, Wong KK, Kwiatkowski DJ, Kozlowski P. Design and generation of MLPA probe sets for combined copy number and small-mutation analysis of human genes: EGFR as an example. ScientificWorldJournal. 2010; 10:2003–2018.
37. Kozlowski P, Roberts P, Dabora S, Franz D, Bissler J, Northrup H, Au KS, Lazarus R, Domanska-Pakiela D, Kotulska K, Jozwiak S, Kwiatkowski DJ. Identification of 54 large deletions/duplications in TSC1 and TSC2 using MLPA, and genotype-phenotype correlations. Hum Genet. 2007; 121:389–400.
38. Lacle MM, Kornegoor R, Moelans CB, Maes-Verschuur AH, van der Pol C, Witkamp AJ, van der Wall E, Rueschoff J, Buerger H, van Diest PJ. Analysis of copy number changes on chromosome 16q in male breast cancer by multiplex ligation-dependent probe amplification. Mod Pathol. 2013; 26:1461–1467.
39. Rygiel AM, Milano F, Ten Kate FJ, Schaap A, Wang KK, Peppelenbosch MP, Bergman JJ, Krishnadath KK. Gains and amplifications of c-myc, EGFR, and 20.q13 loci in the no dysplasia-dysplasia-adenocarcinoma sequence of Barrett’s esophagus. Cancer Epidemiol Biomarkers Prev. 2008; 17:1380–1385.
40. Lewandowska MA, Czubak K, Klonowska K, Jozwicki W, Kowalewski J, Kozlowski P. The Use of a Two-Tiered Testing Strategy for the Simultaneous Detection of Small EGFR Mutations and EGFR Amplification in Lung Cancer. PloS One. 2015; 10:e0117983.
41. Scott KL, Kabbarah O, Liang MC, Ivanova E, Anagnostou V, Wu J, Dhakal S, Wu M, Chen S, Feinberg T, Huang J, Saci A, Widlund HR, et al. GOLPH3 modulates mTOR signalling and rapamycin sensitivity in cancer. Nature. 2009; 459:1085–1090.
42. Cerami E, Gao J, Dogrusoz U, Gross BE, Sumer SO, Aksoy BA, Jacobsen A, Byrne CJ, Heuer ML, Larsson E, Antipin Y, Reva B, Goldberg AP, et al. The cBio cancer genomics portal: an open platform for exploring multidimensional cancer genomics data. Cancer Discov. 2012; 2:401–404.
43. Gao J, Aksoy BA, Dogrusoz U, Dresdner G, Gross B, Sumer SO, Sun Y, Jacobsen A, Sinha R, Larsson E, Cerami E, Sander C, Schultz N. Integrative analysis of complex cancer genomics and clinical profiles using the cBioPortal. Sci Signal. 2013; 6:pl1.
44. Cancer Genome Atlas Research N. Comprehensive genomic characterization defines human glioblastoma genes and core pathways. Nature. 2008; 455:1061–1068.
45. Antonov AV, Krestyaninova M, Knight RA, Rodchenkov I, Melino G, Barlev NA. PPISURV: a novel bioinformatics tool for uncovering the hidden role of specific genes in cancer survival outcome. Oncogene. 2014; 33:1621–1628.
46. Qin AY, Zhang XW, Liu L, Yu JP, Li H, Wang SZ, Ren XB, Cao S. MiR-205 in cancer: an angel or a devil? Eur J Cell Biol. 2013; 92:54–60.
47. Olive V, Li Q, He L. mir-17–92: a polycistronic oncomir with pleiotropic functions. Immunol Rev. 2013; 253:158–166.
48. Chan JA, Krichevsky AM, Kosik KS. MicroRNA-21 is an antiapoptotic factor in human glioblastoma cells. Cancer Res. 2005; 65:6029–6033.
49. Liu ZL, Wang H, Liu J, Wang ZX. MicroRNA-21 (miR-21) expression promotes growth, metastasis, and chemo- or radioresistance in non-small cell lung cancer cells by targeting PTEN. Mol Cell Biochem. 2013; 372:35–45.
50. Zhang JG, Wang JJ, Zhao F, Liu Q, Jiang K, Yang GH. MicroRNA-21 (miR-21) represses tumor suppressor PTEN and promotes growth and invasion in non-small cell lung cancer (NSCLC). Clin Chim Acta. 2010; 411:846–852.
51. Osada H, Takahashi T. let-7 and miR-17–92: small-sized major players in lung cancer development. Cancer Sci. 2011; 102:9–17.
52. Tam W, Ben-Yehuda D, Hayward WS. bic, a novel gene activated by proviral insertions in avian leukosis virus-induced lymphomas, is likely to function through its noncoding RNA. Mol Cell Biol. 1997; 17:1490–1502.
53. Jiang S, Zhang HW, Lu MH, He XH, Li Y, Gu H, Liu MF, Wang ED. MicroRNA-155 functions as an OncomiR in breast cancer by targeting the suppressor of cytokine signaling 1 gene. Cancer Res. 2010; 70:3119–3127.
54. Kong W, He L, Coppola M, Guo J, Esposito NN, Coppola D, Cheng JQ. MicroRNA-155 regulates cell survival, growth, and chemosensitivity by targeting FOXO3a in breast cancer. J Biol Chem. 2010; 285:17869–17879.
55. Kong W, He L, Richards EJ, Challa S, Xu CX, Permuth-Wey J, Lancaster JM, Coppola D, Sellers TA, Djeu JY, Cheng JQ. Upregulation of miRNA-155 promotes tumour angiogenesis by targeting VHL and is associated with poor prognosis and triple-negative breast cancer. Oncogene. 2014; 33:679–689.
56. Ebrahimi F, Gopalan V, Smith RA, Lam AK. miR-126 in human cancers: clinical roles and current perspectives. Exp Mol Pathol. 2014; 96:98–107.
57. Li N, Kaur S, Greshock J, Lassus H, Zhong X, Wang Y, Leminen A, Shao Z, Hu X, Liang S, Katsaros D, Huang Q, Butzow R, et al. A combined array-based comparative genomic hybridization and functional library screening approach identifies mir-30d as an oncomir in cancer. Cancer Res. 2012; 72:154–164.
58. Bracken CP, Li X, Wright JA, Lawrence DM, Pillman KA, Salmanidis M, Anderson MA, Dredge BK, Gregory PA, Tsykin A, Neilsen C, Thomson DW, Bert AG, et al. Genome-wide identification of miR-200 targets reveals a regulatory network controlling cell invasion. EMBO J. 2014; 33:2040–2056.
59. Kumar MS, Pester RE, Chen CY, Lane K, Chin C, Lu J, Kirsch DG, Golub TR, Jacks T. Dicer1 functions as a haploinsufficient tumor suppressor. Genes Dev. 2009; 23:2700–2704.
60. Lu J, Getz G, Miska EA, Alvarez-Saavedra E, Lamb J, Peck D, Sweet-Cordero A, Ebert BL, Mak RH, Ferrando AA, Downing JR, Jacks T, Horvitz HR, et al. MicroRNA expression profiles classify human cancers. Nature. 2005; 435:834–838.
61. Kumar MS, Lu J, Mercer KL, Golub TR, Jacks T. Impaired microRNA processing enhances cellular transformation and tumorigenesis. Nat Genet. 2007; 39:673–677.
62. Gaur A, Jewell DA, Liang Y, Ridzon D, Moore JH, Chen C, Ambros VR, Israel MA. Characterization of microRNA expression levels and their biological correlates in human cancer cell lines. Cancer Res. 2007; 67:2456–2468.
63. Hill DA, Ivanovich J, Priest JR, Gurnett CA, Dehner LP, Desruisseau D, Jarzembowski JA, Wikenheiser-Brokamp KA, Suarez BK, Whelan AJ, Williams G, Bracamontes D, Messinger Y, et al. DICER1 mutations in familial pleuropulmonary blastoma. Science. 2009; 325:965.
64. Pugh TJ, Yu W, Yang J, Field AL, Ambrogio L, Carter SL, Cibulskis K, Giannikopoulos P, Kiezun A, Kim J, McKenna A, Nickerson E, Getz G, et al. Exome sequencing of pleuropulmonary blastoma reveals frequent biallelic loss of TP53 and two hits in DICER1 resulting in retention of 5p-derived miRNA hairpin loop sequences. Oncogene. 2014; 33:5295–5302.
65. Heravi-Moussavi A, Anglesio MS, Cheng SW, Senz J, Yang W, Prentice L, Fejes AP, Chow C, Tone A, Kalloger SE, Hamel N, Roth A, Ha G, et al. Recurrent somatic DICER1 mutations in nonepithelial ovarian cancers. N Engl J Med. 2012; 366:234–242.
66. Torrezan GT, Ferreira EN, Nakahata AM, Barros BD, Castro MT, Correa BR, Krepischi AC, Olivieri EH, Cunha IW, Tabori U, Grundy PE, Costa CM, de Camargo B, et al. Recurrent somatic mutation in DROSHA induces microRNA profile changes in Wilms tumour. Nat Commun. 2014; 5:4039.
67. Seki M, Yoshida K, Shiraishi Y, Shimamura T, Sato Y, Nishimura R, Okuno Y, Chiba K, Tanaka H, Kato K, Kato M, Hanada R, Nomura Y, et al. Biallelic DICER1 mutations in sporadic pleuropulmonary blastoma. Cancer Res. 2014; 74:2742–2749.
68. Rakheja D, Chen KS, Liu Y, Shukla AA, Schmid V, Chang TC, Khokhar S, Wickiser JE, Karandikar NJ, Malter JS, Mendell JT, Amatruda JF. Somatic mutations in DROSHA and DICER1 impair microRNA biogenesis through distinct mechanisms in Wilms tumours. Nat Commun. 2014; 2:4802.
69. Foulkes WD, Priest JR, Duchaine TF. DICER1: mutations, microRNAs and mechanisms. Nat Rev Cancer. 2014; 14:662–672.
70. Kurzynska-Kokorniak A, Koralewska N, Pokornowska M, Urbanowicz A, Tworak A, Mickiewicz A, Figlerowicz M. The many faces of Dicer: the complexity of the mechanisms regulating Dicer gene expression and enzyme activities. Nucleic Acids Res. 2015; 1.
71. Anglesio MS, Wang Y, Yang W, Senz J, Wan A, Heravi-Moussavi A, Salamanca C, Maines-Bandiera S, Huntsman DG, Morin GB. Cancer-associated somatic DICER1 hotspot mutations cause defective miRNA processing and reverse-strand expression bias to predominantly mature 3p strands through loss of 5p strand cleavage. J Pathol. 2013; 229:400–409.
72. Gurtan AM, Lu V, Bhutkar A, Sharp PA. In vivo structure-function analysis of human Dicer reveals directional processing of precursor miRNAs. RNA. 2012; 18:1116–1122.
73. Muralidhar B, Goldstein LD, Ng G, Winder DM, Palmer RD, Gooding EL, Barbosa-Morais NL, Mukherjee G, Thorne NP, Roberts I, Pett MR, Coleman N. Global microRNA profiles in cervical squamous cell carcinoma depend on Drosha expression levels. J Pathol. 2007; 212:368–377.
74. Muralidhar B, Winder D, Murray M, Palmer R, Barbosa-Morais N, Saini H, Roberts I, Pett M, Coleman N. Functional evidence that Drosha overexpression in cervical squamous cell carcinoma affects cell phenotype and microRNA profiles. J Pathol. 2011; 224:496–507.
75. Sugito N, Ishiguro H, Kuwabara Y, Kimura M, Mitsui A, Kurehara H, Ando T, Mori R, Takashima N, Ogawa R, Fujii Y. RNASEN regulates cell proliferation and affects survival in esophageal cancer patients. Clin Cancer Res. 2006; 12:7322–7328.
76. Lewandowska MA, Jozwicki W, Zurawski B. KRAS and BRAF mutation analysis in colorectal adenocarcinoma specimens with a low percentage of tumor cells. Mol Diagn Ther. 2013; 17:193–203.
77. Schouten JP, McElgunn CJ, Waaijer R, Zwijnenburg D, Diepvens F, Pals G. Relative quantification of 40 nucleic acid sequences by multiplex ligation-dependent probe amplification. Nucleic Acids Res. 2002; 30:e57.
78. Futreal PA, Coin L, Marshall M, Down T, Hubbard T, Wooster R, Rahman N, Stratton MR. A census of human cancer genes. Nat Rev Cancer. 2004; 4:177–183.
79. Cancer Genome Atlas Research N. Comprehensive molecular profiling of lung adenocarcinoma. Nature. 2014; 511:543–550.
80. Saito M, Schetter AJ, Mollerup S, Kohno T, Skaug V, Bowman ED, Mathe EA, Takenoshita S, Yokota J, Haugen A, Harris CC. The association of microRNA expression with prognosis and progression in early-stage, non-small cell lung adenocarcinoma: a retrospective analysis of three cohorts. Clin Cancer Res. 2011; 17:1875–1882.
81. Yang M, Shen H, Qiu C, Ni Y, Wang L, Dong W, Liao Y, Du J. High expression of miR-21 and miR-155 predicts recurrence and unfavourable survival in non-small cell lung cancer. Eur J Cancer. 2013; 49:604–615.
82. Yu L, Todd NW, Xing L, Xie Y, Zhang H, Liu Z, Fang H, Zhang J, Katz RL, Jiang F. Early detection of lung adenocarcinoma in sputum by a panel of microRNA markers. Int J Cancer. 2010; 127:2870–2878.
83. Wang Q, Wang S, Wang H, Li P, Ma Z. MicroRNAs: novel biomarkers for lung cancer diagnosis, prediction and treatment. Exp Biol Med (Maywood). 2012; 237:227–235.
84. Barbarotto E, Schmittgen TD, Calin GA. MicroRNAs and cancer: profile, profile, profile. Int J Cancer. 2008; 122:969–977.
85. Zheng D, Haddadin S, Wang Y, Gu LQ, Perry MC, Freter CE, Wang MX. Plasma microRNAs as novel biomarkers for early detection of lung cancer. Int J Clin Exp Pathol. 2011; 4:575–586.
86. Lin Q, Mao W, Shu Y, Lin F, Liu S, Shen H, Gao W, Li S, Shen D. A cluster of specified microRNAs in peripheral blood as biomarkers for metastatic non-small-cell lung cancer by stem-loop RT-PCR. J Cancer Res Clin Oncol. 2012; 138:85–93.
87. Diaz-Garcia CV, Agudo-Lopez A, Perez C, Lopez-Martin JA, Rodriguez-Peralto JL, de Castro J, Cortijo A, Martinez-Villanueva M, Iglesias L, Garcia-Carbonero R, Fresno Vara JA, Gamez-Pozo A, Palacios J, et al. DICER1, DROSHA, and miRNAs in patients with non-small cell lung cancer: implications for outcomes and histologic classification. Carcinogenesis. 2013; 34:1031–1038.
88. Karube Y, Tanaka H, Osada H, Tomida S, Tatematsu Y, Yanagisawa K, Yatabe Y, Takamizawa J, Miyoshi S, Mitsudomi T, Takahashi T. Reduced expression of Dicer associated with poor prognosis in lung cancer patients. Cancer Sci. 2005; 96:111–115.
89. Chiosea S, Jelezcova E, Chandran U, Luo J, Mantha G, Sobol RW, Dacic S. Overexpression of Dicer in precursor lesions of lung adenocarcinoma. Cancer Res. 2007; 67:2345–2350.
90. Khoshnaw SM, Rakha EA, Abdel-Fatah TM, Nolan CC, Hodi Z, Macmillan DR, Ellis IO, Green AR. Loss of Dicer expression is associated with breast cancer progression and recurrence. Breast Cancer Res Treat. 2012; 135:403–413.
91. Han Y, Liu Y, Gui Y, Cai Z. Inducing cell proliferation inhibition and apoptosis via silencing Dicer, Drosha, and Exportin 5 in urothelial carcinoma of the bladder. J Surg Oncol. 2013; 107:201–205.
92. Sand M, Gambichler T, Skrygan M, Sand D, Scola N, Altmeyer P, Bechara FG. Expression levels of the microRNA processing enzymes Drosha and dicer in epithelial skin cancer. Cancer Invest. 2010; 28:649–653.
93. Avery-Kiejda KA, Braye SG, Forbes JF, Scott RJ. The expression of Dicer and Drosha in matched normal tissues, tumours and lymph node metastases in triple negative breast cancer. BMC Cancer. 2014; 14:253.