
INTRODUCTION
Voltage-gated potassium (KV) channels are among the most diverse ion channel families [29]. In excitable cells, KV channels regulate the membrane potential and contribute to the generation and propagation of action potentials [28]. In non-excitable cells, they are thought to be involved in regulating intracellular Ca2+ concentration, pH and cell volume, as well as cell-cycle progression, differentiation, and apoptosis [28, 29, 39]. Recent studies have also shown that KV channels play an important role in cancer development and cell proliferation [22]. A variety of potassium channels, including the KV channels KV1.1, KV1.3, KV4.1, KV10.1 and KV11.1, are thought to enhance cell proliferation [1, 12, 14, 19, 35]. However, how various K+ channels influence the cell cycle and cell proliferation remains elusive. The classic explanation is that K+ channels contribute to proliferation through permeation-related mechanisms that include membrane hyperpolarization, driving force generation for Ca2+, and cell volume regulation [35, 39]. However, recent studies have shown that non-conducting K+ channel mutants retain their proproliferative properties [3, 9, 26], suggesting that a non-conducting mechanism may be involved in K+ channel regulation of cell proliferation.
KV9.3 (KCNS3) is an electronically silent KV α-subunit that does not form electronically functional channels when expressed as a homomultimer [30]. Silent KV9.3 α-subunits share substantial structural homology with KV2.1 channels and form heteromultimers with this latter subfamily, modulating their electrophysiological and pharmacological properties [30]. Compared with homomeric KV2.1 channels, heteromeric KV2.1/KV9.3 channels exhibit increased current amplitude, more rapid activation, and an altered steady-state activation shifted towards more negative values [30]. KV9.3, first cloned from rat pulmonary artery myocytes, is expressed most abundantly in the lung [30]. KV9.3 has also been detected in other tissues, including the rat brain, cerebral vascular smooth muscle, intestine, stomach, kidney and testes, and human urinary bladder smooth muscle, neurons, and the placental vasculature [6, 10, 37, 42]. There are also reports of KV9.3 expression in cancer cells [33, 34]. Although there are several reports on the role of KV9.3 in connection with KV2.1 in excitable cells, such as myocytes and neurons [6, 7, 18, 30, 42], the role of KV9.3 alone in cancer cells has not been studied.
In the present study, we investigated KV9.3 function in human HCT15 colon carcinoma and A549 lung carcinoma cells by specifically silencing KV9.3 using small interfering RNA (siRNA) and short-hairpin RNA (shRNA).
RESULTS
Expression of KV9.3 in HCT15 and A549 cells
KV9.3 mRNA expression was analyzed by RT-PCR. Using KV9.3-specific primers, we confirmed KV9.3 mRNA expression in HCT15 and A549 cells (Fig. 1). KV2.1 mRNA expression was also detected in both cell lines (Supplementary Fig. S1).
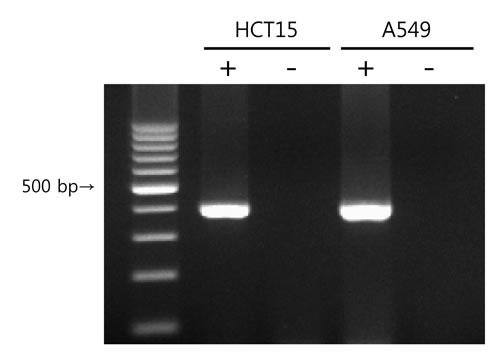
Figure 1: KV9.3 mRNA expression in HCT15 and A549 cells. PCR was performed using cDNA synthesized from total RNA isolates and the PCR products were run on 2% agarose gel. Negative controls without reverse transcriptase (-) were also made to confirm that there was no genomic DNA contamination.
siRNA-mediated KV9.3 knockdown decreases the viability of HCT15 and A549 cells
To examine the role of KV9.3 in cell viability, we transiently down-regulated KV9.3 using KV9.3 siRNA and performed MTT cell viability assays. siRNA treatment decreased KV9.3 mRNA levels by 75% (n = 4) and 85% (n = 4) in HCT15 and A549 cells, respectively (Fig. 2A). MTT assays revealed that KV9.3 siRNA treatment reduced the viability of HCT15 and A549 cells by 22% and 29%, respectively (n = 9, three independent experiments), compared to treatment with negative control siRNA (Fig. 2B). siRNA-mediated KV9.3 knockdown did not affect KV2.1 mRNA expression levels in HCT15 or A549 cell lines (Supplementary Fig. S2).
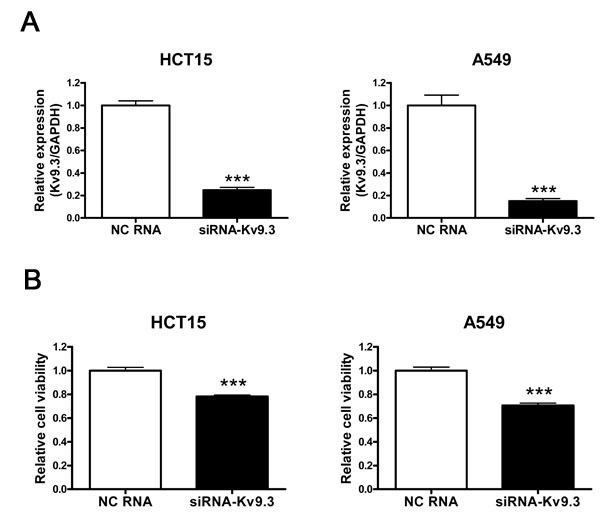
Figure 2: siRNA-KV9.3 reduces cell viability of HCT15 and A549 cells. A. Decreased expression of KV9.3 mRNA by KV9.3 siRNA treatment in HCT15 and A549 cells. The cells were harvested 48 h after KV9.3 siRNA or negative control RNA transfection. Real-time PCR was performed for 45 cycles to quantify the KV9.3 mRNA level. Each bar represents the mean ± S.E.M. (n=4, ***P < 0.001 by the Student’s t-test versus negative control RNA treated group, NC: negative control) B. KV9.3 knockdown decreases cell viability of HCT15 and A549 cells. Cell viability was measured by MTT assay 72 h after KV9.3 siRNA transfection. Each bar represents the mean ± S.E.M. (n=9, three independent experiments, ***P < 0.001 by the Student’s t-test versus negative control RNA treated group).
siRNA-mediated KV9.3 knockdown induces G0/G1 cell cycle arrest in HCT15 and A549 cells but has no effect on apoptosis
To investigate whether the decrease in cell viability induced by KV9.3 siRNA treatment was attributable to alterations in the cell cycle or induction of apoptosis, we performed cell cycle and apoptosis analyses using flow cytometry. Fig. 3 shows that treatment with KV9.3 siRNA altered the distribution of cell cycle phases in both cell lines. KV9.3 knockdown increased the proportion of G0/G1-phase cells from 55.5% to 62.0% in HCT15 and from 57.9% to 67.3% in A549 cells. This increase was associated with a corresponding reduction in S-phase cells; the percentage of cells in this population decreased from 29.5% to 21.6% in HCT15 cells, and from 33.7% to 19.8% in A549 cells. KV9.3 knockdown had no significant effect on the G2/M phase distribution.
An analysis of apoptosis using annexin V and PI double-staining revealed no difference in the percentage of apoptotic cells between KV9.3-knockdown and control groups (Fig. 4).
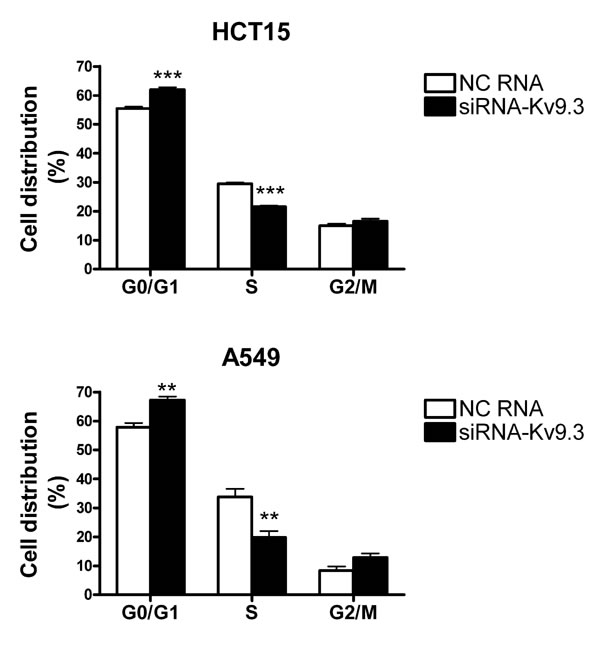
Figure 3: KV9.3 knockdown induces alteration of cell cycle in HCT15 and A549 cells. Cell cycle was analyzed by flow cytometry 72 h after KV9.3 siRNA transfection. Each bar represents the mean ± S.E.M. (n=4, three independent experiments, **P < 0.01, ***P < 0.001 by the Student’s t-test versus negative control RNA treated group, NC: negative control).
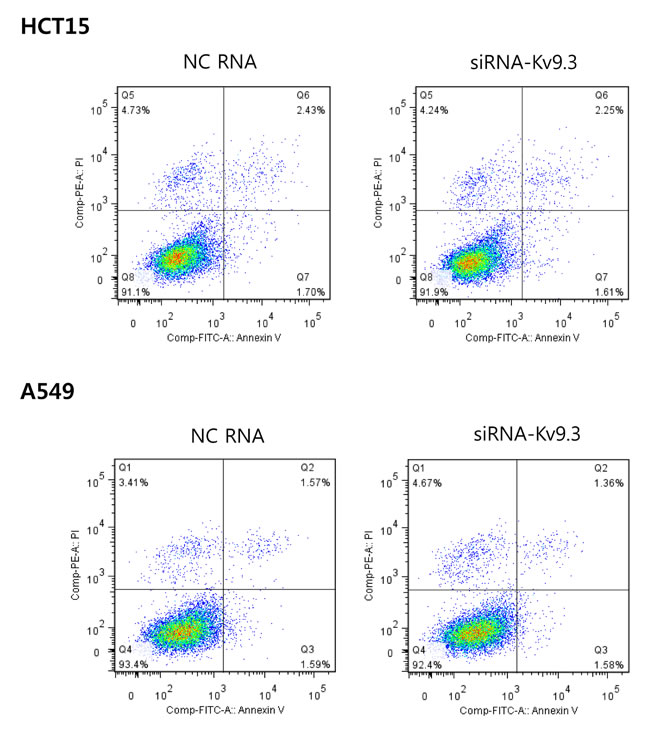
Figure 4: KV9.3 knockdown does not have a significant effect on apoptosis in HCT15 and A549 cells. After KV9.3 siRNA treatment (72 h), the cells were stained by annexin V and PI (double stain), and apoptosis was analyzed by flow cytometry. The percentage of cells in the lower right quadrant (annexin V positive, PI negative) was measured. No statistical difference was noted between the negative control RNA and KV9.3 siRNA treated group when compared by Student’s t-test. (n=4, two independent experiments, NC: negative control).
siRNA-mediated KV9.3 knockdown modulates expression of cell cycle regulatory proteins related to G1-S phase transition in HCT15 and A549 cells
Next, we analyzed KV9.3 siRNA-induced changes in the expression of cell cycle regulatory proteins that participate in G1-S transition, examining the relative protein levels of cyclin D3, CDK2, p21, and p27. In HCT15 cells, KV9.3 knockdown significantly decreased cyclin D3 protein levels (0.44-fold relative to controls) and markedly increased p21 (2.7-fold) and p27 (2.9-fold) levels. CDK2 expression showed little change with KV9.3 knockdown in these cells. In A549 cells, KV9.3 knockdown decreased the expression of cyclin D3 and CDK2 protein (0.64-fold and 0.59-fold relative to controls, respectively) and increased the expression of p21 protein 2.41-fold. The expression level of p27 trended higher following KV9.3 knockdown, but this difference did not reach statistical significance (Fig. 5).
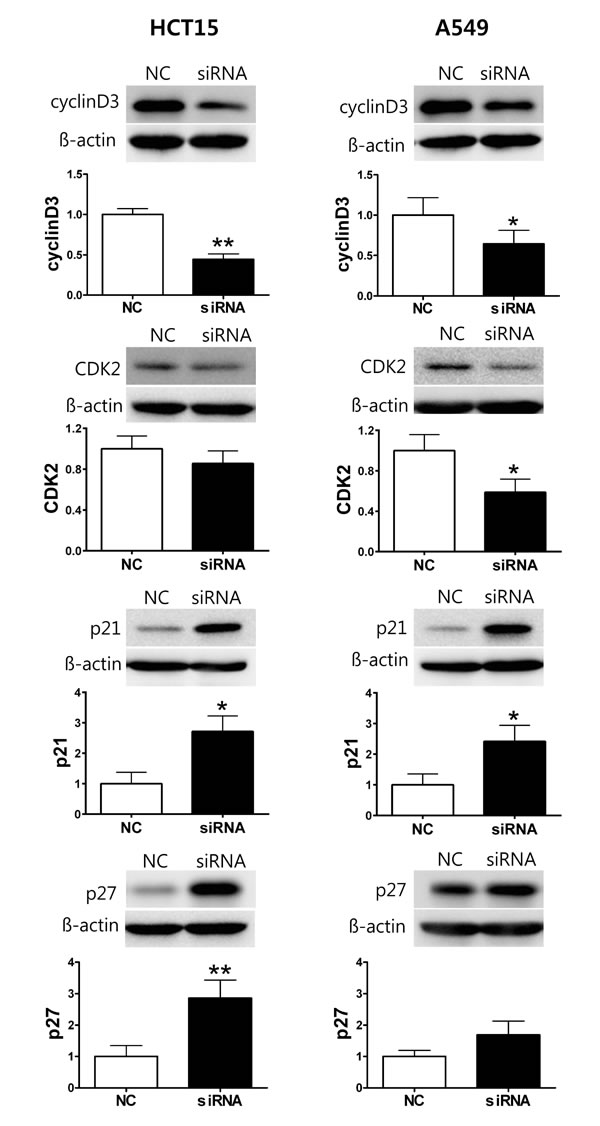
Figure 5: KV9.3 knockdown changes protein expression level of cell cycle regulatory proteins in HCT15 and A549 cells. The cells were harvested 72 h after KV9.3 siRNA transfection. Western blot was performed to examine expression of cyclin D3, CDK2, p21, p27. ß-actin was used as a loading control and, the protein expression level was normalized to that of the negative control RNA treatment group. Each bar represents the mean ± S.E.M. (n=3-5, *P < 0.05, **P < 0.01 by the paired Student’s t-test versus negative control RNA treated group, NC: negative control RNA, siRNA: KV9.3 siRNA).
Stable knockdown of KV9.3 using shRNA in HCT15 and A549 cells inhibits tumor growth in vivo
To investigate whether silencing KV9.3 reduces tumor growth in vivo, we constructed mouse xenograft using stable KV9.3 knockdown HCT15 and A549 cell line. shRNA transfection decreased KV9.3 mRNA levels by 44% (n = 4) and 55% (n = 4) in HCT15 and A549 cells, respectively (Fig. 6A). In both cells, there was a tendency for stable KV9.3 knockdown cell lines exhibiting slower tumor growth in vivo compared to control cell lines. Statistical significance was noted on the 9th week in HCT15 cells and on the 5th week in A549 cells (n=5) (Fig. 6B).
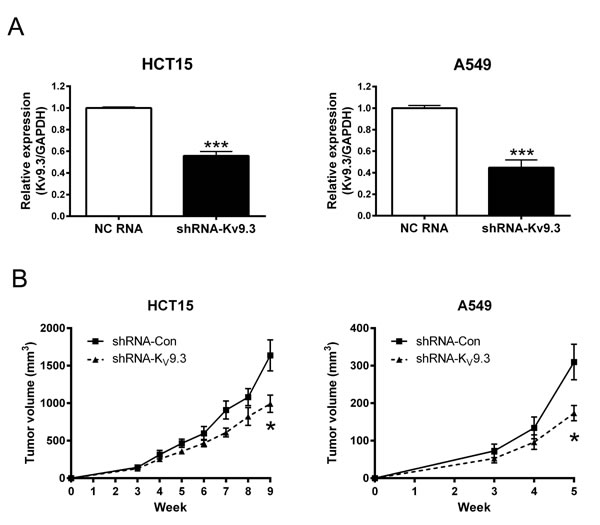
Figure 6: Stable knockdown of KV9.3 using shRNA in HCT15 and A549 cells inhibits tumor growth in vivo. A. Decreased expression of KV9.3 mRNA by KV9.3 shRNA treatment in HCT15 and A549 cells. Each bar represents the mean ± S.E.M. (n=4, ***P < 0.001 by the Student’s t-test versus negative control shRNA treated group) B. Slower tumor growth in vivo of stable KV9.3 knockdown HCT15 and A549 cells. Each bar represents the mean ± S.E.M. (n=5, *P < 0.05 by the Student’s t-test versus negative control shRNA treated group at that week).
Inhibition of Sp1 by mithramycin A reduces KV9.3 transcription in HCT15 and A549 cells
We searched for possible transcription factor binding sites in the promoter region of the KCNS3 gene encoding KV9.3 using the TFSEARCH program and found several possible Sp1 binding sites (G-C rich regions). To determine if Sp1 binds to the promoter region of KCNS3, we performed ChIP assay using a Sp1 antibody. These assays revealed that Sp1 bound to a predicted G-C rich binding site in both cell lines (Fig. 7A). To assess the functional consequences of this Sp1 binding, we tested whether inhibition of Sp1 with mithramycin A affected the expression of KV9.3. In both cells lines, mithramycin A significantly reduced the expression level of KV9.3 in a concentration-dependent manner (Fig. 7B). In HCT15 cells, 100 and 250 nM mithramycin A decreased KV9.3 expression by 0.43-fold and 0.24-fold relative to that in controls, respectively, whereas in A549 cells, the corresponding values were 0.24-fold and 0.16-fold (n = 4, two independent experiments).
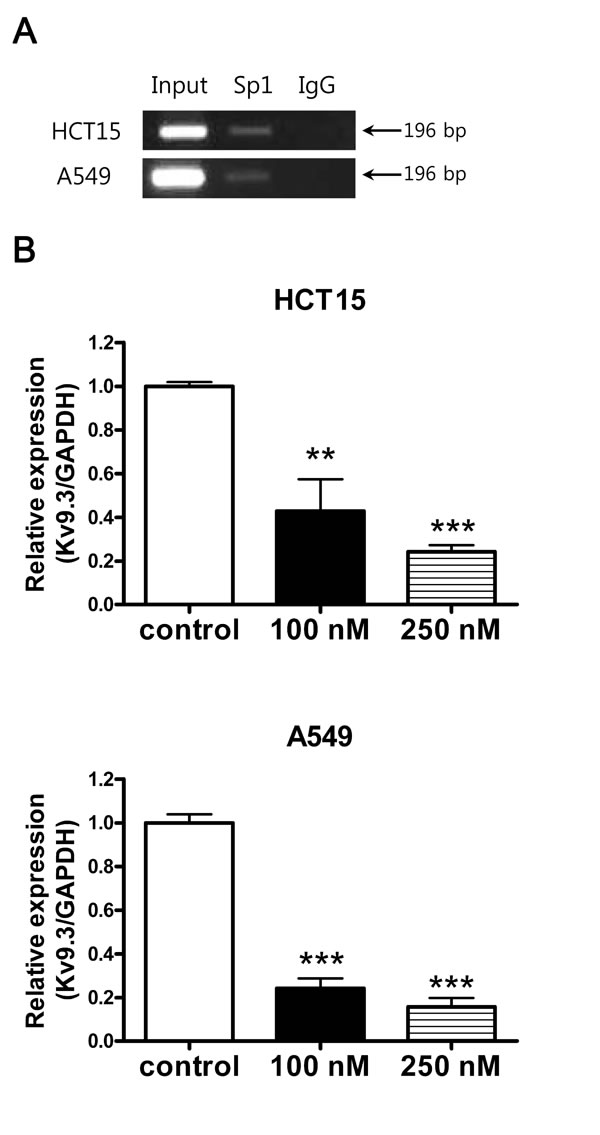
Figure 7: Inhibition of KV9.3 gene expression by Sp1 inhibitor, mithramycin A. A. Sp1 binds to KV9.3 promoter region. ChIP assay was performed with the anti-Sp1 or nonspecific rabbit (negative control) antibody. The GC rich region in the KV9.3 promoter region was amplified by RT-PCR. B. Inhibition of Sp1 by mithramycin A reduces Kv9.3 expression in HCT15 and A549 cells. The cells were treated with mithramycin A (100 nM, 250 nM) for 24 h and KV9.3 mRNA expression level was measured by real-time PCR. Each bar represents the mean ± S.E.M. (n=4, two independent experiments, **P < 0.01, ***P < 0.001 by the Student’s t-test versus control group).
DISCUSSION
The role of KV9.3 has been investigated in excitable cells in conjunction with KV2.1 [6, 7, 16-18, 30, 42]. However, it has not been studied in non-excitable cancer cells in the context of proliferation. In this study, we focused on the effect of KV9.3 on proliferation in HCT15 and A549 cells, demonstrating that (i) KV9.3 transcripts are expressed in HCT15 and A549 cells; (ii) KV9.3 knockdown decreases the viability of HCT15 and A549 cells by inducing cell cycle arrest in G0/G1 phase with no change in the proportion of apoptotic cells; (iii) stable KV9.3 knockdown HCT15 and A549 cells show decreased tumor growth in mouse xenograft; and (iv) the transcription factor Sp1 potentially regulates the expression of KV9.3.
We confirmed that KV9.3 mRNA is expressed in HCT15 and A549 cells. Similarly, previous reports detected KV9.3 mRNA in colon cancer and uterine cancer cells [33, 34]. Unfortunately, the unavailability of a commercial KV9.3 antibody suitable for Western blot applications prevented us from confirming KV9.3 protein expression in HCT15 and A549 cells. In addition, we provided the first demonstration that silencing KV9.3 using siRNA exerted an anti-proliferative effect in HCT15 and A549 cells. To the best of our knowledge, all previous reports regarding the role of KV9.3 were related to the properties of KV9.3 assembling into heterotetrameric channels with KV2.1 and modulating its electrophysiological properties [6, 7, 10, 16, 18, 30, 42]. These properties of KV9.3 have been demonstrated in excitable cells and linked to several pathological and physiological processes, including pulmonary vasoconstriction in rat pulmonary artery myocytes [30], vasoconstriction in rat cerebral artery [42], and γ-oscillations in parvalbumin-containing neurons of schizophrenia patients [6]. In particular, KV2.1/KV9.3 heterotetramers are inhibited by hypoxia, resulting in increased concentrations of intracellular Ca2+ and hypoxic pulmonary artery vasoconstriction, leading to redistribution of non-oxygenated blood to more ventilated parts of the lung [11, 30, 32]. A similar role has also been suggested in human placental tissue [5]. However, no previous study has addressed whether KV9.3 has functions independent of KV2.1 or plays a role in non-excitable cells. Unlike these previous studies, we examined the specific function of KV9.3 in cancer cell lines by examining the effects of selective KV9.3 knockdown.
In the present study, we found that KV9.3 knockdown reduced proliferation of HCT15 and A549 cells by inducing cell cycle arrest in G0/G1 phase accompanied by changes in expression of cell cycle regulatory proteins related to G1-S transition. Cyclin D3 forms a complex with and functions as a regulatory subunit of CDK4 or CDK6, whose activity is required for G1-S transition [15]. p21 and p27 belong to the Cip/Kip family, whose members inhibit a variety of cyclin/CDK complexes [15]. CDK2 forms a complex with cyclin E that is necessary for progression from G1 to S phase [15]. Besides showing KV9.3 knockdown reduced proliferation in vitro, we observed that knockdown of this gene reduced tumor growth in vivo model (SCID mouse xenograft model). This strengthens our result that silencing KV9.3 has anti-proliferative effect by proving it in two different systems. It is now widely accepted that various potassium channels are involved in cancer cell proliferation [29, 35, 36, 39]. Inhibition or silencing of several potassium channels have shown anti-proliferative effect in vitro as well as in vivo system, most of them accompanied by G0/G1 cell cycle arrest. Examples are ATP-sensitive potassium (KATP) channels in breast cancer cells [27, 40], KV4.1 channels in human gastric cancer cell lines [19] and tumorigenic human mammary epithelial cells [12], KV1.3 channels in lung adenocarcinoma cells [13], and KV11.1 channels in neuroblastoma cells [41]. In line with the previous studies, our findings expand on these previous works by showing KV9.3 inhibits cancer cell proliferation in vitro and in vivo.
Activation of potassium channels has been thought to promote apoptosis by reducing cell volume and intracellular potassium concentration [36] and various potassium channels are known to be involved in apoptosis [36]; however, we found that silencing KV9.3 in HCT15 and A549 cells did not induce apoptosis. This absence of an effect on apoptosis is similar to that observed following inhibition or silencing of KV1.3 in A549 cells [13] and KATP channel in a breast cancer cell line [27].
A role for KV9.3 independent of KV2.1 has not been extensively investigated. Although KV2.1 and KV9.3 mRNA expression have been reported to decrease concurrently in parvalbumin-containing neurons of schizophrenia patients [6], other studies have indicated divergent patterns of KV2.1 and KV9.3 expression. For example, in an analysis of the expression of potassium channels in the human placental vasculature, Wareing et al. (2006) found that, whereas KV2.1 was expressed in only a portion of the samples, KV9.3 was expressed in all samples [37]. Moreover, in screens of KV channels in uterine carcinoma cell lines performed by Suzuki et al. (2004), several cell lines (HT-3, MS-751, Ishikawa) were positive for KV9.3 but negative for KV2.1 [34]. These findings indicate that KV9.3 can be expressed without KV2.1, implying that KV9.3 might have an independent role that does not involve KV2.1. In the current study, we confirmed that KV2.1 expression was not changed by KV9.3 knockdown. Thus, our demonstration that selective knockdown of KV9.3 influences the proliferation of cancer cells may suggest an action of KV9.3 independent of its association with KV2.1. In addition, it has been reported that KV9.3 contains numerous putative phosphorylation sites, including those for protein kinase A, protein kinase C, calcium-calmodulin kinase, and tyrosine kinase [30], suggesting that KV9.3 could be involved in other cellular events, such as cell cycle progression, through KV2.1-independent, non-conducting mechanisms that could involve protein-protein interactions. These potential KV2.1-independent functions of KV9.3 warrant further investigation.
In our search for transcription factors that might regulate the expression of KV9.3, we identified several GC-boxes known to be binding sites for Sp1 in the promoter of the corresponding KCNS3 gene. We further found that Sp1 bound to the KCNS3 promoter and showed that inhibition of Sp1 by mithramycin A decreased KV9.3 expression, supporting a role for Sp1 in regulating the expression of the KCNS3 gene. Sp1 is a transcription factor containing three C2H2-type zinc finger DNA-binding domains that bind to GC-rich nucleotide sequences [2, 38]. Although Sp1 was first was thought to regulate housekeeping genes and other TATA-less genes, it has become evident that Sp1 is involved in diverse cellular events, including cell proliferation and cell cycle arrest [2, 38]. In addition, recent studies have shown that Sp1 also regulates expression of gene encoding different ion channels [8, 20, 24, 31] including KV channels; in particular, KV1.5 [4], KV4.3 [23], and KV7.5 [21] have been reported to be targets of Sp1. Our findings expand on these previous works and broaden our understanding of the regulation of KV9.3.
In conclusion, our results demonstrate that specific knockdown of KV9.3 decreased cell viability through G0/G1 cell cycle arrest and tumor growth in vivo, and implicate Sp1 in regulating the expression of KV9.3 in HCT15 and A549 cells. This is the first report investigating the regulation of KV9.3 expression and the role of KV9.3 in cancer cell proliferation. Our results also suggest that KV9.3 may have functions independent of KV2.1 in cancer cells. Although further studies are needed to elucidate the detailed mechanisms by which KV9.3 influences cancer cell proliferation, our findings suggest that KV9.3 might serve as a potential target in cancer therapy.
MATERIALS AND METHODS
Cell culture
Human HCT15 colon carcinoma and A549 lung adenocarcinoma cell lines were purchased from the Korean Cell Line Bank (Seoul, South Korea). The cells were cultured in RPMI-1640 medium (Gibco, Grand Island, NY, USA) supplemented with 10% fetal bovine serum (Gibco) and 1% antibiotics (Zell Shield, Minerva Biolabs, Berlin, Germany), and incubated at 37°C in a humidified atmosphere of 5% CO2 in air.
RNA extraction, reverse transcription-polymerase chain reaction (RT-PCR), and quantitative real-time PCR
Total RNA was extracted from HCT15 and A549 cells with TRIzol reagent (Life Technologies, Paisley, UK) according to the manufacturer’s instructions. For cDNA synthesis, 1 μg of total RNA was reversed transcribed using a QuantiTect Reverse Transcription Kit (Qiagen, Hilden, Germany). Negative controls without reverse transcriptase were also run to confirm the absence of contamination. PCR was performed with an i-StarMaster Mix PCR Kit (iNtRON Biotechnology Inc., Sungnam, South Korea) according to the manufacturer’s instructions using the following thermocycling conditions: 94°C for 5 min, followed by 35 cycles at 94°C for 40 s (denaturation), 60°C (for KV9.3) or 65°C (for KV2.1) for 40 s (annealing), and 72°C for 1 min (extension), with a final extension at 72°C for 7 min.
Real-time PCR was performed with a Rotor-Gene Q system (Qiagen) using a Rotor-Gene SYBR Green PCR kit (Qiagen). After denaturing for 5 min at 95°C, cDNA was amplified using 45 cycles of 95°C for 10 s and 60°C for 30 s. The target gene was quantified using the manufacturer’s software (Rotor-Gene Q Series software, Qiagen). The relative fold change in target mRNA, normalized to glyceraldehyde-3-phosphate dehydrogenase (GAPDH), was measured using the delta-delta CT method [25]. The primers used for RT-PCR and real-time PCR are presented in Table 1.
Table 1: Primer pairs for RT-PCR and real-time PCR
Gene |
Sequence |
Product size (bp) |
|
RT-PCR |
Kv9.3 |
F: 5’-CTGGGGAAGCTGCTTACTTG-3’ R: 5’-CAGATTTTCTTCCGGAGCTG-3’ |
395 |
Kv2.1 |
F: 5’-GAATGTCCGCCGCGTGGTCCA-3’ R: 5’-CTTGGCTCTCTCCAGAGCCTC-3’ |
451 |
|
Real-time PCR |
Kv9.3 |
F: 5’-CAGTGAGGATGCACCAGAGA-3’ R: 5’-TTGCTGTGCAATTCTCCAAG-3’ |
200 |
Kv2.1 |
F: 5’-CTGCCAAGATCCTTGCCATAA-3’ R: 5’-CCGAACTCATCGAGGCTCTG-3’ |
103 |
|
GAPDH |
F: 5’-GAGTCAACGGATTTGGTCG-3’ R: 5’-TGGAATCATATTGGAACATGTAAAC-3’ |
135 |
siRNA transfection
HCT15 and A549 cells were seeded in 6-well plates or 100-mm dishes 1 d before transfection. The cells were washed once with warm phosphate-buffered saline (PBS), and the growth medium was replaced with OPTI-MEM medium (Gibco). Cells were transfected with KV9.3 siRNA (FlexiTube siRNA Hs_KCNS3_3; Qiagen) or negative control RNA (AllStars Negative Control siRNA; Qiagen) at a final concentration of 10 nM using Lipofectamine 2000 (Life Technologies, Paisley, UK). Six hours after transfection, the medium was replaced with growth medium. The cells were harvested 48 and 72 h after transfection for RNA and protein extraction, respectively.
Cell viability assay
Cell viability was determined using MTT (3-(4,5-dimethythiazol-2-yl)-2,5-diphenyl tetrazolium bromide) assays as described by the manufacturer (Sigma Aldrich, St. Louis, MO, USA). Briefly, 72 h after seeding HCT15 and A549 cells in 12-well plates and transfecting with siRNA as described above, 110 μl of a 5 mg/ml MTT solution was added to cells in 1 ml of media, yielding a final MTT concentration of 0.5 mg/ml. After 3 h of incubation at 37°C, the MTT solution was removed and the purple MTT formazan crystals were dissolved by adding 500 μl of dimethyl sulfoxide (DMSO) and shaking for 20 min. The dissolved formazan crystals were transferred to a 96-well plate, and absorbance was measured at 570 nm.
Analysis of the cell cycle and apoptosis by flow cytometry
For cell cycle analyses, HCT15 and A549 cells were seeded in 25-T flasks and transfected with siRNA as described above. After 72 h, the cells were pelleted, washed and resuspended in ice cold PBS, and fixed with -20°C ethanol at a final concentration of 70%. The cells were then washed once with cold PBS, resuspended in PBS containing 50 μg/ml RNase A (Intron), and incubated for 30 min at 37°C. After adding propidium iodide (Sigma Aldrich) at a final concentration of 40 μg/ml, fluorescence was measured by flow cytometry using a BD FACSCalibur system (BD Bioscience, San Jose, CA, USA) and analyzed with CellQuest3.3 (BD Bioscience) and Mod Fit LT 3.3 software (Verity Software House, Topsham, ME, USA).
For determination of apoptosis, cells were seeded in 6-well plates and transfected with siRNA as described above. After 72 h, the cells were processed using an Annexin V Apoptosis Detection Kit FITC (eBioscience, San Diego, CA, USA), according to the manufacturer’s instructions. Cell-associated fluorescence was measured using a BD FACS Canto II system (BD Bioscience) and analyzed using FlowJo software (TreeStar, San Carlos, CA, USA).
Western blot analysis
Protein was extracted from HCT15 and A549 cells using CytoBuster Protein Extraction Reagent (Novagen, Madison, WI, USA) following the manufacturer’s instructions. Equal amounts of protein (30 μg) were separated on 10% sodium dodecyl sulfate (SDS)-polyacrylamide gels and transferred to a 0.2 μm nitrocellulose membrane (Whatman GmbH, Hahnestraße, Germany). The membranes were blocked by incubating with Tris-buffered saline-Tween 20 (TBST) containing 10% skim milk (Difco, Sparks, MD, USA) for 2 h at room temperature. The blocked membranes were probed with anti-cyclin D3 (1:2000, 2936; Cell Signaling Technology, Danvers, MA, USA), anti-CDK2 (1:1000, sc-163; Santa Cruz Biotechnology, Santa Cruz, CA, USA), anti-p21 (1:1000, sc-397; Santa Cruz Biotechnology) or anti-p27 (1:500, sc-528; Santa Cruz Biotechnology) antibody at 4°C overnight. Membranes were incubated with horseradish peroxidase-conjugated horse anti-mouse IgG antibody (Vector Laboratories Inc., Burlingame, CA, USA) or goat anti-rabbit IgG antibody (Millipore, Billerica, MA, USA) for 1.5 h at room temperature. β-actin (Cell Signaling Technology) was used as an internal control.
Establishment of stable knock down cells using lentiviral shRNA
To stably knockdown KCNS3 (KV9.3) gene of HCT15 and A549 cell lines, lentiviral vector-mediated short-hairpin RNA (shRNA) construct was purchased from Sigma-Aldrich (St. Louis, MO) with pLKO.1-puro eGFP control vector (Sigma, SHC005). The target set was generated from accession number NM_002252: CCGGCCTTACTTTAACATTAGGGATCTCGAGAT CCCTAATGTTAAAGTAAGGTTTTTG. Lentiviruses were produced by cotransfecting shRNA-expressing vector and pMD2.G and psPAX2 constructs (Addgene, Cambridge, MA) into 293T cells by using lipofectamine 2000 (Invitrogen). Viral supernatants were harvested 48 hours after transfection, filtered through a 0.45 μm filter, titered, and used to infect HCT15 and A549 cells with 10 μg/mL polybrene. Cells were treated by 0.5 μg/mL puromycin at 48 hours after viral transduction and were selected for 10 days. Knockdown efficiency was determined by quantitative real-time RT-PCR.
Xenograft assay
HCT15 and A549 cells (1 x 10⁶ cells in 50 µl of serum-free RPMI) were mixed with equal volumes of Matrigel (BD Biosciences, Bedford, MA) and injected into the subcutaneous flank tissue of the nonobese diabetic/severe combined immunodeficiency (NOD/SCID) mice. The mice were monitored weekly for tumor volumes, using a caliper. Tumor volume (V) was calculated by use of the following equation: V = 1/2 x a x b 2, where a and b are the longest and shortest diameters of the tumor mass (in millimeters), respectively.
Mithramycin A treatment
HCT15 and A549 cells were seeded in 6-well plates 1 d before mithramycin A treatment and harvested 24 h after treatment. Mithramycin A (Sigma Aldrich) was dissolved in methanol at a concentration of 1 mM and stored at -20°C. Immediately before use, the drug was diluted with culture medium to a concentration of 100 or 250 nM.
Chromatin immunoprecipitation assay
HCT15 and A549 cells were grown on a 15-cm plate until they reached 70-80% confluence. Chromatin immunoprecipitation assays were performed using a ChIP-IT Enzymatic Kit (Active Motif, Carlsbad, CA, USA) according to the manufacturer’s instructions. Cell lysates were immunoprecipitated with anti-Sp1 antibody (2 μg) (39058; Active Motif) or normal rabbit IgG (2 μg, sc-2027; Santa Cruz Biotechnology). The putative Sp1 binding site (G-C rich region) in the KCNS3 promoter was predicted by the TFSEARCH program (http://www.cbrc.jp/research/db/TFSEARCH.html).
Sequences spanning the -428 to -233 bp region of the KCNS3 promoter were amplified by PCR using the primer pair 5’-GGGGGAGGTCATCTTTTTCC-3’ (forward) and 5’-CCAGACAGGCGGACAGAC-3’ (reverse) at an annealing temperature of 57°C.
Statistical analysis
All graphs were generated with GraphPad Prism4 (version 4.0; GraphPad Software, San Diego, CA, USA). Statistical significance was determined using unpaired or paired Student’s t-test. A P-value less than 0.05 was considered statistically significant.
ACKNOWLEDGEMENTS
This research was supported by Basic Science Research Program through National Research Foundation of Korea (NRF) funded by the Ministry of Science, ICT & Future Planning (NRF-2014R1A1A3A04052757).
REFERENCES
1. Asher V, Sowter H, Shaw R, Bali A and Khan R. Eag and HERG potassium channels as novel therapeutic targets in cancer. World J Surg Oncol 2010; 8: 113.
2. Black AR, Black JD and Azizkhan-Clifford J. Sp1 and krüppel-like factor family of transcription factors in cell growth regulation and cancer. J Cell Physiol 2001; 188(2): 143-160.
3. Cidad P, Jiménez-Pérez L, García-Arribas D, Miguel-Velado E, Tajada S, Ruiz-McDavitt C, López-López JR and Pérez-García MT. Kv1.3 channels can modulate cell proliferation during phenotypic switch by an ion-flux independent mechanism. Atertio Thromb Vasc Biol 2012; 32(5): 1299-1307.
4. Fountain SJ, Cheong A, Li J, Dondas NY, Zeng F, Wood IC and Beech DJ. Kv1.5 potassium channel gene regulation by Sp1 transcription factor and oxidative stress. Am J Physiol Heart Circ Physiol 2007; 293(5): H2719-H2725.
5. Fyfe G, Panicker S, Jones R and Wareing M. Expression of an electrically silent voltage-gated potassium channel in the human placenta. J Obstet Gynaecol 2012; 32(7): 624-629.
6. Georgiev D, Arion D, Enwright JF, Kikuchi M, Minabe Y, Corradi JP, Lewis DA and Hashimoto T. Lower gene expression for KCNS3 potassium channel subunit in parvalbumin-containing neurons in the prefrontal cortex in schizophrenia. Am J Psychiatry 2014; 171(1): 62-71.
7. Georgiev D, Gonzalez-Burgos G, Kikuchi M, Minabe Y, Lewis DA and Hashimoto T. Selective expression of KCNS3 potassium channel alpha-subunit in parvalbumin-containing GABA neurons in the human prefrontal cortex. PloS one 2012; 7(8): e43904.
8. González-Ramírez R, Martínez-Hernández E, Sandoval A and Felix R. Transcription factor Sp1 regulates T-Type Ca2+ channel Cav3.1 gene expression. J Cell Physiol 2014; 229(5): 551-560.
9. Hegle AP, Marble DD and Wilson GF. A voltage-driven switch for ion-independent signaling by ether-a-go-go K+ channels. Proc Natl Acad Sci U S A 2006; 103(8): 2886-2891.
10. Hristov KL, Chen M, Afeli SA, Cheng Q, Rovner ES and Petkov GV. Expression and function of Kv2-containing channels in human urinary bladder smooth muscle. Am J Physiol Cell Physiol 2012; 302(11): C1599-C1608.
11. Hulme JT, Coppock EA, Felipe A, Martens JR and Tamkun MM. Oxygen sensitivity of cloned voltage-gated K+ channels expressed in the pulmonary vasculature. Circul Res 1999; 85(6): 489-497.
12. Jang SH, Choi CS, Hong SG, Yarishkin OV, Bae YM, Kim JG, O’Grady SM, Yoon KA, Kang KS and Ryu PD. Silencing of Kv4.1 potassium channels inhibits cell proliferation of tumorigenic human mammary epithelial cells. Biochem Biophys Res Commun 2009; 384(2): 180-186.
13. Jang SH, Choi SY, Ryu PD and Lee SY. Anti-proliferative effect of Kv1.3 blockers in A549 human lung adenocarcinoma in vitro and in vivo. Eur J Pharmacol 2011; 651(1): 26-32.
14. Jehle J, Schweizer P, Katus H and Thomas D. Novel roles for hERG K+ channels in cell proliferation and apoptosis. Cell Death Dis 2011; 2(8): e193.
15. Johnson D and Walker C. Cyclins and cell cycle checkpoints. Annu Rev Pharmacol Toxicol 1999; 39(1): 295-312.
16. Kerschensteiner D, Monje F and Stocker M. Structural determinants of the regulation of the voltage-gated potassium channel Kv2.1 by the modulatory α-subunit Kv9.3. J Biol Chem 2003; 278(20): 18154-18161.
17. Kerschensteiner D, Soto F and Stocker M. Fluorescence measurements reveal stoichiometry of K+ channels formed by modulatory and delayed rectifier α-subunits. Proc Natl Acad Sci U S A 2005; 102(17): 6160-6165.
18. Kerschensteiner D and Stocker M. Heteromeric assembly of Kv2.1 with Kv9.3: effect on the state dependence of inactivation. Biophys J 1999; 77(1): 248-257.
19. Kim H-J, Jang SH, Jeong YA, Ryu PD, Kim D-Y and Lee SY. Involvement of Kv4.1 K+ channels in gastric cancer cell proliferation. Biol Pharm Bull 2010; 33(10): 1754-1757.
20. Kundu P, Alioua A, Stefani E and Toro L. Regulation of mouse slo gene expression: multiple promoters, transcription start sites, and genomic action of estrogen. J Biol Chem 2007; 282(37): 27478-27492.
21. Lee BH, Ryu PD and Lee SY. Serum starvation-induced voltage-gated potassium channel Kv7.5 expression and its regulation by Sp1 in canine osteosarcoma cells. Int J Mol Sci 2014; 15(1): 977-993.
22. Li M and Xiong Z-G. Ion channels as targets for cancer therapy. Int J Physiol Pathophysiol Pharmacol 2011; 3(2): 156-166.
23. Li Q, Zhang Y, Sheng Y, Huo R, Sun B, Teng X, Li N, Zhu JX, Yang BF and Dong DL. Large T-antigen up-regulates Kv4.3 K+ channels through Sp1, and Kv4.3 K+ channels contribute to cell apoptosis and necrosis through activation of calcium/calmodulin-dependent protein kinase II. Biochem J 2012; 441(3): 859-867.
24. Lin H, Xiao J, Luo X, Chen G and Wang Z. Transcriptional control of pacemaker channel genes HCN2 and HCN4 by Sp1 and implications in re-expression of these genes in hypertrophied myocytes. Cell Physiol Biochem 2009; 23: 317-326.
25. Livak KJ and Schmittgen TD. Analysis of relative gene expression data using real-time quantitative PCR and the 2-Delta Delta C(T) Method. Methods 2001; 25(4):402-408.
26. Millership JE, Devor DC, Hamilton KL, Balut CM, Bruce JI and Fearon IM. Calcium-activated K+ channels increase cell proliferation independent of K+ conductance. Am J Physiol Cell Physiol 2011; 300(4): C792-C802.
27. Núñez M, Medina V, Cricco G, Croci M, Cocca C, Rivera E, Bergoc R and Martín G. Glibenclamide inhibits cell growth by inducing G0/G1 arrest in the human breast cancer cell line MDA-MB-231. BMC Pharmacol Toxicol 2013; 14(1): 6.
28. O’Grady SM and Lee SY. Molecular diversity and function of voltage-gated (Kv) potassium channels in epithelial cells. Int J Biochem Cell Biol 2005; 37(8): 1578-1594.
29. Pardo LA. Voltage-gated potassium channels in cell proliferation. Physiology 2004; 19(5): 285-292.
30. Patel AJ, Lazdunski M and Honoré E. Kv2.1/Kv9.3, a novel ATP-dependent delayed-rectifier K+ channel in oxygen-sensitive pulmonary artery myocytes. EMBO J 1997; 16(22): 6615-6625.
31. Pierce SL and England SK. SK3 channel expression during pregnancy is regulated through estrogen and Sp factor-mediated transcriptional control of the KCNN3 gene. Am J Physiol Endocrinol Metabol 2010; 299(4): E640-E646.
32. Platoshyn O, Yu Y, Golovina VA, McDaniel SS, Krick S, Li L, Wang J-Y, Rubin LJ and Yuan JX-J. Chronic hypoxia decreases Kv channel expression and function in pulmonary artery myocytes. Am J Physiol Lung Cell Mol Physiol 2001; 280(4): L801-L812.
33. Spitzner M, Ousingsawat J, Scheidt K, Kunzelmann K and Schreiber R. Voltage-gated K+ channels support proliferation of colonic carcinoma cells. FASEB J 2007; 21(1): 35-44.
34. Suzuki T and Takimoto K. Selective expression of HERG and Kv2 channels influences proliferation of uterine cancer cells. Int J Oncol 2004; 25(1): 153-159.
35. Urrego D, Tomczak AP, Zahed F, Stühmer W and Pardo LA. Potassium channels in cell cycle and cell proliferation. Philos Trans R Soc Lond B Biol Sci 2014; 369: 20130094.
36. Wang Z. Roles of K+ channels in regulating tumour cell proliferation and apoptosis. Pflügers Archiv 2004; 448(3): 274-286.
37. Wareing M, Bai X, Seghier F, Turner CM, Greenwood SL, Baker PN, Taggart MJ and Fyfe GK. Expression and function of potassium channels in the human placental vasculature. Am J Physiol Regul Integr Comp Physiol 2006; 291(2): R437-R446.
38. Wierstra I. Sp1: emerging roles-beyond constitutive activation of TATA-less housekeeping genes. Biochemical and biophysical research communications 2008; 372(1): 1-13.
39. Wonderlin W and Strobl J. Potassium channels, proliferation and G1 progression. J Membr Biol 1996; 154(2): 91-107.
40. Woodfork KA, Wonderlin WF, Peterson VA and Strobl JS. Inhibition of ATP-sensitive potassium channels causes reversible cell-cycle arrest of human breast cancer cells in tissue culture. J Cell Physiol 1995; 162(2): 163-171.
41. Zhao J, Wei X-L, Jia Y-S and Zheng J-Q. Silencing of herg gene by shRNA inhibits SH-SY5Y cell growth in vitro and in vivo. Eur J Pharmacol 2008; 579(1): 50-57.
42. Zhong XZ, Abd-Elrahman KS, Liao CH, El-Yazbi AF, Walsh EJ, Walsh MP and Cole WC. Stromatoxin-sensitive, heteromultimeric Kv2.1/Kv9.3 channels contribute to myogenic control of cerebral arterial diameter. J Physiol 2010; 588(22): 4519-4537.