
Introduction
MicroRNAs (miRNAs) are evolutionarily conserved small (18-25 nucleotides) non-coding RNAs that modulate gene expression by targeting mRNAs of protein-coding genes. Let-7 miRNA was first identified in C.elegans as a heterochronic gene, which promotes larval stage 4-to-adult transition [1]. Further research on let-7 revealed a highly conserved miRNA family present in vertebrates, ascidians, hemichordates, molluscs, annelids and arthropods [2]. In humans, the let-7 family consists of 12 members, all sharing a common seed sequence. Let-7 miRNAs are involved in many physiological, as well as pathological processes, with a primary role in the induction of terminal differentiation and maintenance of this differentiated state throughout lifespan. Many known let-7 target genes, such as MYC, CCND1, RAS, LIN28 and HMGA2 are oncogenes involved in cell cycle progression and stemness. Let-7 levels were found to be low in a variety of primary and metastatic tumors, and its loss or down-regulation is associated with increased cancer aggressiveness and poor clinical outcome [3-5]. Ectopic expression of let-7 reduces chemoresistance and invasiveness of cancer cells and suppresses tumor growth of human lung cancers in vivo [6].
In recent years reprogrammed metabolism has been recognized as a new hallmark of cancer [7]. The majority of differentiated cells oxidize glucose to carbon dioxide in the mitochondrial tricarboxylic acid (TCA) cycle, generating the amount of ATP necessary to maintain cell homeostasis and to accomplish specialized cellular functions. In contrast, rapidly proliferating cancer cells to meet their metabolic demand activate aerobic glycolysis, a phenomenon known as “the Warburg effect”. During this process a significant part of glucose-derived carbon is diverted into anabolic pathways in order to build up biomass. A modulation of the glucose flux through the glycolytic pathway together with cataplerotic removal of TCA cycle intermediates allow cancer cells to optimize the production of ATP and building blocks for macromolecular synthesis [8]. Oncogenes such MYC and RAS induce the pentose phosphate pathway (PPP), while the tumor suppressor protein TP53 represses PPP by inactivating the rate-limiting enzyme glucose-6-phosphate dehydrogenase (G6PD) [9, 10]. Similarly, fatty acid synthase (FASN), the key enzyme of de novo lipogenesis, is found to be highly active in a large variety of cancers, and its up-regulation is associated with chemotherapeutic drug resistance [11, 12]. Thus, counteracting the tumor’s anabolic activity may offer a promising therapeutic strategy.
Although in many cancers mitochondria still remain the major source of ATP, the truncation of the TCA cycle caused by cataplerotic reactions or altered mitochondrial biogenesis may decrease the efficiency of mitochondrial oxidative phosphorylation (OXPHOS) [13, 14]. It has been shown that cancer cells with predominantly glycolytic metabolism are more malignant. Cells systematically treated with the mitochondrial inhibitor oligomycin repress OXPHOS and generate larger and more aggressive tumors [15]. One consequence of ongoing OXPHOS is the production of reactive oxygen species (ROS). High level of ROS is harmful for the cells. However, below a toxic threshold, ROS play an essential physiological role as signaling molecules. An increase in ROS levels is required for a variety of stem cells to differentiate and the treatment with exogenous ROS impairs stemness [16-18]. Normal stem cells and cancer stem cells share this property. Indeed, mammary epithelial stem cells and breast cancer stem cells both contain lower ROS level than their more mature progenitors [19]. An association between advanced metastatic state and reduced ROS levels has been shown in breast cancer [20]. Interestingly, a switch from mitochondrial OXPHOS, the major cellular source of ROS, to aerobic glycolysis is also observed during the generation of induced pluripotent stem cells [21]. Taken together these data suggest an inverse association between ROS level and stemness, where a lower level of mitochondrial ROS and reduced mitochondrial activity correspond to a more de-differentiated state. Furthermore, ROS levels have implications for anticancer therapy, although the question is complex. On one hand, increased levels of oxidants likely make cancer cells more vulnerable to further damage by therapy-induced exogenous ROS treatment. On the other hand, a persistent intrinsic oxidative stress causes the up-regulation of ROS scavenging system or employment of a “go or grow” strategy making cancer cells better-adapted and thus more resistant [20, 22].
Recently let-7 miRNA has been shown to regulate glucose metabolism through m-TOR dependent and m-TOR independent mechanisms in vitro and in vivo [23, 24]. However, due to the metabolic heterogeneity of cancer in general, in depth study of specific cancer models is needed. In the present study we have addressed the role of let-7 in regulating energy metabolism in triple-negative breast cancer and metastatic melanoma cell lines, and explored the therapeutic potential of the miRNA replacement therapy in vitro in combination with the conventional anticancer drug doxorubicin.
Results
Let-7a represses proliferation and clonogenic capacity of MDA-MB-231 cells
To assess the validity of our model system, we first investigated the protein level of three known let-7 targets, CCND1, HMGA2 and LIN28A upon let-7a transfection. Cells transfected with let-7a mimics (hereinafter let-7a) or with negative control oligos (hereinafter negative control) were lysed on day 3 post transfection and extracts were subjected to Western blot analysis. The levels of all three proteins were reduced to approximately 50% in let-7a transfected cells compared to the negative control (Fig. 1A). Interestingly, we observed that, in contrast to the spindle-shaped, mesenchymal-like morphology of untreated and negative control cells, the cells transfected with let-7a became more columnar and epithelial-like already 48 hours post transfection (Fig. 1B). Next, we investigated the effect of let-7a overexpression on cell growth. Cell growth was assessed by time-lapse live-cell imaging based on cellular confluence. Cells transfected with let-7a showed a time-dependent decrease in confluence compared to the negative control cells (Fig. 1C). The cell number and viability were assessed using Trypan Blue. As expected, let-7a significantly reduced the final number of cells in culture (Fig. 1D) with no effect on viability (Fig. S1A). Further analysis of caspase-3/7 activity to check for apoptosis revealed no difference between let-7a transfected and negative control cells (Fig. S1B). We performed colony formation assay to determine whether ectopic expression of let-7a impairs the clonogenic capability of MDA-MB-231 cells. The number of colonies generated from single cells was drastically reduced in let-7a treated samples (Fig. 1E and F), while the size of the colonies did not differ (Fig. S1C).
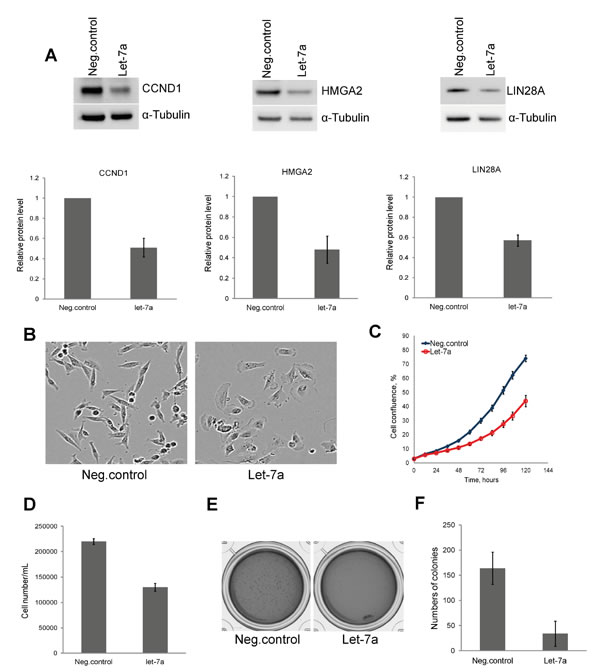
Figure 1: Let-7a represses cell proliferation and clonogenic capacity of MDA-MB-231 cells. A, protein levels of CCND1, HMGA2, and LIN28A on day 3 post transfection and densitometric quantification of proteins normalized to α-tubulin, n=3, SD. B, phase-contrast images of cells on day 3 post transfection, magnification 10X. C, cell confluence-based growth curve. D, count of cells using Trypan Blue on day 3 post transfection, n=3, SD. E, colonies generated after 10 days of incubation in the methylcellulose-based medium. F, quantification of colonies by counting of MTT stained colonies, n=4, SD.
Let-7a down-regulates key anabolic enzymes in MDA-MB-231 cells
The effect of let-7a on global transcript levels was determined using microarray. Rank product analysis was employed to identify differentially expressed genes. The analysis revealed 873 probes, representing 754 genes, with significant changes in gene expression between let-7a transfected and negative control cells. Of these, 357 genes were down-regulated whereas 397 genes were up-regulated. Functional enrichment analysis of microarray data (GEne SeT AnaLysis-GESTALT-Toolkit) identified metabolic pathways to be highly enriched (Table S1). To investigate differences at the protein level we used SILAC-base proteome-wide analysis. We identified 37 proteins with significantly changed levels upon let-7a transfection. Of these, 27 proteins were down-regulated, and 10 proteins were up-regulated (Table S2). Comparison of the mRNA and protein changes revealed that 54% of the differentially expressed proteins were also changed in the same direction at the mRNA level (Fig. S2A). Enrichment analysis of changed proteins also showed metabolic pathways as the first group in the top ten list (Table S1). Among metabolic genes down-regulated by let-7a at the transcriptional and/or protein level we identified key enzymes of anabolic pathways, namely G6PD, inosine monophosphate dehydrogenase (IMPDH2), FASN, stearoyl-CoA desaturase (SCD) and 4-phosphopantetheinyl transferase (AASDHPPT) (Table 1). Protein level changes were further validated by Western blot analysis (Fig. 2 and Table 1). Differentially expressed mRNAs and proteins were compared with the list of predicted let-7a targets and revealed that among anabolic genes only SCD is a predicted let-7 target (Fig. S2B). Since these enzymes are essential for macromolecular synthesis underlying cell cycle progression, we performed a cell-cycle analysis. The detection of Hoechst fluorescence by flow cytometry revealed that the fraction of cells in S-phase is reduced by 50% in let-7a transfected cells compared to the negative control (Fig. 2B).
Table 1: Expression of anabolic genes upon let-7a transfection
Gene name |
Function |
Microarray |
SILAC |
WB1 |
||
FC |
q-value |
FC |
q-value |
FC |
||
IMPDH2 |
De novo guanine nucleotide biosynthesis |
-1.40 |
0.026 |
-1.41 |
0.053 |
n/a |
FASN |
Fatty acid synthase |
-1.46 |
0.010 |
-1.15 |
0.461 |
-2.00 |
TYMS |
Thymidin nucleotide biosynthesis |
-1.29 |
0.113 |
-1.59 |
0.004 |
-2.66 |
G6PD |
Pentose phosphate pathway (oxidative branch) |
-2.08 |
0.000 |
-1.59 |
0.004 |
-3.44 |
AASDHPPT |
4'-Phosphopantetheinyl transferase |
-1.95 |
0.000 |
-1.79 |
0.000 |
-4.6 |
SCD |
Stearol Co-A Desaturase |
-1.66 |
0.000 |
n/a |
n/a |
n/a |
FC = fold-change (negative of the inverse)
1: FC determined by densitometric analysis
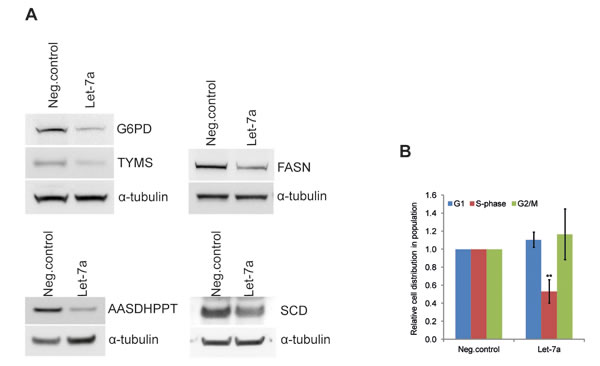
Figure 2: Let-7a affects key anabolic enzymes and cell-cycle progression in MDA-MB-231. A, Protein levels of G6PDH, TYMS, FASN, AASDHPPT, and SCD on day 3 post transfection. WBs quantification is shown in the Table 1. B, cell-cycle was analyzed by flow cytometry using Hoechst 33342 staining on day 3 post transfection, n=6, SD.
Let-7a regulates energy metabolism and mitochondrial ROS in MDA-MB-231 cells
After we observed the effect of let-7a on key anabolic enzymes, we investigated whether let-7a also affects other metabolic functions, such as energy metabolism. Therefore, we examined mitochondrial membrane potential using JC-1, a mitochondria specific fluorescent probe that exhibits potential-dependent accumulation in mitochondria, with a concomitant shift in the peak of emission spectrum from green (≈529 nm) to red (≈590 nm). We found that the mitochondrial membrane potential was increased upon let-7a transfection (Fig. 3A), indicating enhanced mitochondrial activity. To confirm the specificity of the assay, we treated let-7a transfected cells or negative control cells with the mitochondrial uncoupler CCCP, which dissipates the proton gradient causing a drop of the electrochemical potential across the mitochondrial membrane. As expected, after CCCP treatment, no red fluorescence was detected in negative control or in let-7a treated cells, while the total mitochondrial content was unchanged, as shown by the green fluorescence (Fig. S3). To assess overall energy metabolism, we measured the oxygen consumption rate (OCR) and the extracellular acidification rate (ECAR) using the XFe Extracellular flux Analyser. Let-7a increased basal respiration, but not spear respiratory capacity (Fig. 3B). Surprisingly, let-7a increased also basal ECAR (Fig. 3C). To investigate the maximal glycolytic capacity, we performed glycolysis stress test. Cells were incubated for 1 hour without glucose and pyruvate, and then in sequence glucose, oligomycin and 2-DG were added. The injection of oligomycin, which blocks ATP synthase, increased ECAR in let-7a cells significantly stronger than in negative control cells, indicating higher maximal glycolytic capacity (Fig. 3D, black and red lines). Of importance, even in the absence of glucose, OCR was higher in let-7a cells, suggesting that mitochondria utilize alternative carbon sources more efficiently (Fig. 3D, grey lines). Mitochondrial oxidative phosphorylation is the main source of ROS in a cell, and increased OXPHOS should lead to higher ROS production. Thus, we measured ROS level on day 2 and day 3 post transfection using 2’,7’-dichlorofluorescein diacetate (DCFDA). ROS level was increased up to approximately 2-fold in let-7a transfected cells, but not in negative control cells, in a time-dependent manner (Fig. 3E). It has been widely demonstrated that there is a positive correlation between mitochondrial membrane potential and ROS production [25, 26]. Moreover, mitochondrial ROS production is very sensitive to uncoupling [27]. To confirm that the detected increase in ROS is of mitochondrial origin, we pre-treated cells with the mitochondrial uncoupler CCCP which totally abolished the differences in ROS levels between let-7a transfected and negative control cells (Fig. 3F). To further validate the mitochondrial origin, we measured mitochondrial superoxide level using highly selective dye. We found mitochondrial superoxide increased in let-7a transfected cells compared to the negative control (Fig. 3G). Increased endogenous ROS level should sensitize cells to further oxidative stress. To assess that, we treated let-7a and negative control cells with the strong oxidant TBHP. ROS levels triggered by TBHP were significantly higher in let-7a cells than in negative control (Fig. 3H), and growth repression was stronger (Fig. S4). The acceleration of both glycolytic and OXPHOS pathways in let-7a transfected cells may require higher energy substrate influx and consumption. We thus measured glucose uptake in transfected cells using the fluorescent glucose analogue 2-NBDG. Let-7a treated cells displayed higher glucose uptake than negative control cells (Fig. 3I). The rate limiting glycolytic enzyme pyruvate kinase M2 (PKM2) can accelerate or slow down the glucose flux through glycolytic pathway by modulating its enzymatic activity. We measured the PKM2 activity and found that it was higher in let-7a transfected cells (Fig. S5).
Microarray analysis revealed that let-7a treatment induced antioxidant response genes in parallel with ROS (Table 2). Among them, heme oxygenase 1 (HMOX1) has previously been shown to be induced by the let-7 family in human hepatocytes through the direct targeting of transcriptional repressor BACH1 [28]. We assessed the expression of these two genes and confirmed that HMOX1 is induced, while BACH1 is down-regulated by let-7a also in MDA-MB-231 breast cancer cells (Fig. 3J).
Table 2: Expression of antioxidant response genes upon let-7a transfection
Gene name |
Function |
FC |
q-value |
MT1X |
Metal-binding protein |
2.22 |
0.000 |
MT2A |
Metal-binding protein |
1.63 |
0.006 |
MT1G |
Metal-binding protein |
1.50 |
0.009 |
MT1A |
Metal-binding protein |
1.39 |
0.042 |
SOD2 |
Superoxide dismutase mitochondrial |
1.53 |
0.008 |
TXNRD1 |
Thioredoxin reductase |
1.69 |
0.008 |
GSTM3 |
Conjugation of reduced glutathione to exogenous and endogenous hydrophobic electrophiles |
1.50 |
0.008 |
CTH |
Converts cystathione derived from methionine into cysteine |
1.51 |
0.008 |
HMOX1 |
Heme oxigenase |
1.52 |
0.013 |
FTH1 |
Ferritin |
1.62 |
0.017 |
FC = fold-change
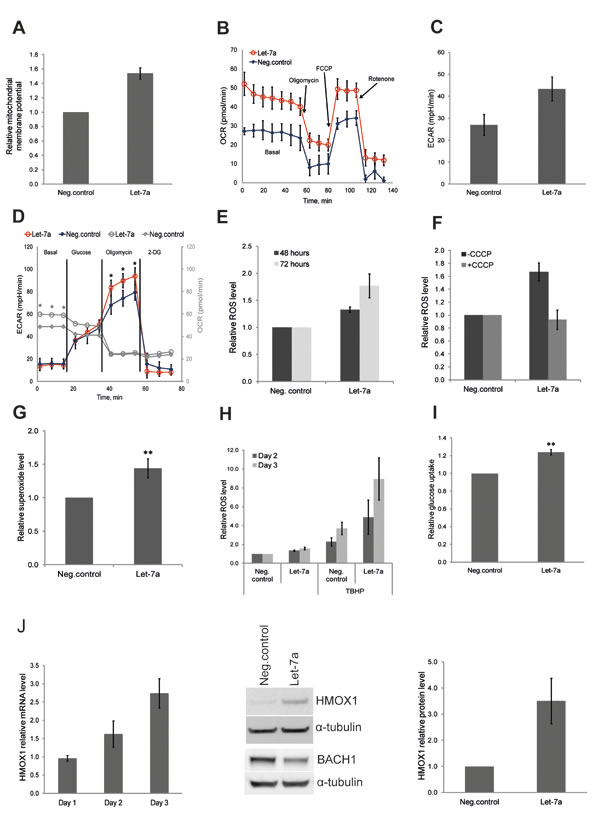
Figure 3: Let-7a regulates energy and redox metabolism in MDA-MB-231 cells. A, mitochondrial membrane potential assessed by flow cytometry using JC1 dye on day 3 post transfection. Data are presented as a relative fold-change of JC1red/JC1green ratio, n=10, SEM. B, OCR under mito-stress test on day 3 post transfection, values are normalized to DNA content, n=4, SD. C, basal ECAR assessed in regular growth medium on day 3 post transfection, n=4, SD. D, ECAR under glyco-stress test on day 3 post transfection; OCR values are in gray. Values are normalized to DNA content, n=4, SD, **p<0.01. E, ROS levels assessed 48 and 72 hours post transfection. Values are compared to the negative control for each time point, n=5, SEM. F, ROS levels assessed on day 3 post transfection, with or without CCCP treatment, n=3, SEM. G, superoxide level assessed on day 3 post transfection by flow cytometry using MitoSOX, n=8, SD,**p<0.01. H, cells were treated with TBHP on day 2 and 3 post transfection 4 hours before ROS measurement. ROS levels in TBHP-treated cells were compared to the ROS levels detected in negative control without TBHP treatment, n=5, SEM. I, glucose uptake on day 3 post transfection using a fluorescent D-glucose analog, n=4, SEM, **p<0.01. J, mRNA level of HMOX1 in let-7a transfected cells over time compared to the negative control cells. Protein level of HMOX1 and BACH1 on day 3 post transfection; densitometric quantification of HMOX1 normalized to α-tubulin, n=3, SD.
Let-7a regulates mitochondrial ROS in WM239 melanoma cells
To extend our findings to a cancer type of non-epithelial origin, we investigated the effect of let-7a on the metastatic melanoma cell line WM239. The effect of let-7a on cell growth and target gene expression on day 3 post transfection confirmed effects observed in MDA-MB-231 cells (Fig. 4A, B and C). Interestingly, similarly to MDA-MB-231 cells, melanoma cells also displayed morphologic changes upon let-7a transfection; the cells became rounder and lost the protrusions (Fig. 4D). Cell-cycle analysis showed that let-7a strongly reduced number of cells in S-phase (Fig. 4E). We further investigated mitochondrial membrane potential and glucose uptake, and found both parameters higher in let-7a transfected cells than in negative control cells (Fig. 4F and G). Similarly, endogenous ROS was increased in let-7a, but not in negative control cells, and this increase was abolished by CCCP treatment (Fig. 4H). Using MitoSox we assessed that mitochondrial superoxide level is increased in let-7a overexpressing cells (Fig. 4I). However, contrary to the MDA-MB-231 cells, we did not detect significant differences in OCR between let-7a and negative control (Fig. S6). On the other hand, let-7a transfected melanoma cells displayed stronger increase in ECAR under glycolytic stress test (Fig. 4J), confirming the data obtained in MDA-MB-231. Western blot analysis showed that let-7a also in this cell line induced HMOX1 and repressed BACH1 (Fig. 4K).
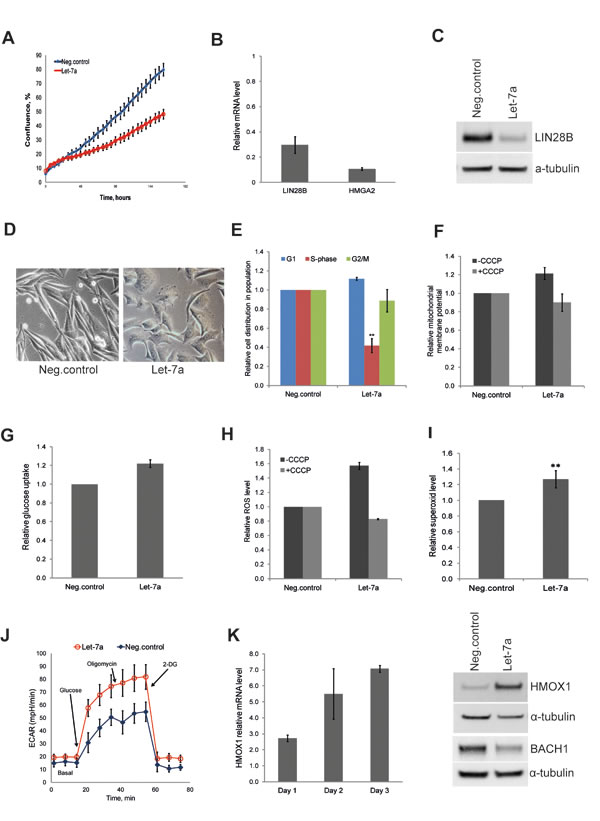
Figure 4: Let-7a affects proliferation and redox pathways in WM239 melanoma cells. A, cell confluence-based growth curve. B, relative mRNA levels of HMGA2 and LIN28B in let-7a transfected cells compared to the negative control, n=3, SD. C, LIN28B protein level in let-7a transfected cells. D, phase-contrast images of cells on day 3 post transfection, magnification 10X. E, cell-cycle was analyzed by flow cytometry using Hoechst 33342 staining on day 3 post transfection, n=4, SD. F, mitochondrial membrane potential on day 3 post transfection using JC1 dye with or without CCCP. CCCP-treated let-7a sample were normalized to the CCCP-treated negative control. Data are presented as a relative fold-change of JC1red/JC1green ratio, n=3, SEM. G, glucose uptake measured on day 3 post transfection using a fluorescent D-glucose analog, n=3, SEM. H, The histogram shows ROS level on day 3 post transfection with or without CCCP, n=3, SEM. I, The histogram shows superoxide level assessed on day 3 post transfection using MitoSOX, n=4, SD, **p<0.01. J, ECAR under glyco stress test on day 3 post transfection, n=4. K, mRNA level of HMOX1 in let-7a transfected cells over time compared to the negative control, n=3, SD. HMOX1 and BACH1 protein level on day 3 post transfection.
Let-7a sensitizes breast cancer and melanoma cells to doxorubicin
The anti-cancer drug doxorubicin has been shown to induce apoptosis through the generation of ROS [29]. However, this causes cytotoxicity in healthy tissues as well. Obtaining therapeutic efficacy at lower drug doses could reduce side-effects. We tested if the combination of doxorubicin with let-7a could be beneficial in this respect. Doxorubicin inhibited cell growth in both MDA-MB-231 and WM239 cells in a dose-dependent manner, but in cells transfected with let-7a the effect of doxorubicin at the lower concentrations was stronger than in negative control (Fig. 5A). We hypothesized that this occurs through the cumulative effect of ROS generated by let-7a and by doxorubicin. If so, an antioxidant treatment with NAC should abolish this effect. Pre-treatment of the cells with NAC attenuated the doxorubicin effect in both let-7a and negative control samples in a NAC concentration-dependent manner, with larger effect on let-7a transfected cells (Fig. 5B). Altogether, these data support the hypothesis that the increased sensitivity of let-7a treated cells to doxorubicin is caused by the let-7a-induced ROS. To assess if the reduction of cell number is due to the apoptosis, we performed the caspase 3/7-based assay. In melanoma cells let-7a strongly increased apoptotic death, while in MDA-MB-231 the difference compared to the negative control was not so pronounced (Fig. 5C).
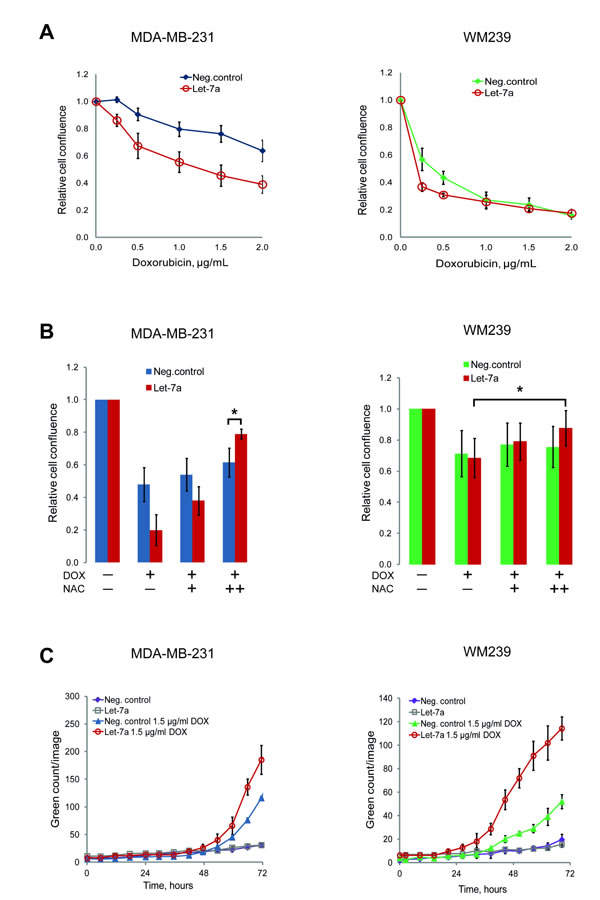
Figure 5: Let-7a sensitizes MDA-MB-231 and WM239 cells to doxorubicin. A, cells transfected with let-7a or negative control treated with 5 different concentrations of doxorubicin for 72 hours. The cell confluence of doxorubicin treated cells was normalized to that of doxorubicin untreated cells and the ratio was reported on the graph against doxorubicin concentrations. n=5, SD. B, cells were pre-treated with 2.5 and 5 mM of NAC for 5 hours before adding 2 µg/mL of doxorubicin. Confluence of cells treated with only doxorubicin or with doxorubicin and NAC was normalized to the confluence of transfected cells without any treatment, n=5, *p<0.05. C, caspase 3/7 based apoptosis assay was performed on transfected cells with or without doxorubicin treatment. Apoptosis reagent was added 48 hours after transfection and the cells were followed in the Incucyte. Representative experiment is shown, n=3.
Discussion
A distinctive metabolic feature of all rapidly dividing cells, including cancer cells, is the up-regulation of key anabolic enzymes. By analyzing the global transcriptome and proteome, we identified a number of key metabolic enzymes down-regulated in MDA-MB-231 cells upon let-7a transfection. Importantly, all of them fall into two major biosynthetic pathways: nucleotide (G6PD, TYMS, IMPDH2) and lipid (FASN, AASDHPPT, SCD) biosynthesis. G6PD is a rate-limiting enzyme of the oxidative branch of PPP that yields ribose 5-phosphate, a precursor for the de novo nucleotide biosynthesis, as well as the reducing equivalent NADPH, an essential cofactor of glutathione reductase. Inhibition of PPP causes NADPH depletion with a consequent decrease of the reduced-to-oxidized glutathione ratio [30]. A combination of reduced G6PD level and increased endogenous ROS should lead to the depletion of both NADPH and GSH. Surprisingly, we did not detect any reduction neither in NADPH level, nor in GSH (Fig. S8) in let-7a transfected cells, suggesting that alternative cellular sources may replenish the NADPH pool [31]. Both TYMS and IMPDH2 are up-regulated by the MYC oncoprotein [32, 33], which is a target of let-7, suggesting an indirect regulatory mechanism. TYMS is an essential enzyme of de novo thymidine monophosphate biosynthesis. Elevated TYMS level in cancer cells is considered to contribute to multidrug resistance. Of note, TYMS is a target of 5-fluorouracil, a chemotherapeutic drug used to treat a large variety of cancers [34]. IMPDH2 is a rate-limiting enzyme of the guanine nucleotide biosynthesis, also essential for DNA replication. The repression of these genes may be part of antiproliferative function of let-7a. A growing body of evidence indicates that FASN, the only enzyme that synthesizes fatty acids, acts as an oncogene and its overexpression is associated with poor prognosis in several malignant tumors [35, 36]. Thus, FASN has been considered as a target for anticancer therapy [37]. AASDHPPT, also reduced by let-7a, catalyzes the transfer of 4’-phosphopantetheine moiety to the acyl carrier domain of FASN [38]. This post-translational modification of the acyl carrier protein is essential for the functional maturation of FASN. The third enzyme of lipid biosynthesis pathway down-regulated by let-7a is a fatty acid desaturase SCD, which is also shown to be involved in cancer progression and considered to be an attractive target for anticancer therapy [39, 40]. The coordinated down-regulation of genes involved in nucleotide and lipid biosynthesis suggests a general repression of anabolic metabolism induced by let-7 miRNA, which may contribute to its tumor suppressive function.
Mitochondrial ROS formation, as a consequence of ongoing OXPHOS process, is an important part of cellular metabolism and plays an essential role in cell physiology. The ROS species have for a long time been considered harmful by-products of mitochondrial respiration. However, there is growing evidence that ROS generated by a variety of cellular processes act as signaling molecules regulating a large number of different functions, from immune response to differentiation [41]. Let-7 miRNAs promote a transition to terminal differentiation during development and maintain this differentiated state throughout life. In general, terminally differentiated cells rely on OXPHOS, while stem cells and cancer cells actively utilize aerobic glycolysis. Here we show that let-7a activates OXPHOS, which results in the generation of mitochondrial ROS in breast and melanoma cell lines. Even though the endogenous ROS level was elevated almost two-fold upon let-7a transfection, the cells did not display signs of apoptosis, suggesting that this ROS level was within a physiologic range. However, after treatment with the strong oxidant TBHP, let-7a transfected cells counteracted oxidative stress less efficiently than negative control cells did, likely due to cumulative effect of endogenous and exogenous ROS, which probably depleted their antioxidant defense capacity. Importantly, a recently published study has demonstrated that the epithelial-to-mesenchymal transition (EMT) of basal-like breast cancer is promoted by a metabolic switch to anaerobic glycolysis resulting in decreased ROS level [42]. MDA-MB-231 cells are classified as basal-like CD44high/CD24low [43], and in these, even though let-7a accelerated glycolysis, it also promoted mitochondrial OXPHOS and ROS production, which usually is associated with a differentiated phenotype. Another study has reported that increased OXPHOS in cancer cells reduces cancer aggressiveness, while decreased mitochondrial metabolism contributes to cancer progression [44]. Our data support this concept by showing an inverse correlation between the OXPHOS and cancer aggressiveness, and suggest that let-7 might counteract cancer-associated properties also at the metabolic level by promoting a more differentiated state.
The increase in endogenous ROS was associated with the coordinated up-regulation of antioxidant enzymes. Among them, the HMOX1 increase is of particular importance. In a recently published study, Hou W. et al reported that let-7 induces HMOX1 by suppressing the transcriptional repressor BACH1 in human hepatocytes. Here we showed that let-7a overexpression induced HMOX1 and repressed BACH1 also in breast cancer and melanoma cell lines. HMOX1 catalyzes heme degradation to release ferrous iron, carbon monoxide (CO) and biliverdin. Biliverdin inhibits proliferative and angiogenic pathways in head and neck cancer, while CO at low concentrations has a potent anti-inflammatory effect [45, 46]. The induction of HMOX1 by let-7 might potentiate anti-proliferative effects of let-7 on cancer cells while decreasing inflammatory responses that often accompanies tumor development.
Interestingly, we also found increased ECAR as well as glucose uptake, indicating that let-7a enhances glycolytic flux. Previously, let-7 has been shown to regulate glucose metabolism through the repression of mTOR pathway [23]. However, in breast cancer and melanoma cell lines examined in our study let-7a did not alter the phosphorylation status of mTOR nor of its downstream component S6 (Fig. S7A and B). This is in line with the recent study by Xiaoyu Ma et al., where they showed that in hepatocellular carcinoma let-7 promoted OXPHOS without affecting mTOR pathway [24]. Multiple mechanisms governing the balance between glycolysis and OXPHOS might exist in different cancer types, which would reflect the metabolic heterogeneity and flexibility of cancer cells. The main function of upregulated glucose uptake and aerobic glycolysis in rapidly dividing cancer cells is to provide anabolic precursors. However, the repression of key anabolic enzymes and the decrease in proliferation in let-7a overexpressing cells is not compatible with acceleration of anabolic metabolism, suggesting an alternative role for the sustained glycolysis in these cells. Increase in ECAR has been seen during adipocyte differentiation [47]. As a promoter of terminal differentiation, let-7a might have triggered differentiation processes by similar mechanisms, which could explain the increase in the glycolytic rate. Furthermore, glycolysis is the main source of energy for cellular morphological transformations during differentiation [48, 49]. Dramatic shape changes observed in both cell lines upon let-7a transfection might therefore, at least partly, explain increased need for glycolysis.
To extend our findings to a cancer type different from the epithelial one, we overexpressed let-7a in the WM239 melanoma cell line. Although OCR was unchanged in let-7a transfected cells, we detected increased mitochondrial membrane potential and superoxide ROS level as well as glucose uptake, while a pre-treatment with CCCP abolished the ROS formation. Increased mitochondrial activity, but not the oxygen consumption might derive from defects in ETC complexes [50, 51]. Let-7a also induced the expression of HMOX1 and repressed BACH1 in WM239 cells. These data reinforce the hypothesis of the general biological role of let-7 in regulating mitochondrial and redox metabolism.
Doxorubicin, a widely-used antitumor drug, blocks mitosis by specific intercalation within the DNA double helix. However, the treatment has severe side-effects, such as cardiomyopathy, making it imperative to obtain a therapeutic effect at the lowest dose possible. Let-7 miRNA is often reduced in cancer cells and the restoration of its physiological levels is expected to have a therapeutic potential [52]. We investigated whether cancer cells can be sensitized to doxorubicin by increasing let-7a levels. A combination of let-7a overexpression and doxorubicin treatment produced a powerful effect on cell proliferation at 0.25 µg/mL of doxorubicin, the lowest dose tested, in both breast cancer and melanoma. The addition of antioxidant NAC attenuated this effect indicating that it occurred through the cumulative ROS level. In WM239 cells caspase-based apoptosis assay showed a striking increase in apoptotic cells in let-7a sample after the doxorubicin treatment, while in MDA-MB-231 cells the difference in apoptosis between let-7a treated and negative control cells was less prominent. The difference between cell lines might be explained by another type of ongoing cellular death, like necrosis, in MDA-MB-231 cells. In this study we uncovered a role of let-7 miRNA in regulating energy and redox metabolism. Our data provide a new insight into the tumor suppressive mechanisms of let-7 miRNA and offers new therapeutic opportunities for evaluation.
Materials and methods
Cell lines and culturing
The MDA-MB-231 triple-negative breast cancer cell line was obtained from American Type Culture Collection and the WM239 metastatic melanoma cell line from the Wistar Institute. Cell lines were STR-DNA profiled (Genotyping core facility, Oslo University Hospital) and are routinely mycoplasma tested. MDA-MB-231 cells were cultured in RPMI1640 and WM239 in DMEM, both supplemented with 10% fetal bovine serum (all from Sigma, Steinheim, Germany), 1% L-glutamate (GlutaMAX, Sigma) and 1% of penicillin G and streptomycin sulphate (Sigma). Cells were passaged twice a week in order to keep the cell confluence between 15 and 80%.
Transient transfection
Transient transfection was performed using 18 nM of let-7a pre-miRTM miRNA Precursors or Negative control #2 oligos (Ambion, Grand Island, USA) and the lipidic transfection agent Interferin (PolyPLUS, Illkirch, France) according to the manufacturer’s protocol. For more details see Supplementary Material and Methods (SMM).
Western blotting
Total protein lysate was generated on day 3 post transfection using 3% SDS lysis buffer. The protein concentration was determined by the Bio-Rad Protein Assay (Bio-Rad, Hercules, USA). Proteins of interest were detected by primary antibody followed by the appropriate secondary Ab (anti-rabbit or anti-mouse (Dako, Glostrup, Denmark)). Relative expression of the detected proteins normalized to α-tubulin was quantified using the Gene Tools densitometry software (Syngene, Cambridge, UK). Relative quantification is presented as a mean ± SD of at least three independent experiments. For more details and the list of Ab used see SMM.
Quantitative real-time PCR
Isolation of total RNA and cDNA synthesis were performed using Cell-to-Ct kit for mRNA (Ambion), following the manufacturers protocol. Reaction mix for quantitative polymerase chain reaction (qPCR) was prepared using cDNA from 100 to 500 cells/well and TaqMan gene expression master mix (Ambion). The relative expression levels were determined using the comparative threshold cycle (2−ΔΔCT). Ct values were normalized to the endogenous internal control genes TBP or GAPDH which maintained stable expression levels through experiments. Normalized Ct values were presented relative to negative control oligos. Results are presented as a mean ± SD of at least three independent experiments. For more details and the list of primers used see SMM.
Microarray analysis
Total RNA was isolated by TriReagent (Ambion), according to the manufacture’s instruction. Global mRNA expression analysis of MDA-MB-231 cells on day 3 post transfection with let-7a mimic or negative control oligos was performed at the Oslo University Hospital Genomics Core Facility (http://oslo.genomics.no), using the Illumina HumanHT12 v4 Expression BeadChip (Illumina, San Diego, USA) according to the manufacturer’s protocol. All analyses were performed with species filter set to human. For more details see SMM.
Stable isotope labeling with amino acids in cell culture (SILAC)
SILAC was performed using Pierce® SILAC Protein Quantification Kit (Thermo scientific, Waltham, USA). MDA-MB-231 cells were cultured for 4 days in SILAC RPMI1640 medium supplemented with 10% of dialyzed FBS and 50mg 13C6 L-lysine-2HCl/13C615N4 L-arginine-HCl or L-lysine-2HCl/L-arginine-HCl according to the manufacturer’s protocol. For detailed description see SMM.
Cell cycle analysis
On day 3 post transfection cells were trypsinized and resuspended in culture medium. 2 µg/mL of Hoechst 33342 (Thermo Scientific) were added, and the cell suspension was incubated for 20 min at 37°C. 1x10⁵ cells per sample were analyzed by flow cytometry at excitation/emission = 346/497 nm on LSR II (Becton Dickinson, Franklin Lakes, USA). The data were processed by FlowJo Version 7.2.4 (Tree Star, Ashland, USA) and Dean-Jett-Fox model was applied. Results are presented as a mean fold-change ± SD of at least three independent experiments.
Cell growth
Cell growth was monitored using the IncuCyte Kinetic Imaging System (Essen BioScience, Welwyn Garden City, UK) that estimates cell number based on confluence. Cells were scanned every second hour from day 1 to day 3 post transfection. Additionally, cells were counted on day 3 post transfection using Trypan Blue (Sigma) and an automated cell counter Countess (Invitrogen, Grand Island, USA). Cell viability was assessed on day 3 post transfection by Trypan Blue as well as by Caspase-Glo 3/7 luminescence-based Assay (Promega, Mannheim, Germany), according to the manufacturers protocol. All tests were performed in triplicates, and at least three independent experiments.
Colony formation assay
On day 2 post transfection 800 cells/well mixed with Methylcellulose-based medium (MethoCult™ H4100 STEMCELL technologies, Grenoble, France) supplemented with 10% FBS, 1% L-glutamine and 60% DMEM, were seeded in 24-well low adhesion plates in triplicates. Cells were incubated at 37°C for 10-14 days and subsequently stained with 0.4 mg/mL of 3-(4,5-dimethylthiazol-2-yl)-2,5-diphenyltetrazolium bromide (MTT) for four hours (Life Technologies, Grand Island, USA). Colonies larger than 50 µm were detected and counted on the Gel Count (Oxford Optronix, Abingdon, UK). Quantification is presented as an average fold-change to negative control ± SD of at least three independent experiments.
Oxygen consumption and extracellular acidification rate
Oxygen consumption rate (OCR) and extracellular acidification rate (ECAR) were measured with a XFe Extracellular Flux Analyzer (Seahorse Bioscience, North Billerica, USA) according to the manufacturer’s instructions. Cells were seeded in Seahorse plate on day 2 post transfection and cultured overnight to reach 80% confluence. One hour before the measurement, the culture medium was replaced with the cellular assay medium (Seahorse Bioscience) and incubated for 1 hour in a CO2-free incubator. The mito- and glyco stress-test were performed according to Seahorse protocols, with the final concentrations of 1µM FCCP, 1µM oligomycin and 1µM rotenone, and 10mM of glucose, 1µM of oligomycin and 100mM of 2-Deoxy-D-glucose, respectively. OCR and ECAR were normalized to the protein concentration and/or DNA content in each well at the end of the experiment. Results are presented as an average fold-change ± SD of at least three independent experiments.
Glucose uptake
Glucose uptake was measured using a fluorescent glucose analogue 2-(N-(7-Nitrobenz-2-oxa-1,3-diazol-4-yl)Amino)-2-Deoxyglucose (2-NBDG) (Invitrogen). Briefly, on day 3 post transfection culture medium was replaced with fresh medium containing 50 µM of 2-NBDG. The cells were incubated for 2 hours at 37°C. 1x10⁵ cells per sample were analyzed by flow cytometry at excitation/emission = 465/540 nm on LSR II. The data were processed by FlowJo Version 7.2.4. Results are presented as a mean fold-change ± SEM of at least three independent experiments.
Mitochondrial membrane potential
Mitochondrial membrane potential was measured using the JC-1 fluorescent dye (Invitrogen). On day 3 post transfection, cells were treated with 2 µM of JC-1 and incubated for 45 min at 37°C. As a control for JC-1 specificity, additional samples were co-treated with 10 µM of CCCP or DMSO only. 1x10⁵ cells per sample were analyzed using LSR-II(BD) flow cytometer with laser 488 and emission filter 525/50 nm for green signal and laser 561 and emission filter 582/15 for red signal. Data were processed by FlowJo v7.6.5. Signal from aggregates (red) and monomers (green) of JC-1 was normalized to negative control which was set at 1. Data are presented as ratio of red to green signal and a mean fold-change ± SEM of at least three independent experiments.
Cellular ROS level
Cellular ROS level was assessed using 2’,7’-dichlorofluorescein diacetate (DCFDA) Assay Kit (Abcam, Cambrige, UK). On day 3 post transfection, cells were collected into flow cytometry tubes in culture medium supplemented with 20 µM DCFDA and incubated for 2 hours at 37°C. 50 µM of tert-butyl hydrogen peroxide (TBHP) was used as a ROS positive control according to the manufacturer’s protocol. During incubation the cells were re-suspended periodically by shaking. To dissipate the mitochondrial proton gradient, 10 µM of CCCP or DMSO-only control was added to the cells together with DCFDA and incubated for 1.5 hour at 37°C. 1x10⁵ cells per sample were analyzed at excitation/emission = 485/535 nm. Results are presented as a mean ± SEM of at least three independent experiments. For superoxide detection MitoSOX fluorescent dye was used (Lifetechnology). On day 3 post transfection cells were trypsinized and resuspended in the culture medium with 5 µM of MitoSOX dye, incubated for 25 min and subjected to the flow cytometry. 1x10⁵ cells per sample were analyzed at excitation/emission = 510/580 nm.
Doxorubicin experiment
1000 cells/well were seeded 48 hours post transfection in 96 well-plate in culture medium and allowed to adhere. Subsequently, doxorubicin (CAELYX) was added to the cells in five different concentrations: 0.25 µg/mL, 0.5 µg/mL, 1 µg/mL, 1.5 µg/mL and 2 µg/mL. Cells were monitored in the Incucyte to estimate the cell growth, n=5. For the NAC experiment, cells were pre-treated with 2.5 mM or 5 mM of NAC 2 hours before the addition of doxorubicin and followed in the Incucyte, n=5. The cell confluence of doxorubicin-treated cells was normalized to the cell confluence of untreated cells and obtained ratio was reported on the graph against doxorubicin concentration. All tests were performed in triplicates. Results are presented as a mean ± SD of at least three independent experiments. For the apoptosis assay, 2.5 µM of cell CellPlayer™ Kinetic Caspase-3/7 Apoptosis Assay Reagent (EssenBio) was added together with doxorubicin. Count of green events was performed in the Incucyte ZOOM over time, n=3.
Acknowledgments
The authors thank Helen Pelicano (MD Anderson Cancer Center, Houston, USA) for the assistance with the Seahorse analysis. They also thank Mirna Therapeutics (Austin, USA) for providing let-7 miRNA mimics for the initial study.
Funding
The study was supported by grants from the Southern and Eastern Norway Regional Health Authority, Norwegian Research Council, and Gene Therapy program from the Oslo University Hospital.
Disclosure of interests
The authors have no conflicts of interest to disclose.
References
1. Reinhart BJ, Slack FJ, Basson M, Pasquinelli AE, Bettinger JC, Rougvie AE, Horvitz HR and Ruvkun G. The 21-nucleotide let-7 RNA regulates developmental timing in Caenorhabditis elegans. Nature. 2000; 403(6772):901-906.
2. Pasquinelli AE, Reinhart BJ, Slack F, Martindale MQ, Kuroda MI, Maller B, Hayward DC, Ball EE, Degnan B, Muller P, Spring J, Srinivasan A, Fishman M, Finnerty J, Corbo J, Levine M, et al. Conservation of the sequence and temporal expression of let-7 heterochronic regulatory RNA. Nature. 2000; 408(6808):86-89.
3. Nair VS, Maeda LS and Ioannidis JP. Clinical outcome prediction by microRNAs in human cancer: a systematic review. Journal of the National Cancer Institute. 2012; 104(7):528-540.
4. Shell S, Park SM, Radjabi AR, Schickel R, Kistner EO, Jewell DA, Feig C, Lengyel E and Peter ME. Let-7 expression defines two differentiation stages of cancer. Proceedings of the National Academy of Sciences of the United States of America. 2007; 104(27):11400-11405.
5. Yu F, Yao H, Zhu P, Zhang X, Pan Q, Gong C, Huang Y, Hu X, Su F, Lieberman J and Song E. let-7 regulates self renewal and tumorigenicity of breast cancer cells. Cell. 2007; 131(6):1109-1123.
6. Esquela-Kerscher A, Trang P, Wiggins JF, Patrawala L, Cheng A, Ford L, Weidhaas JB, Brown D, Bader AG and Slack FJ. The let-7 microRNA reduces tumor growth in mouse models of lung cancer. Cell cycle (Georgetown, Tex. 2008; 7(6):759-764.
7. Hanahan D and Weinberg RA. Hallmarks of cancer: the next generation. Cell. 2011; 144(5):646-674.
8. Lunt SY and Vander Heiden MG. Aerobic glycolysis: meeting the metabolic requirements of cell proliferation. Annual review of cell and developmental biology. 2011; 27:441-464.
9. Jiang P, Du W, Wang X, Mancuso A, Gao X, Wu M and Yang X. p53 regulates biosynthesis through direct inactivation of glucose-6-phosphate dehydrogenase. Nature cell biology. 2011; 13(3):310-316.
10. Ying H KA, Lyssiotis CA, Hua S, Chu GC, Fletcher-Sananikone E, Locasale JW, Son J, Zhang H, Coloff JL, Yan H, Wang W, Chen S, Viale A, Zheng H, Paik JH, Lim C, Guimaraes AR, Martin ES, Chang J, Hezel AF, Perry SR, Hu J, Gan B, Xiao Y, Asara JM, Weissleder R, Wang YA, Chin L, Cantley LC, DePinho RA. Oncogenic Kras maintains pancreatic tumors through regulation of anabolic glucose metabolism. Cell. 2012.
11. Menendez JA and Lupu R. Fatty acid synthase and the lipogenic phenotype in cancer pathogenesis. Nature reviews. 2007; 7(10):763-777.
12. Liu. Fatty acid synthase causes drug resistance by inhibiting TNF-α and ceramide production. J Lipid Res. 2013.
13. Bellance N, Benard G, Furt F, Begueret H, Smolkova K, Passerieux E, Delage JP, Baste JM, Moreau P and Rossignol R. Bioenergetics of lung tumors: alteration of mitochondrial biogenesis and respiratory capacity. The international journal of biochemistry & cell biology. 2009; 41(12):2566-2577.
14. Parlo RA and Coleman PS. Enhanced rate of citrate export from cholesterol-rich hepatoma mitochondria. The truncated Krebs cycle and other metabolic ramifications of mitochondrial membrane cholesterol. The Journal of biological chemistry. 1984; 259(16):9997-10003.
15. Sanchez-Arago M, Chamorro M and Cuezva JM. Selection of cancer cells with repressed mitochondria triggers colon cancer progression. Carcinogenesis. 2010; 31(4):567-576.
16. Ito K, Hirao A, Arai F, Matsuoka S, Takubo K, Hamaguchi I, Nomiyama K, Hosokawa K, Sakurada K, Nakagata N, Ikeda Y, Mak TW and Suda T. Regulation of oxidative stress by ATM is required for self-renewal of haematopoietic stem cells. Nature. 2004; 431(7011):997-1002.
17. Smith J. Redox state is a central modulator of the balance between self-renewal and differentiation in a dividing glial precursor cell. Proceedings of the National Academy of Sciences of the United States of America. 2000.
18. Tormos KV, Anso E, Hamanaka RB, Eisenbart J, Joseph J, Kalyanaraman B and Chandel NS. Mitochondrial complex III ROS regulate adipocyte differentiation. Cell metabolism. 2011; 14(4):537-544.
19. Diehn M, Cho RW, Lobo NA, Kalisky T, Dorie MJ, Kulp AN, Qian D, Lam JS, Ailles LE, Wong M, Joshua B, Kaplan MJ, Wapnir I, Dirbas FM, Somlo G, Garberoglio C, et al. Association of reactive oxygen species levels and radioresistance in cancer stem cells. Nature. 2009; 458(7239):780-783.
20. Jerby L, Wolf L, Denkert C, Stein GY, Hilvo M, Oresic M, Geiger T and Ruppin E. Metabolic associations of reduced proliferation and oxidative stress in advanced breast cancer. Cancer research. 2012; 72(22):5712-5720.
21. Armstrong L, Tilgner K, Saretzki G, Atkinson SP, Stojkovic M, Moreno R, Przyborski S and Lako M. Human induced pluripotent stem cell lines show stress defense mechanisms and mitochondrial regulation similar to those of human embryonic stem cells. Stem cells (Dayton, Ohio). 2010; 28(4):661-673.
22. Trachootham D, Alexandre J and Huang P. Targeting cancer cells by ROS-mediated mechanisms: a radical therapeutic approach? Nat Rev Drug Discov. 2009; 8(7):579-591.
23. Zhu H, Shyh-Chang N, Segre AV, Shinoda G, Shah SP, Einhorn WS, Takeuchi A, Engreitz JM, Hagan JP, Kharas MG, Urbach A, Thornton JE, Triboulet R, Gregory RI, Altshuler D and Daley GQ. The Lin28/let-7 axis regulates glucose metabolism. Cell. 2011; 147(1):81-94.
24. Ma X, Li C, Sun L, Huang D, Li T, He X, Wu G, Yang Z, Zhong X, Song L, Gao P and Zhang H. Lin28/let-7 axis regulates aerobic glycolysis and cancer progression via PDK1. Nature communications. 2014; 5:5212.
25. Korshunov SS, Skulachev VP and Starkov AA. High protonic potential actuates a mechanism of production of reactive oxygen species in mitochondria. FEBS letters. 1997; 416(1):15-18.
26. Turrens JF. Mitochondrial formation of reactive oxygen species. The Journal of physiology. 2003; 552(Pt 2):335-344.
27. Miwa S and Brand MD. Mitochondrial matrix reactive oxygen species production is very sensitive to mild uncoupling. Biochemical Society transactions. 2003; 31(Pt 6):1300-1301.
28. Hou W, Tian Q, Steuerwald NM, Schrum LW and Bonkovsky HL. The let-7 microRNA enhances heme oxygenase-1 by suppressing Bach1 and attenuates oxidant injury in human hepatocytes. Biochim Biophys Acta. 2012; 1819(11-12):1113-1122.
29. Wang S KE, Kotamraju S, Joseph J, Kalivendi S, Kalyanaraman B. Doxorubicin induces apoptosis in normal and tumor cells via distinctly different mechanisms. intermediacy of H(2)O(2)- and p53-dependent pathways. The Journal of biological chemistry. 2004.
30. Ho HY, Cheng ML, Lu FJ, Chou YH, Stern A, Liang CM and Chiu DT. Enhanced oxidative stress and accelerated cellular senescence in glucose-6-phosphate dehydrogenase (G6PD)-deficient human fibroblasts. Free radical biology & medicine. 2000; 29(2):156-169.
31. Fan J, Ye J, Kamphorst JJ, Shlomi T, Thompson CB and Rabinowitz JD. Quantitative flux analysis reveals folate-dependent NADPH production. Nature. 2014.
32. Liu YC, Li F, Handler J, Huang CR, Xiang Y, Neretti N, Sedivy JM, Zeller KI and Dang CV. Global regulation of nucleotide biosynthetic genes by c-Myc. PloS one. 2008; 3(7):e2722.
33. Mannava S, Grachtchouk V, Wheeler LJ, Im M, Zhuang D, Slavina EG, Mathews CK, Shewach DS and Nikiforov MA. Direct role of nucleotide metabolism in C-MYC-dependent proliferation of melanoma cells. Cell cycle (Georgetown, Tex. 2008; 7(15):2392-2400.
34. Garg D, Henrich S, Salo-Ahen OM, Myllykallio H, Costi MP and Wade RC. Novel approaches for targeting thymidylate synthase to overcome the resistance and toxicity of anticancer drugs. Journal of medicinal chemistry. 2010; 53(18):6539-6549.
35. Yoshii Y, Furukawa T, Oyama N, Hasegawa Y, Kiyono Y, Nishii R, Waki A, Tsuji AB, Sogawa C, Wakizaka H, Fukumura T, Yoshii H, Fujibayashi Y, Lewis JS and Saga T. Fatty acid synthase is a key target in multiple essential tumor functions of prostate cancer: uptake of radiolabeled acetate as a predictor of the targeted therapy outcome. PloS one. 2013; 8(5):e64570.
36. Zaytseva YY, Elliott VA, Rychahou P, Mustain WC, Kim JT, Valentino J, Gao T, O’Connor KL, Neltner JM, Lee EY, Weiss HL and Evers BM. Cancer cell-associated fatty acid synthase activates endothelial cells and promotes angiogenesis in colorectal cancer. Carcinogenesis. 2014.
37. Pandey PR, Liu W, Xing F, Fukuda K and Watabe K. Anti-cancer drugs targeting fatty acid synthase (FAS). Recent patents on anti-cancer drug discovery. 2012; 7(2):185-197.
38. Joshi AK, Zhang L, Rangan VS and Smith S. Cloning, expression, and characterization of a human 4’-phosphopantetheinyl transferase with broad substrate specificity. The Journal of biological chemistry. 2003; 278(35):33142-33149.
39. Morgan-Lappe SE, Tucker LA, Huang X, Zhang Q, Sarthy AV, Zakula D, Vernetti L, Schurdak M, Wang J and Fesik SW. Identification of Ras-related nuclear protein, targeting protein for xenopus kinesin-like protein 2, and stearoyl-CoA desaturase 1 as promising cancer targets from an RNAi-based screen. Cancer research. 2007; 67(9):4390-4398.
40. Igal RA. Stearoyl-CoA desaturase-1: a novel key player in the mechanisms of cell proliferation, programmed cell death and transformation to cancer. Carcinogenesis. 2010; 31(9):1509-1515.
41. D’Autréaux. ROS as signalling molecules: mechanisms that generate specificity in ROS homeostasis. Nature Reviews Molecular Cell Biology. 2007.
42. Dong C, Yuan T, Wu Y, Wang Y, Fan TW, Miriyala S, Lin Y, Yao J, Shi J, Kang T, Lorkiewicz P, St Clair D, Hung MC, Evers BM and Zhou BP. Loss of FBP1 by Snail-mediated repression provides metabolic advantages in basal-like breast cancer. Cancer cell. 2013; 23(3):316-331.
43. Fillmore. Human Breast Cancer Cell Lines Contain Stem-like Cells That Self-renew, Give Rise to Phenotypically Diverse Progeny and Survive Chemotherapy Breast Cancer Research. 2008.
44. Wang X and Moraes CT. Increases in mitochondrial biogenesis impair carcinogenesis at multiple levels. Molecular oncology. 5(5):399-409.
45. Otterbein LE1 BF, Alam J, Soares M, Tao Lu H, Wysk M, Davis RJ, Flavell RA, Choi AM. Carbon monoxide has anti-inflammatory effects involving the mitogen-activated protein kinase pathway. Nat Med. 2000.
46. Zheng J, Nagda DA, Lajud SA, Kumar S, Mouchli A, Bezpalko O, O’Malley BW, Jr. and Li D. Biliverdin’s regulation of reactive oxygen species signalling leads to potent inhibition of proliferative and angiogenic pathways in head and neck cancer. British journal of cancer. 2014; 110(8):2116-2122.
47. Debora Esposito MW, Haley Holway and Slavko Komarnytsky. Bioenergetic characterization of adipogenesis impaired by inflammation The FASEB Journal. 2013.
48. Masters C. Cellular differentiation and the microcompartmentation of glycolysis. Mechanisms of ageing and development. 1991; 61(1):11-22.
49. Venter G, Oerlemans FT, Wijers M, Willemse M, Fransen JA and Wieringa B. Glucose controls morphodynamics of LPS-stimulated macrophages. PloS one. 2014; 9(5):e96786.
50. Schapira AH. Human complex I defects in neurodegenerative diseases. Biochim Biophys Acta. 1998; 1364(2):261-270.
51. Bonora E, Porcelli AM, Gasparre G, Biondi A, Ghelli A, Carelli V, Baracca A, Tallini G, Martinuzzi A, Lenaz G, Rugolo M and Romeo G. Defective oxidative phosphorylation in thyroid oncocytic carcinoma is associated with pathogenic mitochondrial DNA mutations affecting complexes I and III. Cancer research. 2006; 66(12):6087-6096.
52. Trang P, Medina PP, Wiggins JF, Ruffino L, Kelnar K, Omotola M, Homer R, Brown D, Bader AG, Weidhaas JB and Slack FJ. Regression of murine lung tumors by the let-7 microRNA. Oncogene. 2010; 29(11):1580-1587.