
INTRODUCTION
Germline mutations in the TP53 tumor suppressor gene cause Li-Fraumeni syndrome (LFS), an autosomal dominantly inherited predisposition syndrome to various cancers, including osteosarcoma (OS) [1, 2]. TP53 coding mutations can be identified in 70% of classic LFS families [3] leaving a significant proportion of LFS cases with an unknown genetic basis. The vast majority of TP53 mutations in LFS, OS and other tumors are point mutations dominated by missense mutations [4]. Larger germline deletions encompassing the entire TP53 gene together with neighboring genes have been described to correlate with developmental delay [5]. Partial deletions of TP53 have been found to be associated with LFS suggesting that the partial loss of TP53 has a different functional outcome than the entire deletion of the gene [5]. Some genomic structural variations (SVs) have been described that can affect TP53 function. These SVs are either deletions, which were identified by PCR based methods or comparative genome hybridization, that affect the TP53 gene in LFS patients [5, 6], or rearrangements in intron 1 of TP53 which initially have been identified by Southern blot in OS [7–9]. Recently, whole-genome sequencing of tumors from 32 OS patients showed cancer-specific TP53 rearrangements in > 50% of patients [10].
p53 is a DNA-damage response protein [11] and its inactivation could be expected to result in further genomic instability [12]. Mutations of TP53 are among the most common defects associated with human cancer in general. Given the large number of TP53 point mutations which have been identified in the majority of cancer types, it is surprising that TP53 intron 1 rearrangements have only been found in OS [7–10]. Since exome sequencing does not allow the identification of copy number neutral genome rearrangements with intergenic or intronic breakpoints, it is possible that TP53 intron 1 rearrangements have been missed in many studies. In addition, the suggested specificity of TP53 intron 1 rearrangements for OS is based on screens of a limited number of samples [7–9]. Further, it seems possible that TP53 intron 1 rearrangements do not only contribute to sporadic OS but also to LFS, which is driven by germline TP53 mutations. In the present study, we analyze the nature of TP53 intron 1 rearrangements, screen the to date largest collection of OS and other tumor types for such rearrangements, describe the identification of a TP53 intron 1 disrupting germline inversion in a four generation LFS family and characterize this locus and TP53 activity in tumors of this family.
RESULTS
Characterization of recurrent rearrangement points in intron 1 of TP53
We analyzed the genome structures of four pre-therapeutic OS using DNA paired-end tag sequencing (DNA-PET), a genome-wide mate-pair sequencing approach [13–15] and predicted 434, 289, 348 and 420 SVs, respectively, to be somatically acquired (Supplementary Tables S1–S6, Figures S1A and S1B, S2 and S3A, S3B and S3C). We identified seven breakpoints within a small region of intron 1 of TP53 in three OS tumors (Figure 1, Figure S4 and Supplementary Table S7) and the fourth (AJF) had a 94 kb deletion that included the entire TP53 gene as well as neighboring genes (Figure 1A and 1B). Tumor YZH showed a balanced translocation between TP53 intron 1 and chromosome 1. The sequence of the breakpoints showed the presence of the same 555 bp and 293 bp of the TP53 and chromosome 1 loci, respectively, on both sides of the translocations (Supplementary Figure S5A and S5B). Tumor PZP had a 12.5 kb inverted insertion originating from chromosome 6 containing ENPP1 exons 19 to 25 including the stop codon (Supplementary Figure S6A and S6B). In addition, the TP53 intronic sequences on both sides of the insertion overlapped by 59 bp suggesting that a similar mechanism was responsible for the translocations in both YZH and PZP. Tumor KRD had complex inter-chromosomal translocations with the three different partner chromosomes 1, 5 and 6 (Figure 1B) implying that these are three independent events. At least one event had to be non-clonal meaning that two or three independent clones with structural rearrangements in TP53 intron 1 underlie this tumor. The translocation breakpoints in intron 1 of TP53 with chromosomes 1 and 6 were only 45 bp apart with an overlap of 46 bp of the intron 1 sequence. The overlap and orientations were compatible with one event of similar mechanism as for tumors YZH and PZP. In contrast, the DNA-PET mapping regions of the chromosome 5 translocation suggest that this rearrangement occurred on the other allele of TP53 or in an independent clone (Figure 1B).
Centromeric of the breakpoint cluster region (2.5 kb of its center towards exon 1 of TP53) data of the Encyclopedia of DNA Elements (ENCODE) [16] show strong signals of open chromatin and active enhancers. It seems possible that the open chromatin state and/or the active transcription of TP53 contribute to the rearrangement mechanism. Six of the seven breakpoints were located within long interspersed elements (LINE), and the seventh breakpoint was within a short interspersed element (SINE). While the breakpoint partner sites do not show enrichment for LINE or SINE sequences, it is striking that five of the seven partner breakpoints also have strong signals of open chromatin within a region of 10 kb (Supplementary Figures S7A and S7B, and S8 to S12).
In two of the three tumors with TP53 intron 1 rearrangements, the breakpoint locations predicted gene fusions forming TP53-ENPP1-TP53 and SUCO-TP53 (Supplementary Table S7). Interestingly, both fusion gene partners are involved in bone biology. ENPP1 has been shown to be a key regulator of ossification [17]. SUCO (SUN domain containing ossification factor) is an essential regulator of postnatal osteoblast maturation [18]. Furthermore, we found both genes expressed in a collection of in-house established OS cell lines (unpublished data). The expression of the rearranged genes in bone supports the idea that active expression might mechanistically contribute to the translocations.
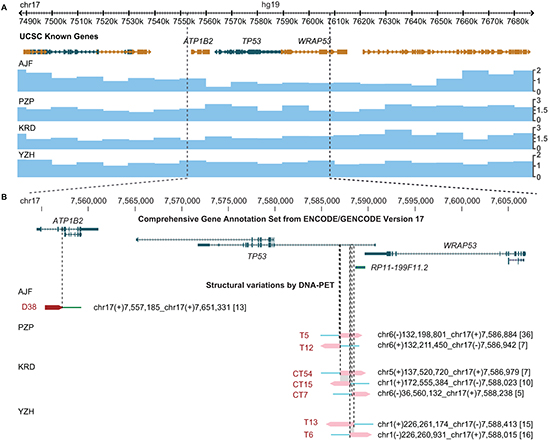
Figure 1: Translocation hotspot in intron 1 of TP53 in OS samples. (A) Genes derived from the UCSC known genes database [43] (top) and copy number information derived from DNA-PET sequencing data of four OS samples (blue tracks, bottom) are shown in the Genome Browser. Genes transcribed from the plus strand are represented in gold, genes transcribed from the minus strand are represented in green. Boxes indicate exons, barbed lines indicate introns. The TP53 locus for patients PZP, KRD, and YZH has a copy number of two while patient AJF shows loss of one copy. (B) Enlargement of gene (top) and breakpoint (bottom) view of the TP53 locus. GENCODE transcripts with unresolved problems have been excluded. Note that TP53 is transcribed on the minus strand (from right to left). Mapping regions of DNA-PET sequence tags which represent a rearrangement are shown as dark red (5'-tags) and pink (3'-tags) arrow heads with the predicted breakpoint being located at the tip of the dark red and the base of the pink arrow heads (dashed lines). SV identifiers are in red letters, predicted breakpoint locations and connections are indicated for each rearrangement in black letters. Numbers in squared brackets indicate number of PETs which connect the two genomic regions of a SV (dPET cluster size). Shaded in gray are stretches of identical sequences for both breakpoint sides.
Somatic TP53 rearrangements are a frequent phenomenon specific for OS
We designed a break-apart FISH test using probes flanking the TP53 gene (Figure 2A) and investigated a series of 215 pre-therapeutic OS samples arranged on a tissue microarray (TMA). We found 11% (23 out of 215) of the cases to have rearrangements at the TP53 locus (FISH break-apart positive; Figure 2B). Of note, in all 23 FISH positive cases, both alleles showed the break-apart signal. However, FISH positive patients did not differ from negative patients in terms of overall-survival (p = 0.6), event-free survival (p = 0.7), occurrence of metastases, or response to neoadjuvant chemotherapy (Table 1 and Supplementary Tables S8 and S9). Rearrangements at this locus nevertheless appear to be a recurrent finding in OS. To test whether the TP53 rearrangement also occurred in other bone-forming tumors that sometimes can be difficult to distinguish histologically from OS in small biopsies, we analyzed another series of 124 bone-forming tumors and tumor-like lesions using our FISH assay. None of these cases showed evidence of TP53 rearrangement. To further exclude TP53 intron 1 rearrangements in other tumor types we used our FISH assay to analyze an additional 966 tumors on a TMA (Supplementary Tables S10 and S11). None of the 966 tumors showed a break-apart signal suggesting the somatic TP53 intron 1 rearrangements represent a specific finding in OS.
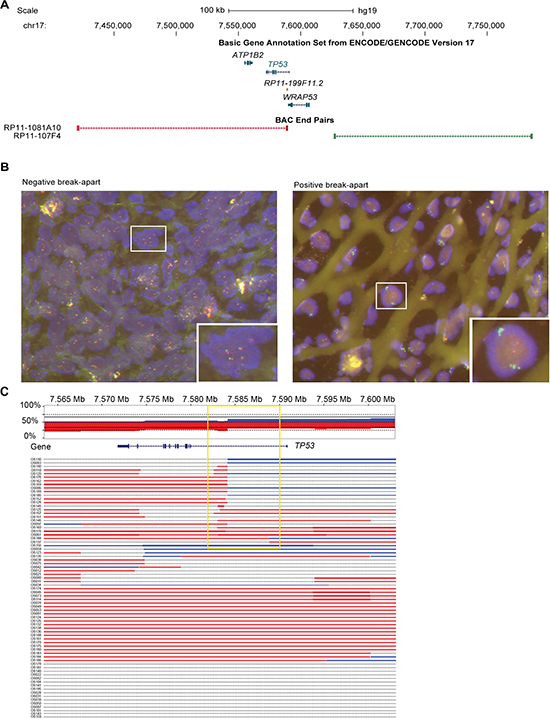
Figure 2: Translocation hotspot in intron 1 of TP53 in OS samples. (A) Location of BAC clones which have been selected for FISH relative to TP53 and immediate neighbouring genes. Other genes of the track have been deleted for clarity. Color code matches fluorophore of FISH analysis shown in B. (B) Examples of a negative and positive break-apart signal of two color FISH which has been used to screen 267 formalin fixed and paraffin embedded (FFPE) OS samples and 141 other bone-forming tumors. (C) Copy number overview of 73 OS tumors at the TP53 locus based on CytoScan array analysis. Top panel shows the cumulative copy number across all samples with red indicating loss and blue gain in copy number. Lower panel shows the copy number gains and losses for each of the 73 OS tumors individually. Note the changes in copy number within intron 1 of TP53 detectable in 23 cases (yellow box).
Table 1: Characteristics of OS patients
OS TMA |
OS fresh frozen |
|||
All |
FISH positive (out of 215 evaluable) |
All |
Intron 1 CN change |
|
Gender |
254/267 (95.1%) |
23/23 (100%) |
73/73 (100%) |
24/24 (100%) |
male |
129 |
9 |
39 |
13 |
female |
125 |
14 |
34 |
11 |
Age at diagnosis |
258/267 (96.6%) |
23/23 (100%) |
73/73 (100%) |
24/24 (100%) |
average |
24.3 years |
17 years |
17.3 years |
18.6 years |
median |
17 years |
15 years |
15 years |
15.5 years |
range |
4–88 years |
6–48 years |
3–56 years |
5–56 years |
Observation period |
259/267 (97%) |
23/23 (100%) |
72/73 (98.6%) |
24/24 (100%) |
average |
61.6 months |
46.6 months |
73.9 months |
64.6 months |
median |
35 months |
24 months |
66.5 months |
64 months |
range |
0–287 months |
0–179 months |
0–205 months |
2–196 months |
Response to neoadjuvant treatment |
180/267 (67.4%) |
19/23 (83%) |
66/73 (90.4%) |
21/24 (87.5%) |
good (< 10% viable tumor) |
102 |
14 |
35 |
10 |
poor (≥ 10% viable tumor) |
78 |
5 |
31 |
11 |
Metastases |
267/267 (100%) |
23/23 (100%) |
65/73 (89%) |
19/24 (79.2%) |
yes |
101 |
9 |
39 |
10 |
no |
166 |
14 |
26 |
9 |
Survival |
259/267 (97%) |
23/23 (100%) |
72/73 (98.6%) |
24/24 (100%) |
alive |
174 |
18 |
55 |
16 |
deceased |
85 |
5 |
17 |
8 |
TP53 immunhisto-chemistry |
212/267 (79.4%) |
19/23 (83%) |
||
negative |
170 |
15 |
||
positive |
42 |
4 |
||
Location |
23/23 (100%) |
24/24 (100%) |
||
femur |
14 |
12 |
||
tibia |
5 |
8 |
||
jaws |
2 |
- |
||
humerus |
1 |
1 |
||
fibula |
1 |
1 |
||
other |
- |
2 |
||
OS TMA series / OS Fresh Frozen series: number of evaluable cases / total number of cases (percentage) CN, copy number
To further validate our findings by another platform, we analyzed an independent set of 73 pre-therapeutic fresh-frozen OS samples for copy number alterations (CNAs) using CytoScan® high density arrays. We found that 74% (54 out of 73) of the OS samples had alterations affecting the TP53 gene. Amongst these alterations, 23 showed transition points into copy number losses (n = 17) or gains (n = 3) or abrupt transitions from losses into gains (n = 3) in intron 1 of the gene (32% of total samples, 23 out of 73, Figure 2C). Again, the rearrangements did not correlate with any clinico-pathological parameters.
TP53 intron 1 rearrangement in a family with LFS
Since mutations of TP53 are associated with LFS it seemed possible that TP53 intron 1 rearrangements could constitute a previously underappreciated category of alterations that can cause LFS. We revisited an LFS family with 12 affected members with cancer across four generations in which we previously had been unable to identify a coding TP53 mutation or a co-segregating, potentially damaging and disease-causing alteration based on exome sequencing of patients P1, P2 and P13 (Figure 3A and data not shown). Copy number analysis of DNA from blood of patients P1 and P13 by single nucleotide polymorphism (SNP) array revealed evidence for an approximately 2.5 kb deletion in intron 1 of TP53 including exon 1 (Supplementary Figure S13 and Table S12). However, we were not able to amplify the fusion point of a deletion by PCR. We then used a custom sequence capture assay for targeted paired-end sequencing of the TP53 locus to search for a rearrangement point. We identified a 445 kb inversion spanning from the breakpoint cluster region in intron 1 of TP53 towards the centromere (upstream of TP53) with a loss of 2,275 bp of intron 1/exon 1 of TP53 (Figure 4A and 4B). The lost sequence was in agreement with the deletion identified by SNP arrays. In the adult family members tested, we found this specific rearrangement co-segregating with the disease, implicating the rearrangement as the causative alteration (Figure 3B and 3C).
Twelve different protein isoforms of TP53 (p53, p53β, −γ, Δ40p53α, −β, −γ, Δ133p53α, −β, −γ, Δ160p53α, −β, −γ) can be generated by alternative splicing, alternative promoter usage, and alternative initiation sites of translation which have different functional properties (reviewed in [19, 20]). A weak promoter is located just upstream of exon 1, a strong promoter 1 kb downstream of exon 1 and a third promoter at exon 5 [19, 21]. Transcripts for p53 (full length) and the Δ40p53 isoforms contain the non-coding exon 1. The intron 1 rearrangements disconnect the exon 1 of TP53 and the two first promoters from the remaining gene body. To investigate the impact of TP53 rearrangements on TP53 expression, we obtained RNA from blood of LFS patients H2 and P13, OS lung metastasis of H2 and a cell line derived from the lung adenocarcinoma of P13.
We performed quantitative reverse transcription polymerase chain reactions (qRT-PCRs) targeting transcripts encoding for the twelve described p53 isoforms and for isoforms Δ133α, −β, −γ and Δ160α, −β, −γ (TP53 delta), respectively, and found a reduction of transcripts by 23–53% for the blood of H2 and P13 where the rearrangement was in a heterozygous state, and a reduction by 89–100% for the OS lung metastasis of H2 and a cell line derived from the lung adenocarcinoma of P13 (Figure 5). This implies that the rearrangements result in a loss of TP53 transcription and function rather than a switch to reported transcripts lacking exon 1.
To test for deletions of the second allele in tumors, copy number analysis using OncoScan FFPE Express (Affymetrix, Inc.) were performed on tumor samples of H2 (two OS lung metastases that developed six months apart), P1 (undifferentiated pleomorphic sarcoma) and P13 (lung adenocarcinoma and meningioma). Loss of heterozygosity (LOH) at the TP53 locus occurred in all five investigated tumors (Figure 6A and Supplementary Figures S14 and S15). Semi quantitative genomic PCR for LFS-BP2 showed a stronger signal for the LFS breakpoint than for the non-rearranged allele suggesting a duplication of the rearranged allele and loss of the non-rearranged allele with the weak PCR signal derived from stroma contamination (Figure 6B). Our findings suggest LOH as a frequent mechanism for TP53 inactivation after an initial intron 1 rearrangement.
DISCUSSION
Rearrangement hotspot in TP53 intron 1
More than 20 years ago, rearrangements in TP53 in OS were identified by Southern blot [7–9]. Although based on a small number of samples, these rearrangements were thought to be specific for OS. Recently, TP53 rearrangements have been rediscovered in OS in more than 50% of 32 OS by whole-genome sequencing at a higher resolution [10]. In our study, we also found TP53 intron 1 rearrangements to be the most recurrent focal rearrangement point in four OS samples. We found evidence for TP53 rearrangements in 11% (23 out of 215) of OS samples by FISH and copy number changes in intron 1 of TP53 in 32% (23 out of 73) of OS samples by CytoScan arrays. Importantly, there were no rearrangements found in other bone-forming tumors (0 out of 124) by FISH analysis. Due to the low resolution of the bacterial artificial chromosome (BAC) probes of the FISH experiments which were 169 kb and 159 kb in size, respectively, the 23 detected rearrangements might include translocations outside intron 1 of TP53. However, we did not observe other rearrangements which could result in the ‘break-apart’ FISH signal in the whole-genome DNA-PET data of the four sequenced OS samples. Similarly, Chen et al. also found the majority of breaks in intron 1 [10], suggesting that most of the rearrangements detected by FISH were due to intron 1 rearrangements. In addition, the FISH analysis did not have the resolution to identify small insertions as discovered in tumor PZP or deletions of similar sizes, thus the actual frequency of TP53 intron 1 rearrangements might be underestimated. Further, we found TP53 intron 1 rearrangements in OS by CytoScan analysis which has the resolution to locate the breakpoints to the first intron of TP53. The different frequencies of identified TP53 rearrangements by FISH and CytoScan arrays might be explained by the lack of sensitivity of the FISH assay for the identification of small rearrangements. The differences of TP53 intron 1 rearrangement frequencies between our study and the report of Chen and colleagues may be due to different analysis protocols or sampling biases.
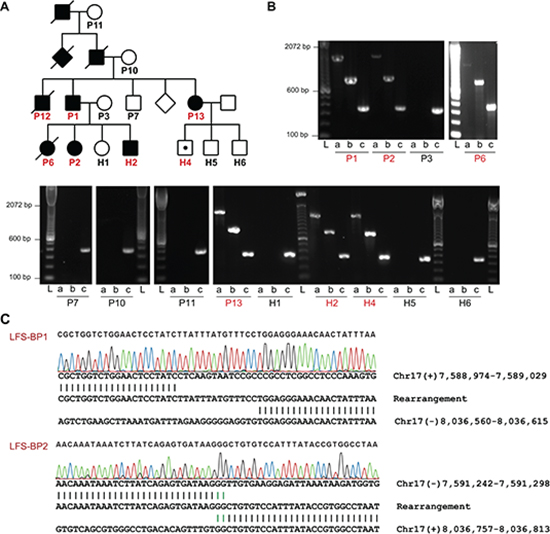
Figure 3: TP53 intron 1 rearrangement in a family with LFS. (A) Pedigree of a family with LFS. Squares and circles represent males and females, respectively. Filled symbols indicate individuals with early onset cancer. Symbols with a diagonal line indicate that the individual was deceased at the time of recruitment. Diamonds represent several additional family members whose gender should not be disclosed. Individuals of whom DNA samples have been obtained are numbered with individuals tested positive for TP53 exon 1 deletion by MLPA in red. TP53 rearrangement carrier without cancer at the age of 10 years is indicated by a white symbol with a black dot. (B) PCR analysis of positive control and TP53 intron 1 rearrangement points (LFS-BP1 and LFS-BP2) of family members of whom high quality DNA was available. DNA quality of P12 did not allow PCR amplification, including positive control (not shown). a, LFS breakpoint 1 (BP1); b, LFS breakpoint 2 (BP2); c, positive control amplicon at the RNA polymerase II locus (POLR2A); sample IDs correspond to A with affected individuals in red. L, ladder. (C) Sanger sequencing of rearrangement points LFS-BP1 and LFS-BP2 at the TP53 locus of P2. Micro homologies between the two participating break point regions are illustrated by green vertical lines. Genomic coordinates are based on NCBI build 37.
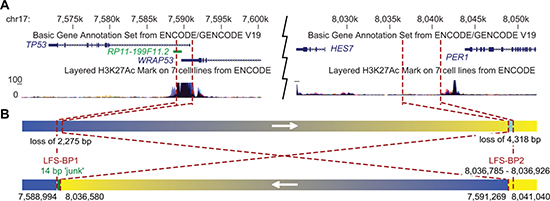
Figure 4: Inversion of 445 kb affecting intron 1 of TP53 in a family with LFS. (A) University of California, Santa Cruz (UCSC) genome browser view [43] of the TP53 locus with representative TP53 and WRAP53 transcripts, and H3K27Ac binding information of the ENCODE project [44]. Breakpoint locations are indicated by red dashed lines. (B) Schematic view of a 445 kb inversion affecting TP53 in LFS family. The telomeric rearrangement points of the inversion are located in the breakpoint cluster region in intron 1 of TP53. Arrows indicate genomic orientations pointing towards higher coordinates. Blue, TP53 locus; yellow, HES7/PER1 locus; chromosome 17 coordinates of breakpoints are indicated below.
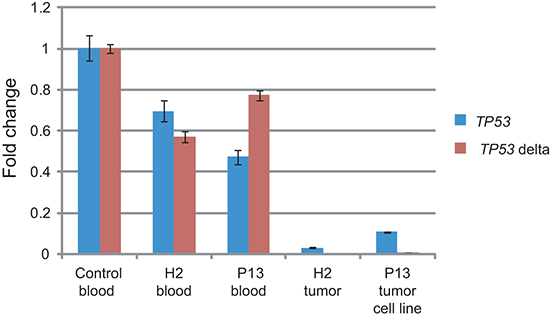
Figure 5: Tumors of LFS family show impaired TP53 transcription. RNA was extracted from blood from one unrelated control individual, TP53 intron 1 rearrangement carriers of the LFS family H2 and P13, OS lung metastasis of H2 and a lung adenocarcinoma derived cell line of P13. qRT-PCRs targeting all twelve TP53 isoforms (TP53) and short transcripts encoding for the N-terminus lacking isoforms Δ133p53 and Δ160p53 (TP53 delta) were performed in triplicates. Quantification cycle values (Cq) were normalized to GAPDH expression and are shown as fold change relative to control (y-axis). Error bars represent standard deviations. One representative of two experiments.
TP53 intron 1 rearrangement mechanism
Three main types of mechanisms for genome rearrangements have been established: homologous recombination, replication-based mechanisms, and non-replicative non-homologous repair [22, 23]. The TP53 intron 1 locus does not show significant sequence similarity with the seven translocation partner sites, arguing against a homology driven rearrangement mechanism. A replication coupled mechanism seems to be unlikely as well since a) it would require two replication fork invasions occurring in parallel at the same locus, b) it would involve two non-homologous chromosomes and replication-based mechanisms such as fork stalling and template switching (FoSTeS), which to the best of our knowledge have been described only for intra-chromosomal rearrangements, and c) we did not find evidence for rearrangement points which ‘switch back’ to the original TP53 chromosome 17. The rearrangement points of non-replicative non-homologous repair, with the subgroups non-homologous end joining (NHEJ) and alternative end joining, are characterized by the absence of large homology but the presence of micro-homology of a few base pairs, blunt end joining or the insertion of small stretches of ‘junk’ DNA of unknown origin.
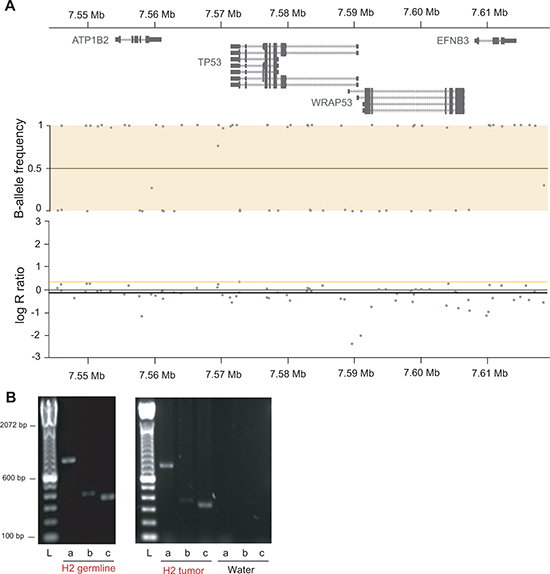
Figure 6: Tumors of LFS family show LOH at the TP53 locus. (A) OncoScan array derived copy number and allele frequency plots of the TP53 locus of OS lung metastasis of H2 show copy number neutral LOH. Chromosome 17 at 7.544 Mb to 7.618 Mb is shown with gene track (top), copy number (middle) and allele frequency (bottom). Y-axis of copy number is copy number ratio compared to reference (normal); y-axis of allele frequency shows homozygous allele calls for all single nucleotide polymorphisms in the window with values close to 0 and 1, respectively. (B) Semi quantitative PCR of LFS-BP2 (a), the wild type allele at the BP2 locus (b) and RNA polymerase II (positive control, c) of H2 germline DNA (30 PCR cycles) and H2 OS lung metastasis (28 PCR cycles) is shown. L, ladder.
The TP53 intron 1 region does not seem to be compatible with these common mechanisms of genome rearrangements or might be classified as a subcategory of NHEJ with sequence duplication. What we found in the three OS tumors with sequenced TP53 intron 1 rearrangement points is different since both sides of the balanced intron 1 rearrangements contain a stretch of identical sequence of 46 bp to 555 bp. We therefore suggest a mechanism where a double strand break with long single stranded DNA overhangs occurs (Supplementary Figure S16A to S16G). The single stranded DNA overhangs might get filled in by the DNA repair machinery allowing blunt end fusions with other double strand breaks. Remarkably, all three OS tumors in which we initially found the TP53 rearrangements share this unique feature of breakpoint sequences suggesting that they were caused by the same mechanism. The break point regions of the TP53 locus and the translocation partner sites show a pattern of general active chromatin marks and gene expression in OS and/or bone tissue. The open state of the chromatin and/or the active expression of the respective genes may lead or contribute to the formation of the TP53 intron 1 specific rearrangements.
Somatic SVs in TP53 intron 1 are specific to OS
We assayed a comprehensive tumor collection of more than ten tissue types with a total of 1,090 non-OS tumors and 215 OS and show that the mechanistic event of the somatic rearrangements in TP53 is highly specific to OS. In contrast, our findings in the LFS family indicate that TP53 intron 1 can also occur in the germline and once such a SV is present as a germline alteration it can give rise to not only OS but multiple types of cancer, including adenocarcinoma, meningioma, astrocytoma, colon cancer, basal cell and squamous cell carcinoma of the skin. Interestingly, none of these tumor types were positive in our FISH TMA assay (n = 54, n = 14, n = 11, n = 62, n = 23 and n = 10, respectively) indicating that the mechanistic occurrence of TP53 intron 1 rearrangements in the soma is specific for the osteoblast lineage, the believed cell of origin for OS [24]; however, the pro-cancer effect of such rearrangements supports tumor growth in many other tissues. Similarly, TP53−/− and TP53+/− knockout mice develop not only OS but also lymphoma, carcinoma and testicular cancer [25]. Again, our FISH analysis of tumors of these types did not show evidence for somatic TP53 intron 1 rearrangements (n = 33, n = 566, n = 33, respectively). It therefore seems plausible that the OS specificity of the TP53 intron 1 SVs is based on the mechanism of the rearrangement that leads it to occur only in osteoblast lineage with observable frequency, rather than OS being the specific consequence of the alteration. Cell lineage specific DNA replication properties or transcriptional processes might be responsible for the remarkable specificity of the described rearrangements.
Other genes at the rearrangement hotspot
It remains possible that the intron 1 rearrangements affect other genes at this locus which could result in pro-malignant effects. RP11–199F11.2 (Hp53int1 or D17S2179E) is a non-spliced, probably non-coding transcript in intron 1 of TP53 which is transcribed in the same orientation as TP53 (Figure 1B). It has been identified by a targeted cDNA library screen but its function is unknown [26]. Further, exon 1 of TP53 overlaps with WRAP53, a gene which is oriented in antisense relative to TP53, on the plus strand of chromosome 17, that has been found to upregulate TP53 transcripts. Downregulation of WRAP53 is reported to lead to significant suppression of p53 induction in response to DNA damage [27]. WRAP53 protein has been characterized as an essential protein for the localization and processing of nuclear ribonucleoproteins [28, 29].
Germline SVs in TP53 intron 1 can cause LFS
We found germline rearrangements in the TP53 intron 1 hotspot likely to be causative for LFS in a large family. Our findings are in agreement with the second hit model for tumor suppressor genes where all 23 FISH positive OS showed two break-apart signals and the LFS family had the rearrangement in a heterozygous state in the germline followed by LOH in all tumors. Our qRT-PCR experiments suggest that the overall transcription of TP53 is lost upon intron 1 rearrangement but it remains possible that in certain tissue/tumor contexts or depending on regulatory elements in the rearrangement partner sites, such rearrangements could cause a shift towards the expression of the shorter isoforms Δ133p53 and Δ160p53. In contrast to p53, Δ133p53 is defective in promoting apoptosis [21]. The comparison of TP53 transcripts in breast tumor versus normal tissues revealed obvious differences with Δ133p53 being expressed in 24 out of 30 breast tumors but not in 8 normal breast tissue samples [21]. This is supported by a clinical study which found Δ133p53 isoforms to be abnormally expressed in renal cancer, suggesting that they play a role in carcinogenesis [30]. Further, Δ133p53α inhibits p53-mediated replicative senescence, promotes cellular proliferation of normal human fibroblasts by inhibiting p21 expression, and represses the expression of miR-34a to regulate p53-mediated senescence [31]. Cotransfection experiments indicated that Δ133p53 has a dominant negative effect on the proapoptotic properties of p53 [21]. p53 forms tetramers to execute its function as a transcription factor. Coimmunoprecipitation experiments showed that Δ133p53 forms a complex with p53 and it is likely that this interaction mediates a negative effect on p53 function of the intact allele by interfering with the tetramer structure [19].
TP53 coding mutations are identified in 70% of classic LFS families [3]. Germline TP53 intron 1 rearrangements might be present in some of the remaining 30% of families, suggesting that LFS and Li-Fraumeni-like (LFL) families should be tested for such rearrangements. This could be tested using FISH and TP53 capture-based sequencing approaches for break point identification as in our study. Only a few cases have been reported where genomic structural alterations, usually deletions, cause cancer syndromes [32–39] and one study where a Robertsonian translocation results in a highly increased risk for childhood acute lymphoblastic leukemia with focal chromosome 21 amplification [40]. We present here a very rare phenomenon of a rearrangement hotspot which can give rise to both somatic rearrangements as well as a germline cancer syndrome. It seems possible that the open chromatin state together with components of the transcription machinery and characteristic LINE sequences underlie the fragility of this locus. The disruption of the gene structure results in loss of p53 function and thereby promotes cancer. In conclusion, intron 1 of TP53 represents a rare case of a tumor type dependent somatic rearrangement hotspot that can also acquire germline SVs causing a Mendelian inherited cancer syndrome.
METHODS
OS patient samples for DNA-PET sequencing
DNA of four treatment naive OS tumors and paired normal blood were obtained from the Biopathology Center (BPC) of the Children's Oncology Group (COG), a cooperative group that includes medical centers in the United States, Canada, Mexico, Australia, New Zealand and selected countries in Europe. Informed consent of the participating patients or legal representatives has been obtained and approval of the respective institutional ethics review boards has been granted.
DNA-PET libraries construction, sequencing, mapping and data analysis
DNA-PET library construction from 1 to 4 kb fragments of genomic DNA, sequencing, mapping and data analysis were performed as described in [13] with refined bioinformatics filtering as described in [41]. High throughput sequencing by 2 x 35 bp or 2 x 50 bp was performed on SOLiD sequencers (v3plus and v4, respectively) according to the manufacturer's recommendation (Life Technologies). The short reads were aligned to the NCBI human reference genome build 37 (hg19) using Bioscope (Life Technologies).
Custom sequence capture and breakpoint identification in a LFS family by paired-end sequencing
The TP53-containing region chr17:7,520,000–7,680,000 (NCBI build 37) was defined for a custom sequence capture (SeqCap EZ Choice, Roche NimbleGen Inc.). Repetitive regions are usually excluded for sequence capture assays. Since most of the observed breakpoints in OS were in LINE sequences, we forced to include repetitive sequences of the intron 1 region of TP53 (chr17:7,579,941–7,590,694). Illumina sequencing library was constructed and capturing was performed according to the manufacturer's recommendations and the library was sequenced on an Illumina HiSeq 2000 by 2x50 bases. Reads were mapped to the human reference genome (NCBI build 37) by BWA and read-pairs were filtered of which one read mapped to the TP53 target region and the paired read mapped outside of that region. Reads of similar mapping pattern were clustered together as described earlier [13] and prioritized for validation by PCR and Sanger sequencing based on cluster size (number of paired-reads with similar mapping patterns). Identified TP53 breakpoints were screened by PCR in all LFS family members of whom DNA was available. Validation PCRs were conducted using Jumpstart REDAccuTaq LA DNA Polymerase (Sigma-Aldrich) following manufacturer's instructions with 120 ng DNA template. Where sample was insufficient, the genomic DNA was amplified using REPLI-g Mini Kit (Qiagen) and 3 ul of 1:20 diluted amplification product were used as template for validation PCRs. PCRs were performed using the following primer pairs: CTCAAAAGGCC ATCAAAAGG and GTATGGTGGCCTGTTCCTGT (LFS-BP1), GGCTGCTGGGAGTTGTAGTC and AGCT ATCTTGACCCCACACG (LFS-BP2), CCCGAATA GCTGGGATTACA and GCAAGTGCAC AGGAAGATGA (LFS-BP1-wt), GGAGGAATCC TGCATTGTGT and CAGGCTTCAGACCTGTCTCC (LFS-BP2-wt), GCTGCTGGACGTGAGTATGA and AGTTCCAACAATGGCTACCG (positive control primers for POLR2A), and the following cycling conditions: 3 min at 94°C, (20 s at 94°C, 30 s at 58°C, 2 min at 68°C)x15, (20 s at 94°C, 30 s at 55°C, 2 min at 68°C)x20, 5 min at 68°C.
Tissue samples and patient's characteristics for fluorescence in situ hybridization (FISH) and CytoScan screen
All tissue samples were obtained from the archives of the Bone Tumor Reference Center at the University Hospital Basel and the Clinical Cooperation Group Osteosarcoma at the Helmholtz Zentrum Muenchen. Only specimens from patients without prior treatment were included in the study. FISH analyses were performed on nine TMAs comprising OS samples of 267 patients, samples from other bone-forming tumors or tumor-like lesions of 144 patients, and a collection of 1,163 tumors of various types and normal tissue samples. For the CytoScan HD Arrays (Affymetrix, CA, USA) genomic DNA from fresh frozen samples of 73 independent OS patients was used. Full patient's characteristics are presented in Table 1 and Supplementary Tables S8, S10 and S11.
Dual-color break-apart FISH
BAC clones RP11–1081A10 and RP11–107F4 (BACPAC, Children's Hospital Oakland Research Institute, USA) were nick-translated (Abbott Laboratories, USA) and labeled with fluorescent dUTPs (Enzo Life Sciences, USA) resulting in red labeling of RP11–1081A10 and green labeling of RP11–107F4. The in situ hybridisation was performed according to routine protocols. Tumors were considered to have a rearrangement in the 5' region of TP53 when at least 10% of cells showed clearly separated green and red hybridisation signals (= FISH positive/break-apart).
CytoScan HD arrays
Genome-wide CytoScan HD Arrays (Affymetrix, CA, USA) were performed according to the manufacturer's instructions using 250 ng of genomic DNA from each tumor sample. To evaluate copy number variations (CNV), data was processed using the Nexus Copy Number software (Version 7.0, BioDiscovery, CA, USA) with integrated algorithms for segmentation and normalization.
Clinical characteristics of a four-generation LFS family
All members of the LFS family who contributed samples to this study or legal representatives gave informed consent and are indicated with numbers in Figure 3A. The study was approved by the respective ethical review boards. P1 was diagnosed with colon cancer at age of 22 years, an oligodendroglioma at 34 years, and an undifferentiated pleomorphic sarcoma at 40 years, and basal cell carcinoma and squamous cell carcinoma of the skin, P2 a phyllodes tumor of the breast at 12 years, P6 a rhabdomyosarcoma at 33 months, P12 an OS at 19 years, H2 an OS at 13 years, P13 bilateral ductal carcinoma in situ at 32 and 33 years, meningioma at 38 years, and adenocarcinoma of the lung at 40 years. Family members P1, P7, P13, P12, H1, H2, H4, H5 and H6 were analyzed by multiplex ligation-dependent probe amplification (MLPA) (MRC-Holland) according to the manufacturer's recommendation to test for deletions in TP53 with 2 probe sets in exon 1, and one probe set each in exons 2 – 9, 11, and 12. Both probe sets for exon 1 with probe pair TGTAGCTGCTGGGCTCCGGGGACACT and TTGCGTTCGGGCTGGGAGCGTGCTTTCCACGA (exon 1) and CCATTTCCTTTGCTTCCTCCGGCA and GGCGGATTACTTGCCCTTACTTGTCATGGCGACTGT CCAG (5' of exon 1) indicated a heterozygous deletion of exon 1 for P1, P13, P12, H2 and H4 but not for P7, H1, H5 and H6. The presence of the deletion co-segregated with affection status except for H4 who was tested positive but had no cancer at the age of 10 years (of note, H4 is being followed with repeat imaging due to suspicious lesion in the brain that could represent the development of an early tumor).
qRT-PCR of TP53 in samples of LFS family
RNA was isolated from PAXgene Blood RNA Tubes using the PAXgene Blood miRNA kit (Qiagen). RNA from fresh frozen tumor, H2, and RNA from a tumor derived cell line, P13, were isolated using RNAeasy Mini kit (Qiagen). The one step qRT-PCR was carried out using QuantiTect Probe RT-PCR kit (Qiagen), with a total of 50 ng RNA per PCR. The TaqMan primer/probe set (LifeTechnologies) was used for TP53 full length (HS01034249) and the PrimeTime primer/probe set (Integrated DNA Technologies Inc.) for transcripts encoding for Δ133p53 and Δ160p53 were designed using sequences from Marcel and colleagues [42]. qRT-PCRs were performed on a Bio-Rad CFX device. Cq values were normalized against GAPDH as ΔCq and displayed relative to normal blood control as ΔΔCq as fold-change (2−ΔΔCq).
OncoScan FFPE Express (Molecular Inversion Probe) array
Samples were processed using the Affymetrix OncoScan FFPE Express kit according to the manufacturer's instructions using 80 ng of genomic DNA from each tumor sample. To evaluate copy number variations (CNV) data was processed using the Nexus Copy Number software (Version 7.5, BioDiscovery).
Sequencing data
Sequences have been submitted to the Short Read Archive (http://trace.ncbi.nlm.nih.gov/Traces/sra/) at the National Center for Biotechnology Information (NCBI) with the study reference number PRJNA244486. LFS array data can be accessed at Gene Expression Omnibus (http://www.ncbi.nlm.nih.gov/geo/) with the study ID GSE64293.
ACKNOWLEDGEMENTS
We are grateful for all patients who contributed tissue samples to this study. We thank Ioana Cutcutache and Steve Rozen for bioinformatics analysis of LFS family data, Kyle D. Proffitt for help on tissue culture and molecular biology work, Joanne Hui Ping Lim for help on FISH probe labeling, Dawn Poh Sum Choi, See Ting Leong, and Say Chuan Neo for SOLiD sequencing, Jo Chin Thing Ong, Ming Lai Ivan Chua, and Yen Ling Lee for Illumina sequencing, and Joanna Hui Juan Tan, Chee Seng Chan, Pramila N. Ariyaratne, Pauline Jieqi Chen, Justin Jeyakani for bioinformatics assistance.
FINANCIAL SUPPORT
This work was supported by the Agency for Science Technology and Research (A*STAR). DMV is supported by the Singapore Translational Research Investigator Award of the National Medical Research Council. SR is supported by the A*STAR Research Attachment Programme. DB and GJ are supported by the Foundation for the Preservation of the Basel Bone Tumor Reference Center. KL is supported by the Soccer for Hope Foundation. JS and MN are members of the Translational Sarcoma Research Network supported by the Bundesministerium für Bildung und Forschung (FKZ01GM0870). JDS is supported by the Edward B. Clark, MD Chair in Pediatric Research and the Primary Children's Hospital (PCH) Pediatric Cancer Program. LFS experiments supported by funds in conjunction with Soccer for Hope Foundation and grant P30 CA042014 awarded to Huntsman Cancer Institute.
CONFLICT OF INTEREST
All authors declare that they have no conflict of interest
REFERENCES
1. Malkin D. Li-Fraumeni syndrome. In: Fletcher C, Bridge J, Hogendoorn P and Mertens F, eds. WHO Classification of Tumours of Tumours of Soft Tissue and Bone. (Lyon, France: IARC Press), 2013; pp. 379–381.
2. McBride KA, Ballinger ML, Killick E, Kirk J, Tattersall MH, Eeles RA, Thomas DM, Mitchell G. Li-Fraumeni syndrome: cancer risk assessment and clinical management. Nat Rev Clin Oncol. 2014; 11:260–271.
3. Varley JM, McGown G, Thorncroft M, Santibanez-Koref MF, Kelsey AM, Tricker KJ, Evans DG, Birch JM. Germ-line mutations of TP53 in Li-Fraumeni families: an extended study of 39 families. Cancer Res. 1997; 57:3245–3252.
4. Petitjean A, Achatz MI, Borresen-Dale AL, Hainaut P, Olivier M. TP53 mutations in human cancers: functional selection and impact on cancer prognosis and outcomes. Oncogene. 2007; 26:2157–2165.
5. Shlien A, Baskin B, Achatz MI, Stavropoulos DJ, Nichols KE, Hudgins L, Morel CF, Adam MP, Zhukova N, Rotin L, Novokmet A, Druker H, Shago M, Ray PN, Hainaut P, Malkin D. A common molecular mechanism underlies two phenotypically distinct 17p13.1 microdeletion syndromes. Am J Hum Genet. 2010; 87:631–642.
6. Bougeard G, Brugieres L, Chompret A, Gesta P, Charbonnier F, Valent A, Martin C, Raux G, Feunteun J, Bressac-de Paillerets B, Frebourg T. Screening for TP53 rearrangements in families with the Li-Fraumeni syndrome reveals a complete deletion of the TP53 gene. Oncogene. 2003; 22:840–846.
7. Masuda H, Miller C, Koeffler HP, Battifora H, Cline MJ. Rearrangement of the p53 gene in human osteogenic sarcomas. Proc Natl Acad Sci U S A. 1987; 84:7716–7719.
8. Miller CW, Aslo A, Tsay C, Slamon D, Ishizaki K, Toguchida J, Yamamuro T, Lampkin B, Koeffler HP. Frequency and structure of p53 rearrangements in human osteosarcoma. Cancer Res. 1990; 50:7950–7954.
9. Chandar N, Billig B, McMaster J, Novak J. Inactivation of p53 gene in human and murine osteosarcoma cells. Br J Cancer. 1992; 65:208–214.
10. Chen X, Bahrami A, Pappo A, Easton J, Dalton J, Hedlund E, Ellison D, Shurtleff S, Wu G, Wei L, Parker M, Rusch M, Nagahawatte P, Wu J, Mao S, Boggs K, et al. Recurrent Somatic Structural Variations Contribute to Tumorigenesis in Pediatric Osteosarcoma. Cell Rep. 2014; 7:104–112.
11. Kuerbitz SJ, Plunkett BS, Walsh WV, Kastan MB. Wild-type p53 is a cell cycle checkpoint determinant following irradiation. Proc Natl Acad Sci U S A. 1992; 89:7491–7495.
12. Hanel W, Moll UM. Links between mutant p53 and genomic instability. Journal of cellular biochemistry. 2012; 113:433–439.
13. Hillmer AM, Yao F, Inaki K, Lee WH, Ariyaratne PN, Teo AS, Woo XY, Zhang Z, Zhao H, Ukil L, Chen JP, Zhu F, So JB, Salto-Tellez M, Poh WT, Zawack KF, et al. Comprehensive long-span paired-end-tag mapping reveals characteristic patterns of structural variations in epithelial cancer genomes. Genome Res. 2011; 21:665–675.
14. Ng KP, Hillmer AM, Chuah CT, Juan WC, Ko TK, Teo AS, Ariyaratne PN, Takahashi N, Sawada K, Fei Y, Soh S, Lee WH, Huang JW, Allen JC Jr., Woo XY, Nagarajan N, et al. A common BIM deletion polymorphism mediates intrinsic resistance and inferior responses to tyrosine kinase inhibitors in cancer. Nat Med. 2012; 18:521–528.
15. Yao F, Ariyaratne PN, Hillmer AM, Lee WH, Li G, Teo AS, Woo XY, Zhang Z, Chen JP, Poh WT, Zawack KF, Chan CS, Leong ST, Neo SC, Choi PS, Gao S, et al. Long span DNA paired-end-tag (DNA-PET) sequencing strategy for the interrogation of genomic structural mutations and fusion-point-guided reconstruction of amplicons. PLoS One. 2012; 7:e46152.
16. Djebali S, Davis CA, Merkel A, Dobin A, Lassmann T, Mortazavi A, Tanzer A, Lagarde J, Lin W, Schlesinger F, Xue C, Marinov GK, Khatun J, Williams BA, Zaleski C, Rozowsky J, et al. Landscape of transcription in human cells. Nature. 2012; 489:101–108.
17. Hessle L, Johnson KA, Anderson HC, Narisawa S, Sali A, Goding JW, Terkeltaub R, Millan JL. Tissue-nonspecific alkaline phosphatase and plasma cell membrane glycoprotein-1 are central antagonistic regulators of bone mineralization. Proc Natl Acad Sci U S A. 2002; 99:9445–9449.
18. Sohaskey ML, Jiang Y, Zhao JJ, Mohr A, Roemer F, Harland RM. Osteopotentia regulates osteoblast maturation, bone formation, and skeletal integrity in mice. J Cell Biol. 2010; 189:511–525.
19. Khoury MP, Bourdon JC. The isoforms of the p53 protein. Cold Spring Harb Perspect Biol. 2010; 2:a000927.
20. Khoury MP, Bourdon JC. p53 Isoforms: An Intracellular Microprocessor? Genes Cancer. 2011; 2:453–465.
21. Bourdon JC, Fernandes K, Murray-Zmijewski F, Liu G, Diot A, Xirodimas DP, Saville MK, Lane DP. p53 isoforms can regulate p53 transcriptional activity. Genes Dev. 2005; 19:2122–2137.
22. Gu W, Zhang F, Lupski JR. Mechanisms for human genomic rearrangements. Pathogenetics. 2008; 1:4.
23. Hastings PJ, Lupski JR, Rosenberg SM, Ira G. Mechanisms of change in gene copy number. Nat Rev Genet. 2009; 10:551–564.
24. Mutsaers AJ, Walkley CR. Cells of origin in osteosarcoma: mesenchymal stem cells or osteoblast committed cells? Bone. 2014; 62:56–63.
25. Blackburn AC, Jerry DJ. Knockout and transgenic mice of Trp53: what have we learned about p53 in breast cancer? Breast Cancer Res. 2002; 4:101–111.
26. Reisman D, Balint e, Loging WT, Rotter V, Almon E.. A novel transcript encoded within the 10-kb first intron of the human p53 tumor suppressor gene (D17S2179E) is induced during differentiation of myeloid leukemia cells. Genomics. 1996; 38:364–370.
27. Mahmoudi S, Henriksson S, Corcoran M, Mendez-Vidal C, Wiman KG, Farnebo M. Wrap53, a natural p53 antisense transcript required for p53 induction upon DNA damage. Mol Cell. 2009; 33:462–471.
28. Tycowski KT, Shu MD, Kukoyi A, Steitz JA. A conserved WD40 protein binds the Cajal body localization signal of scaRNP particles. Mol Cell. 2009; 34:47–57.
29. Venteicher AS, Abreu EB, Meng Z, McCann KE, Terns RM, Veenstra TD, Terns MP, Artandi SE. A human telomerase holoenzyme protein required for Cajal body localization and telomere synthesis. Science. 2009; 323:644–648.
30. Song W, Huo SW, Lu JJ, Liu Z, Fang XL, Jin XB, Yuan MZ. Expression of p53 isoforms in renal cell carcinoma. Chin Med J (Engl). 2009; 122:921–926.
31. Fujita K, Mondal AM, Horikawa I, Nguyen GH, Kumamoto K, Sohn JJ, Bowman ED, Mathe EA, Schetter AJ, Pine SR, Ji H, Vojtesek B, Bourdon JC, Lane DP, Harris CC. p53 isoforms Delta133p53 and p53beta are endogenous regulators of replicative cellular senescence. Nat Cell Biol. 2009; 11:1135–1142.
32. Andersson U, Wibom C, Cederquist K, Aradottir S, Borg A, Armstrong GN, Shete S, Lau CC, Bainbridge MN, Claus EB, Barnholtz-Sloan J, Lai R, Il'yasova D, Houlston RS, Schildkraut J, Bernstein JL, et al. Germline rearrangements in families with strong family history of glioma and malignant melanoma, colon, and breast cancer. Neuro Oncol. 2014; 16:1333–1340.
33. Gylling A, Ridanpaa M, Vierimaa O, Aittomaki K, Avela K, Kaariainen H, Laivuori H, Poyhonen M, Sallinen SL, Wallgren-Pettersson C, Jarvinen HJ, Mecklin JP, Peltomaki P. Large genomic rearrangements and germline epimutations in Lynch syndrome. Int J Cancer. 2009; 124:2333–2340.
34. Judkins T, Rosenthal E, Arnell C, Burbidge LA, Geary W, Barrus T, Schoenberger J, Trost J, Wenstrup RJ, Roa BB. Clinical significance of large rearrangements in BRCA1 and BRCA2. Cancer. 2012; 118:5210–5216.
35. Lee MP, Hu RJ, Johnson LA, Feinberg AP. Human KVLQT1 gene shows tissue-specific imprinting and encompasses Beckwith-Wiedemann syndrome chromosomal rearrangements. Nat Genet. 1997; 15:181–185.
36. Plaschke J, Ruschoff J, Schackert HK. Genomic rearrangements of hMSH6 contribute to the genetic predisposition in suspected hereditary non-polyposis colorectal cancer syndrome. J Med Genet. 2003; 40:597–600.
37. Duraturo F, Cavallo A, Liccardo R, Cudia B, De Rosa M, Diana G, Izzo P. Contribution of large genomic rearrangements in Italian Lynch syndrome patients: characterization of a novel alu-mediated deletion. Biomed Res Int. 2013; 2013:219897.
38. Tutlewska K, Lubinski J, Kurzawski G. Germline deletions in the EPCAM gene as a cause of Lynch syndrome - literature review. Hered Cancer Clin Pract. 2013; 11:9.
39. Andersson U, Wibom C, Cederquist K, Aradottir S, Borg Å, Armstrong GN, Shete S, Lau CC, Bainbridge MN, Claus EB, Barnholtz-Sloan J, Lai R, Il'yasova D, Houlston RS, Schildkraut J, Bernstein JL, et al. Germline rearrangements in families with strong family history of glioma and malignant melanoma, colon, and breast cancer. Neuro-Oncology. 2014; 16:1333–1340.
40. Li Y, Schwab C, Ryan SL, Papaemmanuil E, Robinson HM, Jacobs P, Moorman AV, Dyer S, Borrow J, Griffiths M, Heerema NA, Carroll AJ, Talley P, Bown N, Telford N, Ross FM, et al. Constitutional and somatic rearrangement of chromosome 21 in acute lymphoblastic leukaemia. Nature. 2014; 508:98–102.
41. Nagarajan N, Bertrand D, Hillmer AM, Zang ZJ, Yao F, Jacques PE, Teo AS, Cutcutache I, Zhang Z, Lee WH, Sia YY, Gao S, Ariyaratne PN, Ho A, Woo XY, Veeravali L, et al. Whole-genome reconstruction and mutational signatures in gastric cancer. Genome Biol. 2012; 13:R115.
42. Marcel V, Perrier S, Aoubala M, Ageorges S, Groves MJ, Diot A, Fernandes K, Tauro S, Bourdon JC. Delta160p53 is a novel N-terminal p53 isoform encoded by Delta133p53 transcript. FEBS Lett. 2010; 584:4463–4468.
43. Rhead B, Karolchik D, Kuhn RM, Hinrichs AS, Zweig AS, Fujita PA, Diekhans M, Smith KE, Rosenbloom KR, Raney BJ, Pohl A, Pheasant M, Meyer LR, Learned K, Hsu F, Hillman-Jackson J, et al. The UCSC Genome Browser database: update. Nucleic Acids Res. 2010; 38:D613–619.
44. Bernstein BE, Birney E, Dunham I, Green ED, Gunter C, Snyder M. An integrated encyclopedia of DNA elements in the human genome. Nature. 2012; 489:57–74.