
Introduction
Breast cancer is the second most common cancer globally in terms of incidence, comprising 11.6% of all new cancers and is the 5th leading cause of mortality attributed to 6.6% of all cancer deaths [1]. For patients with locally advanced breast cancer (LABC), pre-operative or neoadjuvant systemic therapies with chemotherapy with or without targeted agents constitute standard treatment protocols [2–4]. The rationale of using NAC is to downsize the primary tumor improving resectability, and also the assessment of response to therapies that serve as a reliable prognostic marker of outcomes. Imaging modalities like ultrasonography (USG), mammography (MMG), magnetic resonance imaging (MRI), and computed tomography (CT) are commonly used in response monitoring of NAC, which primarily considers long-term size related changes of the disease [5, 6]. Also, functional or metabolic imaging in the form of positron emission tomography (PET) is recognized in evaluating treatment response.
Radiomics is an emerging field in medicine and oncology, which has been made possible through advanced computer-based image analysis, often combined with machine learning algorithms for data interpretation [7–9]. Radiomics has made it possible to extract biological characteristics in a non-invasive manner, which can help in predicting the natural history of the disease as well as in detecting early changes associated with treatment. Quantitative ultrasound (QUS) is a non-invasive, easily accessible, and relatively inexpensive imaging modality that can lead to useful insights into the tissue microstructure [10]. Radiofrequency (RF) data from QUS provides valuable information compared to conventional B-mode ultrasound imaging, where there is a loss of crucial details involved with instrument-based signal processing. The analysis of the power spectra from ultrasound RF data can be used to determine quantitative parameters, which include average scatterer diameter (ASD), average acoustic concentration (AAC), mid-band fit (MBF), spectral slope (SS), spectral 0-MHz intercept (SI). These reveal useful information about elastic properties in tissue at the microscopic level, with each parameter having distinct biological implications [11]. Also, QUS features are capable of detecting temporal events at the cellular level following various treatments, including cell death [12, 13]. The spatial distribution of features within QUS parametric images can be further studied using grey-level co-occurrence matrix (GLCM) analyses, which represent the angular relationship and distance between neighboring pixels. The GLCM method can be used to extract various QUS-texture (QUS-Tex1) features like contrast (CON), energy (ENE), correlation (COR), and homogeneity (HOM). Earlier studies have evaluated baseline QUS parameters and texture analysis extracted from the tumor to predict the response to systemic therapies [14, 15].
In the study here, higher-order imaging features in the form of QUS texture-derivatives (QUS-Tex1-Tex2) have been determined from pretreatment QUS data for patients with LABC undergoing NAC to predict treatment response. To the best of our knowledge, this is the first study to demonstrate the effectiveness of texture derivatives applied to any form of imaging data, leading to the improvement of classifier performances.
Results
Patient, tumor and treatment characteristics
Patient and treatment-related features are summarized in Table 1. According to the clinical and pathological criteria, 83 and 17 patients were classified as responders and non-responders to NAC, respectively. The most common chemotherapy regimen used was AC-T (Adriamycin, Cyclophosphamide, and Paclitaxel) in 59%, followed by FEC-D (5-Fluorouracil, Epirubicin, Cyclophosphamide, and Docetaxel) in 29%. Along with neoadjuvant chemotherapy, 31% of patients received trastuzumab in the neoadjuvant setting. None of the patients received any endocrine therapy before surgery. All of the patients included in this analysis had completed systemic therapy as planned. Pathological complete response (pCR) was seen in 23 patients (23%). Following surgery adjuvant therapies with radiation, maintenance Trastuzumab for human epidermal growth factor receptor 2 (HER2) positive tumors or endocrine therapy (for hormonal receptor-positive) was continued as per standard institutional practice. Details on individual patient basis have been mentioned in Supplementary Table 1. The 5-year recurrence-free survival (RFS) for the responders and non-responders was 84% and 62%, respectively, with a p-value of 0.04 (Supplementary Figure 1).
Table 1: Patient, disease and treatment related characteristics in the two groups (responders and non-responders)
| Characteristics | Responders (n = 83) | Non-responders (n = 17) | Total (n = 100) | p-value |
|---|---|---|---|---|
| Age | ||||
| Median (range) | 50 (31–84) years | 42 (29–66) years | 49 (29–84) years | 0.25 |
| Menopausal status | ||||
| Premenopausal | 46 (55%) | 11 (65%) | 57 (57%) | |
| Postmenopausal | 29 (35%) | 5 (30%) | 34 (34%) | 0.85 |
| Perimenopausal | 5 (6%) | 0 (0%) | 5 (5%) | |
| Unknown | 3 (4%) | 1 (5%) | 4 (4%) | |
| Tumour size (baseline) | ||||
| Median (range) | 5.3 (1.6–12) cm | 5.3 (2.5–12.8) cm | 5.3 (1.6–12.8) cm | 0.62 |
| Histology | ||||
| IDC | 76 (92%) | 14 (82%) | 90 (90%) | |
| ILC | 4 (5%) | 1 (6%) | 5 (5%) | 0.36 |
| Others | 3 (3%) | 2 (12%) | 5 (5%) | |
| Tumour stage | ||||
| T1 | 0 (0%) | 0 (0%) | 0 (0%) | |
| T2 | 34 (41%) | 8 (47%) | 42 (42%) | 0.89 |
| T3 | 39 (47%) | 7 (41%) | 46 (46%) | |
| T4 | 10 (12%) | 2 (12%) | 12 (12%) | |
| Nodal stage | ||||
| N0 | 21 (25%) | 5 (29%) | 26 (26%) | |
| N1 | 51 (61%) | 8 (47%) | 59 (59%) | 0.14 |
| N2 | 8 (10%) | 1 (6%) | 9 (9%) | |
| N3 | 3 (4%) | 3 (18%) | 6 (6%) | |
| Hormonal status | ||||
| Positive | 51 (61%) | 12 (71%) | 63 (63%) | 0.48 |
| Negative | 32 (39%) | 5 (29%) | 37 (37%) | |
| HER2 status | ||||
| Positive | 28 (34%) | 3 (18%) | 31 (31%) | 0.19 |
| Negative | 55 (66%) | 14 (82%) | 69 (69%) | |
| Systemic therapy | ||||
| AC-T | 51 (61%) | 8 (47%) | 59 (59%) | |
| FEC-D | 22 (27%) | 7 (41%) | 29 (29%) | 0.46 |
| Others | 10 (12%) | 2 (12%) | 12 (12%) | |
| Trastuzumab | ||||
| Yes | 28 (34%) | 3 (18%) | 31 (31%) | 0.19 |
| No | 55 (66%) | 14 (82%) | 69 (69%) | |
| Surgery | ||||
| Mastectomy | 64 (77%) | 15 (88%) | 79 (79%) | |
| Breast-conserving surgery | 19 (23%) | 1 (6%) | 20 (20%) | 0.13 |
| No surgery | 0 (0%) | 1 (6%) | 1 (1%) | |
| Tumour size (post-NAC) | ||||
| Median (range) | 1.4 (0–8.4) cm | 5 (2.4–19.0) cm | 1.8 (0–19.0) cm | < 0.01 |
Quantitative ultrasound and texture parameters
Representative ultrasound B-mode images, MBF parametric images and MBF-CON, MBF-ENE, MBF-COR, and MBF-HOM texture images corresponding to three responding and three non-responding patients are displayed in Figure 1. None of the parameters demonstrated significant differences in terms of distribution between the two groups. The classification performances using the different algorithms have been summarized in Table 2. The accuracies from QUS and QUS-Tex1 features using Fisher’s linear discriminant (FLD), k-nearest neighbors (KNN), and radial-basis-function support vector machine (SVM) classifiers were 62%, 69%, and 69%, respectively. Selecting from 105 features inclusive of the texture derivatives, accuracy improved to 67%, 82%, and 69% for FLD, KNN, and SVM, respectively. Amongst all the models, KNN classification resulted in the best performances. The sensitivity, specificity, accuracy, and area under curve (AUC) for the best classifier was 87%, 81%, 82%, and 0.86, respectively. The comparison of the performance using QUS+QUS-Tex1 and QUS-Tex1-Tex2 is shown in Figure 2A and 2B, respectively. The Receiver operating characteristics (ROC) curves (Figure 3) indicate the improvement in AUC values for the KNN model (0.86 vs. 0.74), whereas it remained relatively stable for FLD (0.61 vs. 0.60) and SVM (0.79 both) methods.
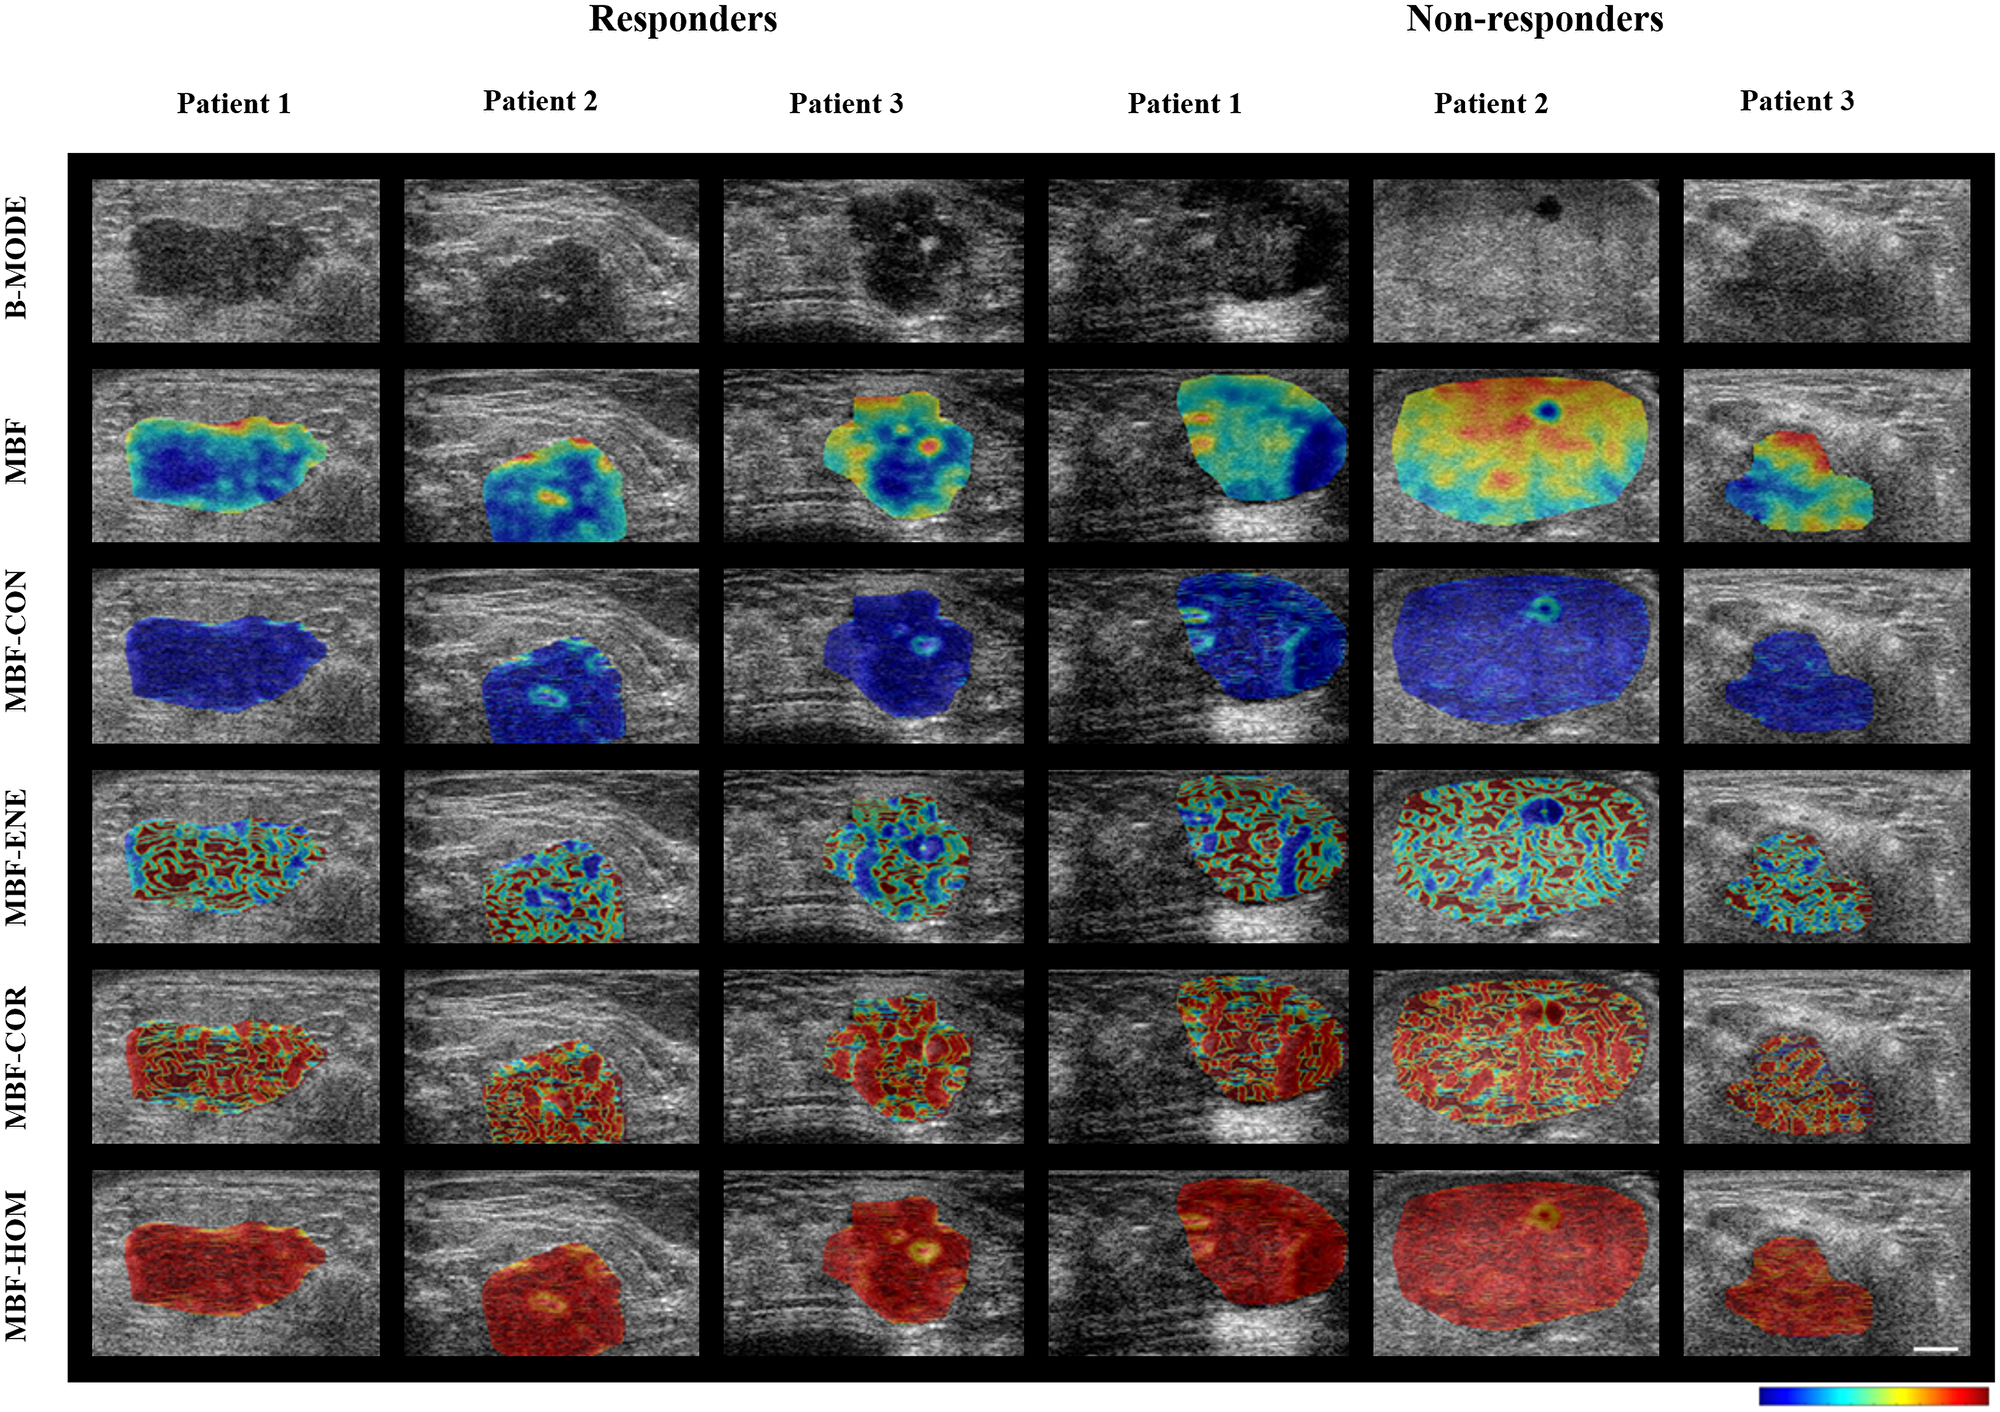
Figure 1: Parametric maps for the two response groups. Representative ultrasound B-mode images with MBF parameter overlays, and MBF-CON, MBF-ENE, MBF-COR, and MBF-HOM feature overlays acquired from three responder and non-responder patients before chemotherapy. To generate the parametric maps, the values were normalized across all the patients (irrespective of treatment response) for individual features. The normalized values for the feature were then represented quantitatively as colors across the sub-regions of interest across the entire tumor volume. The scale bar in ultrasound images represents 5 mm. The color bars represent scales for the MBF parameter of -9 to 18 dBr, for the MBF-CON parameter of 0 to 2.7, for MBF-ENE parameter of 0 to 1, for the MBF-COR parameter of -0.4 to 0.9, and for MBF-HOM parameter of 0 to 1. MBF: Mid-band fit; CON: Contrast; ENE: Energy; COR: Correlation; HOM: Homogeneity.
Table 2: Classifier performance for different machine learning models using QUS-Tex1 and QUS-Tex1-Tex2
| Classifier | Features | Sensitivity | Specificity | PPV | NPV | Accuracy | AUC | Selected parameters |
|---|---|---|---|---|---|---|---|---|
| FLD | QUS-Tex1 | 73% | 60% | 28% | 92% | 62% | 0.60 | SI-COR |
| QUS-Tex1-Tex2 | 67% | 67% | 29% | 91% | 67% | 0.61 | SI-COR | |
| KNN | QUS-Tex1 | 67% | 69% | 31% | 91% | 69% | 0.74 | SI-COR |
| QUS-Tex1-Tex2 | 87% | 81% | 48% | 97% | 82% | 0.86 | AAC-CON-ENE, MBF-COR-ENE, SI-COR-ENE | |
| SVM | QUS-Tex1 | 74% | 67% | 33% | 94% | 69% | 0.79 | MBF, AAC-ENE, ASD-ENE |
| QUS-Tex1-Tex2 | 74% | 67% | 33% | 94% | 69% | 0.79 | SI-ENE, ASD-ENE-CON, MBF-COR-COR |
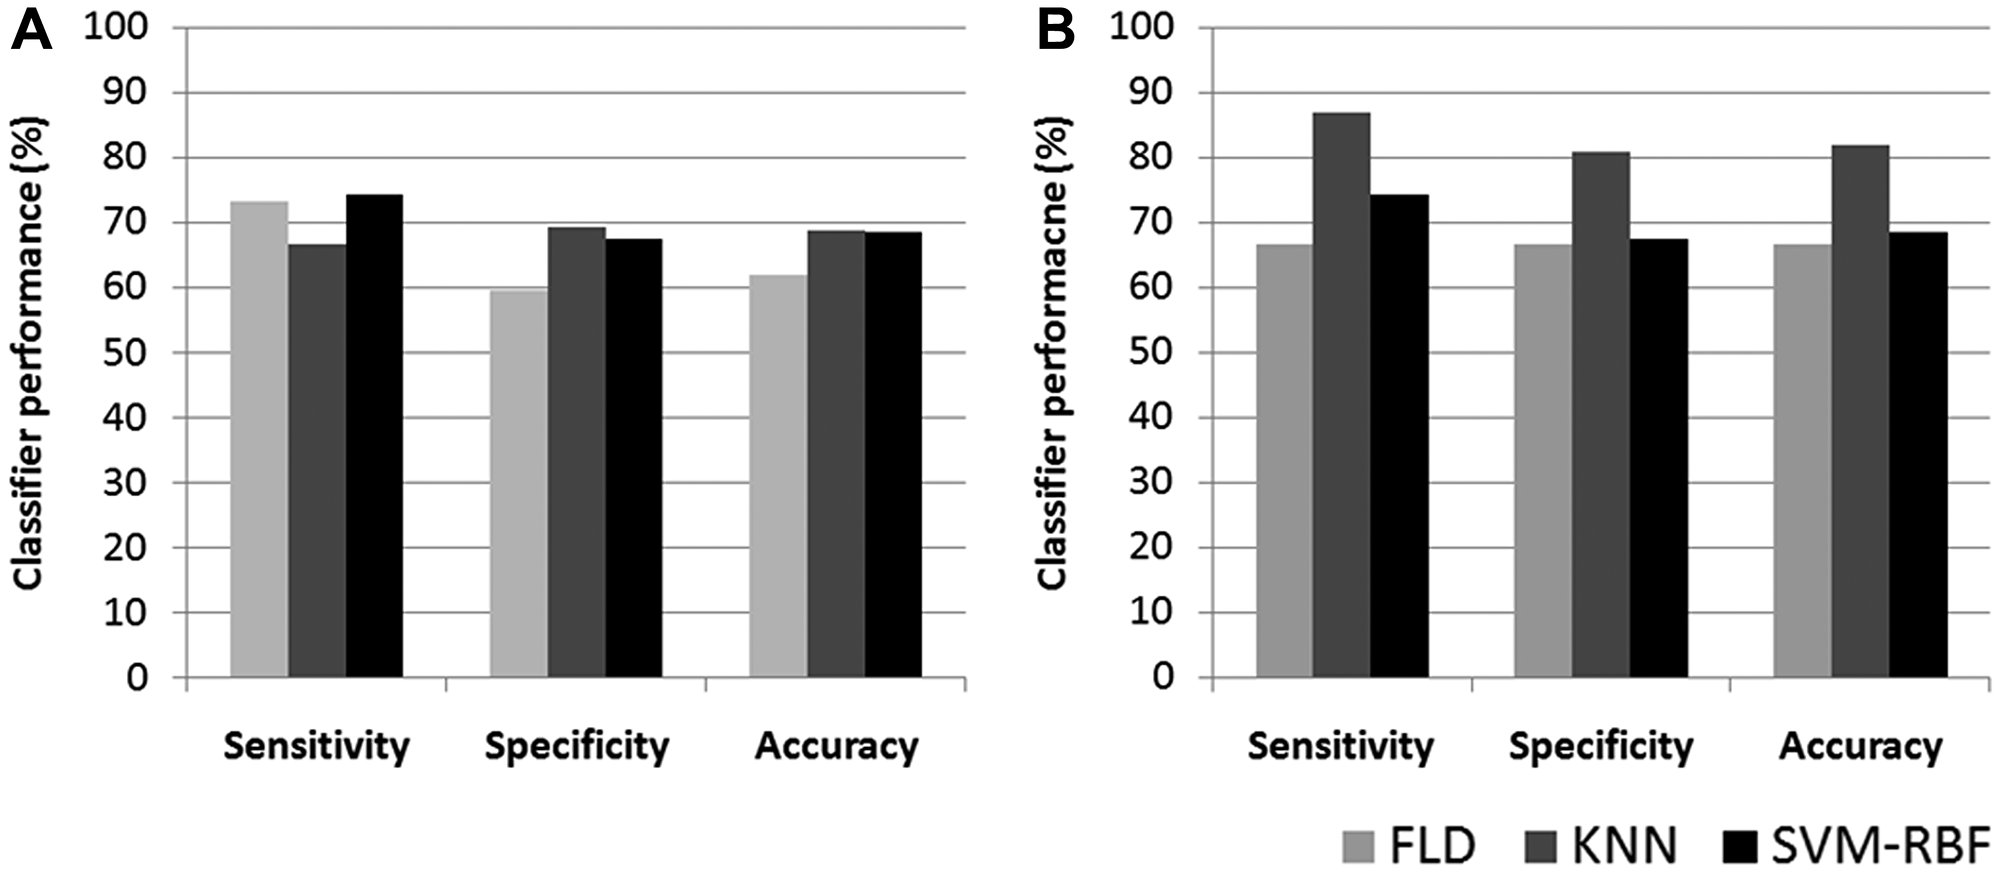
Figure 2: Bar diagram of classifier performance for different models. Classification performance represented as bar diagram based on QUS + QUS-Tex1 (A) and QUS + QUS-Tex1 + QUS-Tex1-Tex2 parameters (B) using FLD, KNN, and SVM-RBF classifiers. QUS: Quantitative ultrasound; FLD: Fisher’s linear discriminant; SVM: Support vector machine; KNN: k-nearest-neighbors.
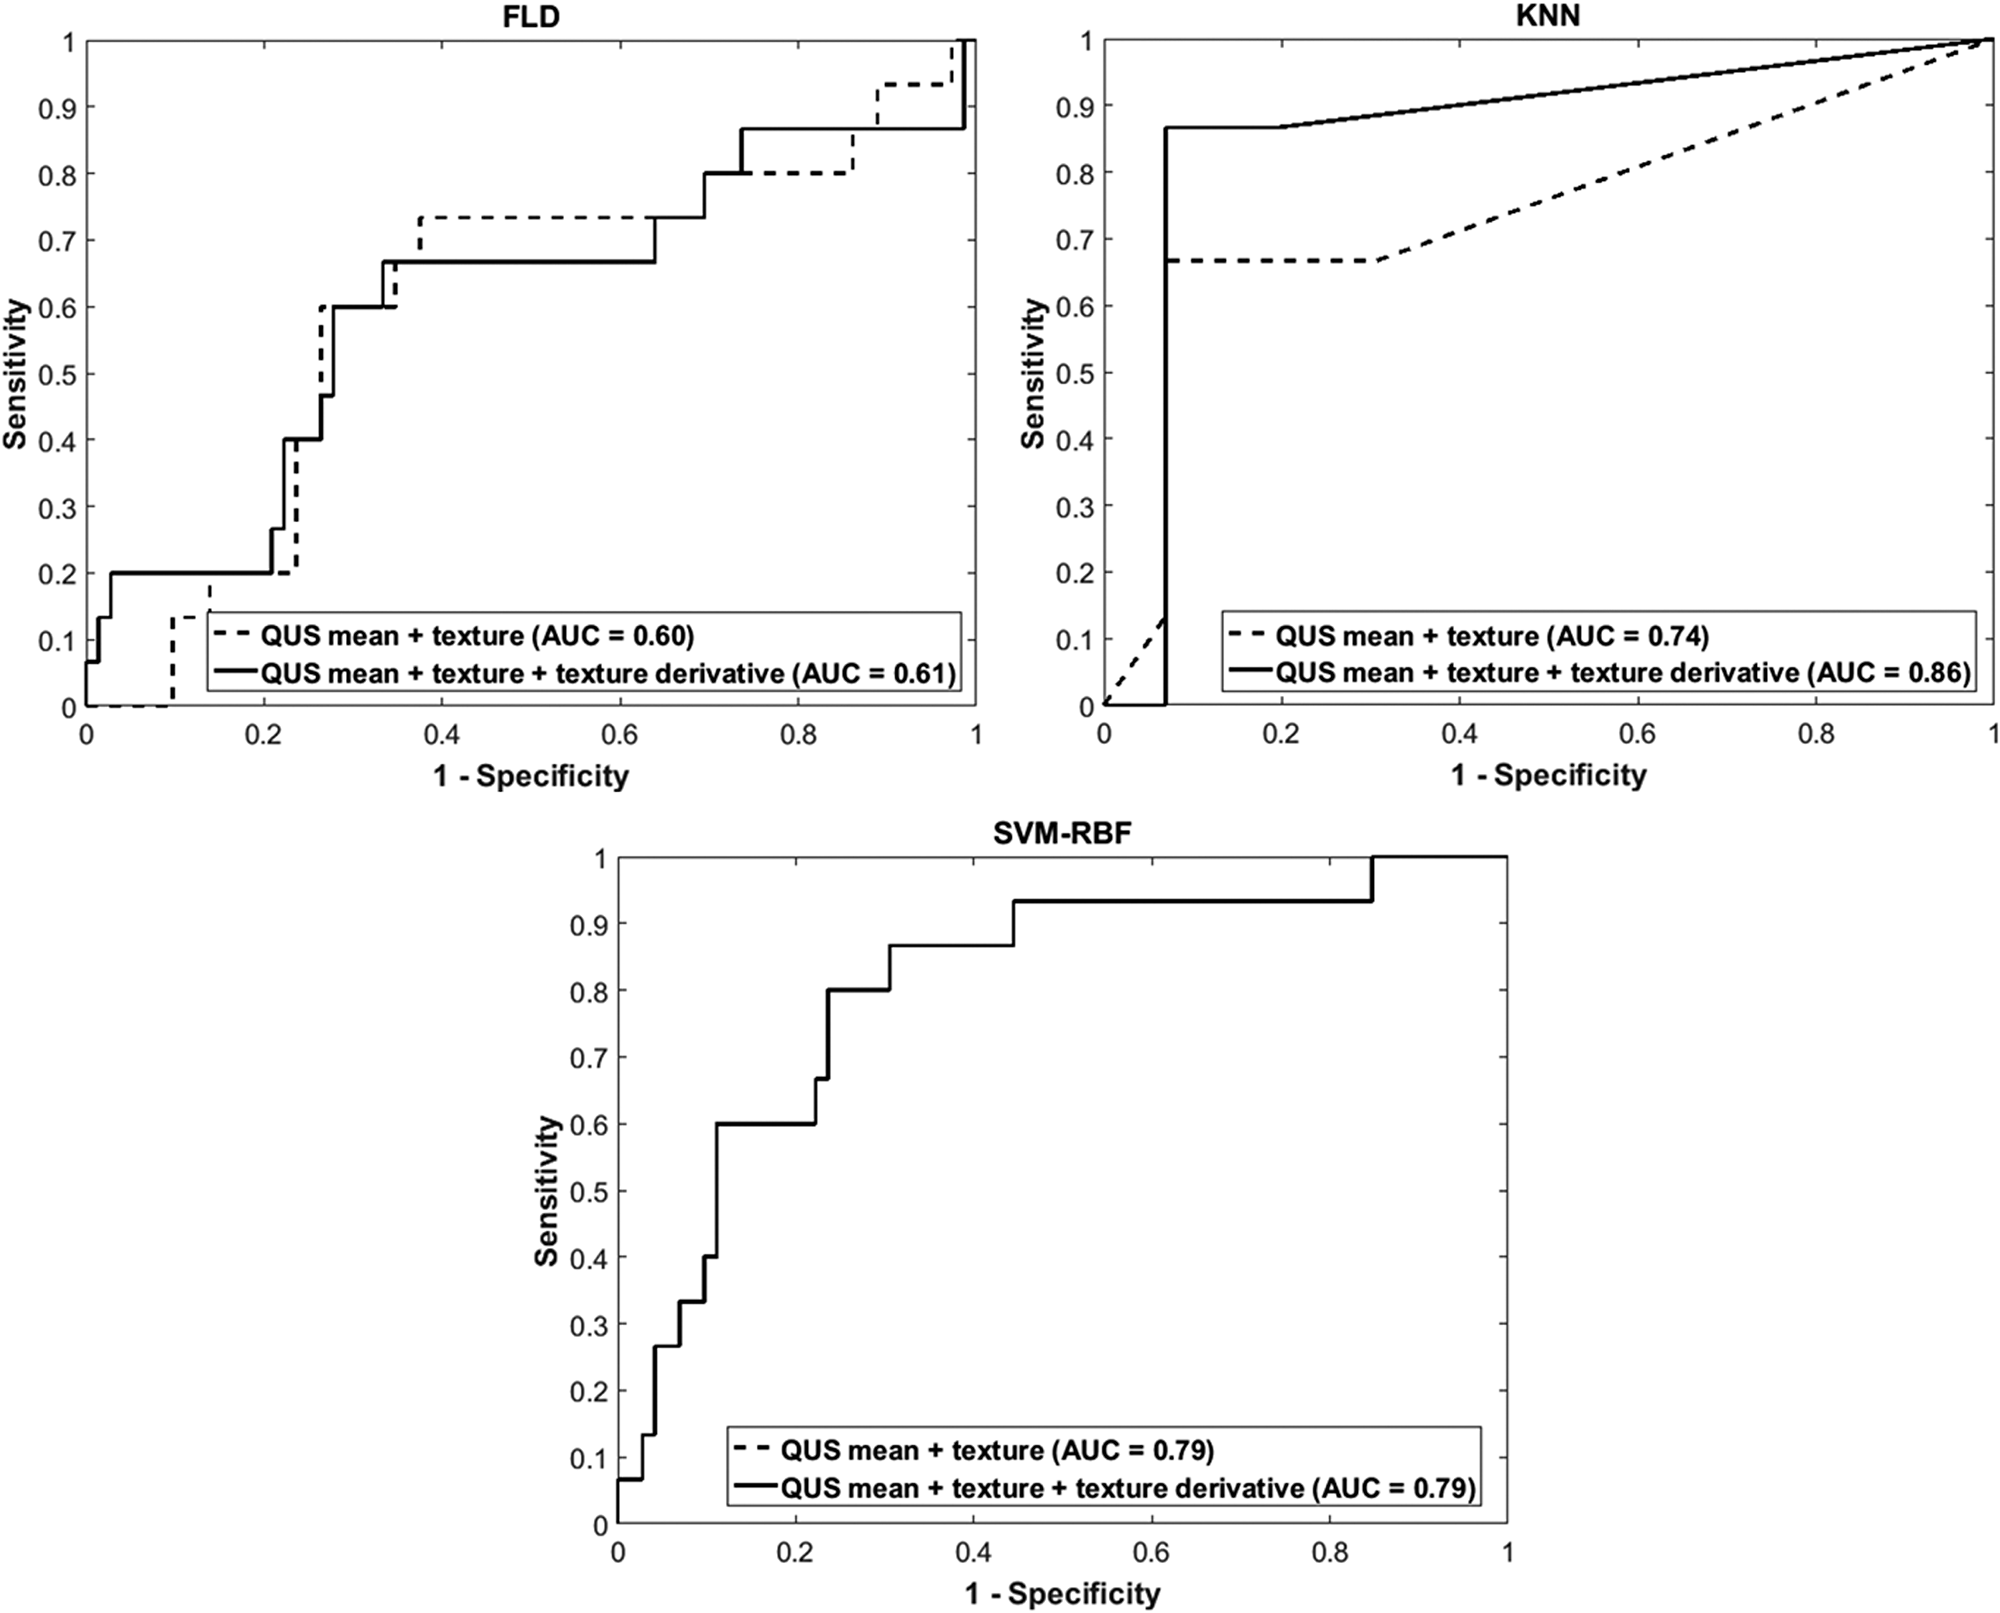
Figure 3: Receiver operator characteristics curves for different models. Receiver operator characteristics curves for the response predictor model obtained based on QUS+QUS-Tex1 (dotted line) and based on QUS + QUS-Tex1 + QUS-Tex1-Tex2 (solid line) using FLD, SVM, and KNN classifiers. QUS: Quantitative ultrasound; FLD: Fisher’s linear discriminant; SVM: Support vector machine; KNN: k-nearest-neighbors; AUC: Area under curve.
The best-selected features for model development are summarized in Table 2. The model used 1 feature for classification when no further improvement (or decrease) in the classifier performance was evident on the subsequent addition of 2nd or 3rd features (for FLD both models and KNN-texture model). The best classifier model (KNN-texture derivatives) used three higher-order features (AAC-CON-ENE, MBF-COR-ENE, SI-COR-ENE) for the group classification.
DISCUSSION
Locally advanced breast cancer encompasses stage III breast cancer, denoting a higher disease burden, either with an extensive primary disease (T3, T4) or advanced nodal involvement (N2, N3) or both [16]. With existing treatment protocols, the five-year overall survival has been reported to be 50–80% and is influenced by clinical, molecular, and treatment-related features [16–19]. Often, due to the extensive nature of the disease, upfront surgery appears challenging for patients with LABC. Systemic therapies before surgery have been shown to result in downsizing tumors and improve resectability [4, 19–21]. Also, the use of NAC permits the assessment of response to systemic treatment, which may serve as a reliable prognostic marker for survival [22]. Response monitoring during therapy with various imaging modalities with the early identification of non-responders provides a window for adopting personalized medicine. Similarly, the anticipation of response before the initiation of treatment may further facilitate decision making by permitting appropriate therapies to be selected. In this study, a novel approach is presented using QUS higher-order texture derivatives in predicting the response to NAC.
Several strategies have been explored for response prediction and monitoring, including molecular analysis and different imaging modalities. It has been shown that the response rates to NAC are dependent on the molecular profiles, with pCR being higher for HER2 overexpression and triple-negative breast cancer subtypes [23, 24]. Molecular signatures based on stromal-related genes have been able to predict resistance to neoadjuvant chemotherapy [25]. Similarly, transcriptional profiling had been used to develop a multigene model to predict pCR in breast cancer patients treated with neoadjuvant paclitaxel and fluorouracil, doxorubicin, and cyclophosphamide [26]. Recently, the circulating tumor DNA (ctDNA) has been used as a potential biomarker for response monitoring in breast cancer receiving NAC [27, 28].
Imaging constitutes an integral role in the current oncological practice. Various imaging modalities like MMG, USG, CT, MRI, and PET-CT are used in the management of patients with breast cancer in diagnostic work up, staging, therapy guidance, response evaluation, and surveillance following treatment completion. Radiomics can help in determining imaging features that can lead to information reflecting underlying cellular biology predicting biological behavior. Literature is limited regarding the utility of baseline imaging features to predict response to NAC or survival outcomes in breast cancer. A study involving patients with triple-negative breast cancer (TNBC) analyzing clinic-pathological factors, found that the presence of microcalcifications on baseline imaging was associated with predicting residual disease as opposed to patients with pCR [29]. Radiogenomics involves the integration of imaging characteristics with molecular information and has shown promising results in breast cancer using baseline MRI features [30]. Texture analysis of T1-weighted dynamic contrast-enhanced MRI features has been used to predict response to NAC in a set of 58 patients with LABC [31]. In previous studies, QUS features from breast tumors were indicated to predict response to NAC and predict survival in a cohort of 56 patients with LABC [14]. The work here extended that data to include 100 patients and uses higher-order features to improve classifier performance further.
The clinical application of QUS spectral and texture analysis to identify a subset of patients likely to respond to NAC as early as four weeks (serial scans) or even before the initiation of treatment (baseline imaging) [14, 32, 33]. In the work here, we included five spectral features and generated a set of 20 texture (QUS-Tex1) and, finally, 80 higher-order texture derivatives (QUS-Tex1-Tex2). Each spectral parameter reflects different aspects of underlying cellular biology; MBF, ASD, and AAC can be related to microstructure and cellular organization, scatterer size, and scatterer number density.
In our previous work involving comparative analysis of QUS parameters from pretreatment and intra-treatment scans, the most evident changes were noticed in mean values of MBF and SI, suggesting microenvironment changes in response to NAC [32]. Here, the KNN model exhibited the best diagnostic matrices, with all the three features selected by the algorithm being texture-derivatives. This resulted in better classifier performance, as evident from improvements in AUC. It is possible that the second-order texture derivatives represent intratumoral heterogeneity better, therefore leading to improved prediction of clinical outcomes. In addition, it may be possible with further sequential texture analysis that underlying information is extracted at finer levels, which otherwise is obscured.
As expected, clinical outcomes were distinctly different between the responders and non-responders as defined by the clinical-pathological criteria and demonstrated in survival plots. This reflects the strong influence of response to neoadjuvant treatment on tumor biological behavior and outcomes depicted by a relapse of breast cancer. It is essential to note although the sensitivity of the three models was comparable (Figure 2B), the specificity and accuracy were higher for classification using the KNN model.
The early identification of patients not responding to NAC does have potentially significant clinical implications. Alternative chemotherapy regimens or upfront surgery should be considered in patients who are refractory to the standard protocols rather than continuing with the ineffective regimens. In a phase 2 randomized study involving HER2+ breast cancer, PET was used for response assessment before the 1st and 2nd cycles of neoadjuvant therapy with docetaxel and trastuzumab. Predicted non-responders were randomly assigned to 4 cycles of the same treatment or the addition of bevacizumab. The addition of bevacizumab for predicted non-responders resulted in better pathological complete response rates [34]. Other studies have indicated a benefit to intensifying treatment in non-responding patients [35]. In addition, there is recent interest in avoiding surgery for patients achieving pCR to NAC, particularly in patients with TNBC or HER2+ tumors, being explored in ongoing trials [36]. The QUS-based model has the potential of identifying such patients ahead of time, helping in treatment decisions.
Based on the results from previous observational studies, the clinical utility of QUS-radiomics is being evaluated in a randomized clinical trial, where patients predicted to have inadequate response can have modifications made to their NAC (http://ClinicalTrials.gov identifier NCT04050228). In that work, the goals are the identification of biological non-responders as soon as the first cycle of chemotherapy to modify the protocol early and avoid unnecessary treatments; the identification of pathological complete responders to possibly avoid surgical procedures.
QUS is a simple, easily accessible imaging modality, with similar scanning techniques akin to the B-mode US, which is widely used in clinical practice. With appropriate data processing, it is possible to use the information normally processed to generate B-mode images to obtain additional information from tumors. These are related to tumor acoustic properties, which can be linked with biological features and clinical behavior. In this research, we established the role of higher-order imaging analysis (radiomics) of QUS in predicting treatment response to NAC involving 100 patients with LABC. The work provides a framework for using QUS-radiomics in clinical practice to choose appropriate chemotherapy regimens or other treatment modalities like upfront surgery (in predicted chemo-resistant tumors), leading the way towards personalized oncology.
Materials and Methods
Patient selection and treatment protocols
All the patients included in this report were obtained from a prospective study approved by the Sunnybrook Health Sciences Centre research ethics board and registered with http://ClinicalTrials.gov (NCT00437879). Patients accrued between January 2009 and January 2017 were included in the current analysis. Written informed consent was obtained from patients before accrual to study. Patients with LABC receiving NAC were considered eligible for the study. All patients were required to have a histological diagnosis of primary breast malignancy before initiation of any treatment with documentation of pathological and molecular information like hormonal receptor or HER 2 status. The choice regarding the NAC regimen and timing was at the discretion of the treating medical oncologist, with almost all patients receiving anthracycline and taxane-based chemotherapy regimens. Also, patients receiving HER 2 targeted therapies in addition to neoadjuvant chemotherapy were allowed in the study.
Following surgery, surgical specimens were evaluated by a board-certified pathologist for the assessment of histological characteristics and tumor response. Patients were classified into responders and non-responders based on the combined clinical and pathological evaluation. This modified response grading system was based on combined radiological and pathological assessment, and had been described in our previous studies [14, 15, 37]. Responders (R) were required to have tumor reduction by at least 30% of pretreatment dimensions, and/or a decrease in cellularity (residual invasive and in-situ < 1%), with all other patients being considered as non-responders (NR).
Ultrasound data acquisition
As a part of this study, ultrasound RF data was acquired using a Sonix RP clinical research system (Analogic Medical Corp., Vancouver) with a linear array transducer (L14-5/60, Analogic Medical Corp., Vancouver) having a central frequency of 7 MHz (bandwidth 4–9 MHz). Imaging was conducted before the initiation of NAC. The sampling frequency of 40 MHz was considered for digital acquisition of ultrasound data with a 16-bit resolution. The tumor was scanned at intervals of 1 cm across the breast to cover the entire range of the primary tumor, with the transducer focused towards the center of the tumor. For the determination of QUS features, the region of interest (ROI) was manually drawn corresponding to the edge of the tumor in all image planes. A recent publication had shown the effects associated with different clinical ultrasound systems, or other factors related to image acquisition can be overcome with appropriate normalization techniques [38]. All the acquired images related to the selected slices for image extraction, segmentation of the tumor were verified by the principal investigator (GJC).
Feature extraction
Quantitative ultrasound parametric maps, including MBF, SS, SI, ASD, and AAC, were determined using quantitative ultrasound techniques described in previous studies [11]. A reference phantom method was used to remove any clinical system dependencies in QUS parameters estimation and standardization. The entire ROI was divided into window blocks (considered as sub-ROIs) of size 10l × 10l with a 94% overlap in axial and lateral directions, where l represents the ultrasound wavelength. This corresponded to 15 by 15 pixels or 2.2 mm by 2.2 mm approximately. For each of the QUS features, values were determined from each sub-ROIs assigning specific values on a quantitative scale, leading to the generation of QUS parametric maps.
For individual QUS features, mean values were determined by averaging QUS values obtained from all the sub-volumes. Four texture features, including CON, ENE, COR, and HOM, were evaluated using a GLCM method to generate QUS-Tex1 features from the QUS parametric maps. Corresponding color-coded QUS-texture feature maps for each QUS parametric map were constructed by making a spatial map of the texture values computed over all the sub-ROI. Subsequently, a second-pass texture analysis using the QUS parametric maps as input was applied to create QUS-Tex1-Tex2 features (texture-of-texture features) (Figure 4). A total number of 105 features (5 QUS, 20 QUS-Tex1, 80 QUS-Tex1-Tex2) were determined from ultrasound data for each tumor.
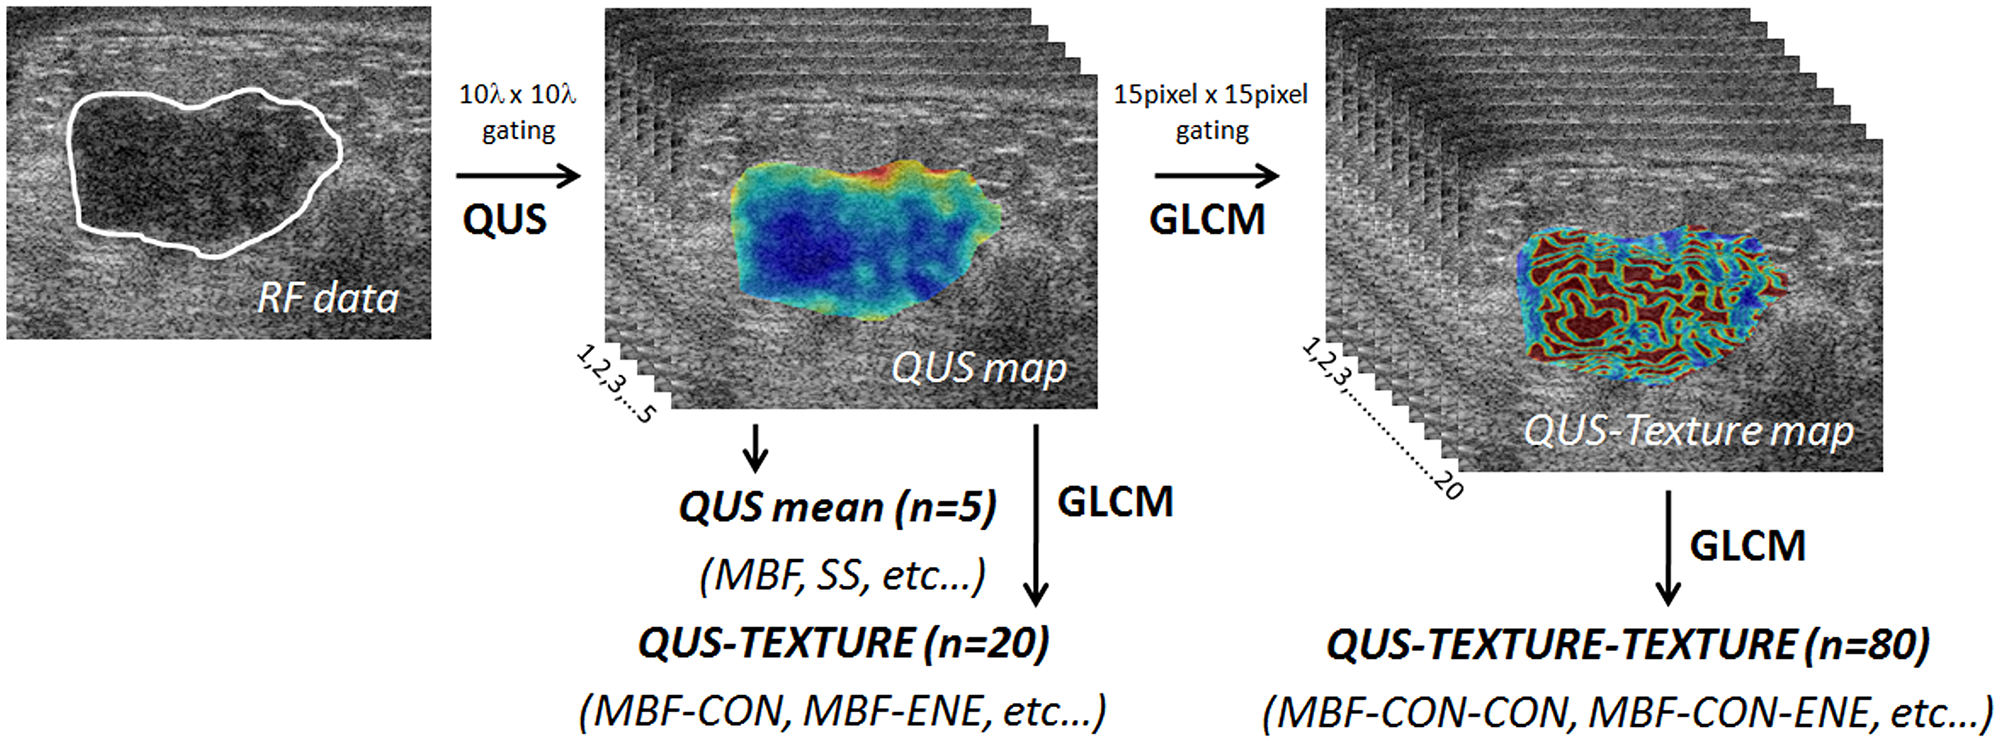
Figure 4: Generation of parametric and texture maps from radiofrequency data. Diagram showing flowchart of the generation of QUS parametric maps, texture, and texture derivative from radiofrequency ultrasound data. QUS: quantitative ultrasound; GLCM: grey level co-occurrence matrix.
Statistical analysis and classification algorithms
The mean values for all features (QUS, QUS-Tex1, QUS-Tex1-Tex2) between the two response groups were compared. A Shapiro-Wilk normality test was undertaken on feature-based data to determine its distribution. An unpaired t-test was completed for normally distributed data; otherwise, a Mann-Whitney test was used. The distribution of categorical variables between the two response groups was studied using the Pearson chi-square test and Fisher’s exact test as indicated. The continuous variables (age, tumor size) were compared using an unpaired t-test or the Mann-Whitney test as appropriate. A value of p < 0.05 was considered to be statistically significant. In this study, three multi-feature machine learning classifiers were used to classify patients into the two response groups. These included FLD, KNN, and SVM analyses. Classification analyses were performed using two data sets independently; (i) QUS means, and QUS-Tex1; or (ii) QUS means, QUS-Tex1 and QUS-Tex1-Tex2. Receiver operating characteristics (ROC) were determined for each classifier-based algorithm (responders versus non-responders) to obtain the AUC, and other indices like sensitivity, specificity, and accuracy were also calculated. Tumor segmentation, QUS data extraction, and classification analyses were performed using MATLAB R2016B (Mathworks, USA). Before performing class analyses, the class imbalance problem was circumvented by subsampling the original data into seven subsets, such that each unit had an equal number of responders and non-responder selected randomly. The feature selection was performed based on a sequential-forward selection method. Analyses permitted a maximum of 3 features in the classification model to avoid overfitting of the model given the number of samples in the cohorts used. Leave one out cross-validation was adopted to test the reliability of the classifiers. Survival analysis was done using a Kaplan Meier product-limit method with the factors compared using a log-rank test.
Conclusions
In summary, the work here reports ultrasound radiomics can detect tumor response before neoadjuvant chemotherapy with high accuracy using texture derivative analysis of parametric images using a machine learning approach. The use of quantitative ultrasound-texture derivative biomarkers can serve as pretreatment survival-linked surrogates of response to cancer-targeting therapies leading the way towards personalized medicine and facilitate in selecting appropriate treatment regimen on an individual patient basis.
Abbreviations
QUS: Quantitative ultrasound; NAC: Neoadjuvant chemotherapy; LABC: Locally advanced breast cancer; QUS-Tex1: Quantitative ultrasound-texture; QUS-Tex1-Tex2: Quantitative ultrasound-texture derivatives; FLD: Fisher’s Linear discriminant; KNN: k-nearest neighbor; AUC: Area under curve; RFS: Recurrence-free survival; USG: Ultrasonography; MMG: Mammography; MRI: Magnetic resonance imaging; CT: Computed tomography; PET: Positron emission tomography; RF: Radiofrequency; ASD: Average scatterer diameter; AAC: Average acoustic concentration; MBF: Mid-band fit; SS: Spectral slope; SI: Spectral 0-MHz intercept; GLCM: Grey-level-co-occurrence matrix; HER 2: Human epidermal growth factor 2; R: Responder; NR: Non-responder; ROI: Region of interest; CON: Contrast; ENE: Energy; COR: Correlation; HOM: Homogeneity; ROC: Receiver operating characteristics; AC-T: Adriamycin, Cyclophosphamide, Paclitaxel; FEC-D: 5-Fluorouracil, Epirubicin, Cyclophosphamide, Docetaxel; pCR: Pathological complete response.
ACKNOWLEDGMENTS
We express our sincere gratitude to all the patients for their participation in the study and their caregivers. We are thankful to the medical oncologists, radiation oncologists, and surgeons from various institutes for their support in patient care. Funding for this work was provided by a Terry Fox Foundation Program Project Grant with funds from the Hecht Foundation and the Canadian Institutes of Health Research (CIHR).
Ethics statement
The study was conducted in accordance with the Declaration of Helsinki. The ethics committee of Sunnybrook Health Sciences Centre, Toronto, was involved in study approval, necessary data monitoring, and appropriate conduct of the research. Written consent form was obtained from all patients. The study was registered with http://ClinicalTrials.gov (Identifier: NCT00437879).
CONFLICTS OF INTEREST
Authors have no conflicts of interest to declare.
FUNDING
Support for funding related to this research was obtained from the Terry Fox Foundation Program Project Grant from the Hecht Foundation (1083), and the Canadian Institutes of Health Research (PJT 159759) awarded to Gregory J. Czarnota. The funding bodies had no influence on the study design, data collection, analysis, interpretation of data, or in the writing of the manuscript.
Availability of data and materials
Anonymized data will be shared based on an individual request in compliance with the institutional ethics committee policies.
References
1. Bray F, Ferlay J, Soerjomataram I, Siegel RL, Torre LA, Jemal A. Global cancer statistics 2018: GLOBOCAN estimates of incidence and mortality worldwide for 36 cancers in 185 countries. CA Cancer J Clin. 2018; 68:394–424. https://doi.org/10.3322/caac.21492. [PubMed].
2. Gradishar WJ, Anderson BO, Abraham J. NCCN Guidelines Insights: Breast Cancer, Version 3.2018. J Natl Compr Canc Netw. 2019; 17:118–126. https://doi.org/10.6004/jnccn.2019.0009. [PubMed].
3. Senkus E, Kyriakides S, Penault-Llorca F, Poortmans P, Thompson A, Zackrisson S, Cardoso F; ESMO Guidelines Working Group. Primary breast cancer: ESMO Clinical Practice Guidelines for diagnosis, treatment and follow-up. Ann Oncol. 2013; 24:vi7–vi23. https://doi.org/10.1093/annonc/mdt284. [PubMed].
4. Tryfonidis K, Senkus E, Cardoso MJ, Cardoso F. Management of locally advanced breast cancer-perspectives and future directions. Nat Rev Clin Oncol. 2015; 12:147–162. https://doi.org/10.1038/nrclinonc.2015.13. [PubMed].
5. Schaefgen B, Mati M, Sinn HP, Golatta M, Stieber A, Rauch G, Hennigs A, Richter H, Domschke C, Schuetz F, Sohn C, Schneeweiss A, Heil J. Can Routine Imaging After Neoadjuvant Chemotherapy in Breast Cancer Predict Pathologic Complete Response? Ann Surg Oncol. 2016; 23:789–795. https://doi.org/10.1245/s10434-015-4918-0. [PubMed].
6. Fowler AM, Mankoff DA, Joe BN. Imaging Neoadjuvant Therapy Response in Breast Cancer. Radiology. 2017; 285:358–375. https://doi.org/10.1148/radiol.2017170180. [PubMed].
7. Lambin P, Rios-Velazquez E, Leijenaar R, Carvalho S, van Stiphout RG, Granton P, Zegers CM, Gillies R, Boellard R, Dekker A, Aerts HJ. Radiomics: extracting more information from medical images using advanced feature analysis. Eur J Cancer. 2012; 48:441–446. https://doi.org/10.1016/j.ejca.2011.11.036. [PubMed].
8. Kononenko I. Machine learning for medical diagnosis: history, state of the art and perspective. Artif Intell Med. 2001; 23:89–109. https://doi.org/10.1016/S0933-3657(01)00077-X. [PubMed].
9. Kourou K, Exarchos TP, Exarchos KP, Karamouzis MV, Fotiadis DI. Machine learning applications in cancer prognosis and prediction. Comput Struct Biotechnol J. 2014; 13:8–17. https://doi.org/10.1016/j.csbj.2014.11.005. [PubMed].
10. Feleppa EJ, Mamou J, Porter CR, Machi J. Quantitative ultrasound in cancer imaging. Semin Oncol. 2011; 38:136–150. https://doi.org/10.1053/j.seminoncol.2010.11.006. [PubMed].
11. Tadayyon H, Sadeghi-Naini A, Czarnota GJ. Noninvasive characterization of locally advanced breast cancer using textural analysis of quantitative ultrasound parametric images. Transl Oncol. 2014; 7:759–767. https://doi.org/10.1016/j.tranon.2014.10.007. [PubMed].
12. Czarnota GJ, Kolios MC, Abraham J, Portnoy M, Ottensmeyer FP, Hunt JW, Sherar MD. Ultrasound imaging of apoptosis: high-resolution non-invasive monitoring of programmed cell death in vitro, in situ and in vivo. Br J Cancer. 1999; 81:520–527. https://doi.org/10.1038/sj.bjc.6690724. [PubMed].
13. Banihashemi B, Vlad R, Debeljevic B, Giles A, Kolios MC, Czarnota GJ. Ultrasound imaging of apoptosis in tumor response: novel preclinical monitoring of photodynamic therapy effects. Cancer Res. 2008; 68:8590–8596. https://doi.org/10.1158/0008-5472.CAN-08-0006. [PubMed].
14. Tadayyon H, Sannachi L, Gangeh MJ, Kim C, Ghandi S, Trudeau M, Pritchard K, Tran WT, Slodkowska E, Sadeghi-Naini A, Czarnota GJ. A priori Prediction of Neoadjuvant Chemotherapy Response and Survival in Breast Cancer Patients using Quantitative Ultrasound. Sci Rep. 2017; 7:45733. https://doi.org/10.1038/srep45733. [PubMed].
15. DiCenzo D, Quiaoit K, Fatima K, Bhardwaj D, Sannachi L, Gangeh M, Sadeghi-Naini A, Dasgupta A, Kolios MC, Trudeau M, Gandhi S, Eisen A, Wright F, et al. Quantitative ultrasound radiomics in predicting response to neoadjuvant chemotherapy in patients with locally advanced breast cancer: Results from multi-institutional study. Cancer Med. 2020; 9:5798–5806. https://doi.org/10.1002/cam4.3255. [PubMed].
16. Giuliano AE, Connolly JL, Edge SB, Mittendorf EA, Rugo HS, Solin LJ, Weaver DL, Winchester DJ, Hortobagyi GN. Breast Cancer—Major changes in the American Joint Committee on Cancer eighth edition cancer staging manual. CA Cancer J Clin. 2017; 67:290–303. https://doi.org/10.3322/caac.21393. [PubMed].
17. Newman LA. Epidemiology of locally advanced breast cancer. Semin Radiat Oncol. 2009; 19:195–203. https://doi.org/10.1016/j.semradonc.2009.05.003. [PubMed].
18. Wang M, Chen H, Wu K, Ding A, Zhang M, Zhang P. Evaluation of the prognostic stage in the 8th edition of the American Joint Committee on Cancer in locally advanced breast cancer: An analysis based on SEER 18 database. Breast. 2018; 37:56–63. https://doi.org/10.1016/j.breast.2017.10.011. [PubMed].
19. Vaidya JS, Massarut S, Vaidya HJ, Alexander EC, Richards T, Caris JA, Sirohi B, Tobias JS. Rethinking neoadjuvant chemotherapy for breast cancer. BMJ. 2018; 360:j5913. https://doi.org/10.1136/bmj.j5913. [PubMed].
20. Mauri D, Pavlidis N, Ioannidis JPA. Neoadjuvant Versus Adjuvant Systemic Treatment in Breast Cancer: A Meta-Analysis. J Natl Cancer Inst. 2005; 97:188–194. https://doi.org/10.1093/jnci/dji021. [PubMed].
21. Asselain B, Barlow W, Bartlett J, Bergh J, Bergsten-Nordström E, Bliss J, Boccardo F, Boddington C, Bogaerts J, Bonadonna G, Bradley R, Brain E, Braybrooke J, et al. Long-term outcomes for neoadjuvant versus adjuvant chemotherapy in early breast cancer: meta-analysis of individual patient data from ten randomised trials. Lancet Oncol. 2018; 19:27–39. https://doi.org/10.1016/S1470-2045(17)30777-5. [PubMed].
22. von Minckwitz G, Untch M, Blohmer JU, Costa SD, Eidtmann H, Fasching PA, Gerber B, Eiermann W, Hilfrich J, Huober J, Jackisch C, Kaufmann M, Konecny GE, et al. Definition and impact of pathologic complete response on prognosis after neoadjuvant chemotherapy in various intrinsic breast cancer subtypes. J Clin Oncol. 2012; 30:1796–1804. https://doi.org/10.1200/JCO.2011.38.8595. [PubMed].
23. Houssami N, Macaskill P, von Minckwitz G, Marinovich ML, Mamounas E. Meta-analysis of the association of breast cancer subtype and pathologic complete response to neoadjuvant chemotherapy. Eur J Cancer. 1990; 2012:3342–3354. https://doi.org/10.1016/j.ejca.2012.05.023. [PubMed].
24. Li F, Ma L, Geng C, Liu C, Deng H, Yue M, Ding Y, Wang X, Liu Y. Analysis of the relevance between molecular subtypes and efficacy of neoadjuvant chemotherapy in breast cancer as well as its prognostic factors. Pathol Res Pract. 2018; 214:1166–1172. https://doi.org/10.1016/j.prp.2018.06.010. [PubMed].
25. Farmer P, Bonnefoi H, Anderle P, Cameron D, Wirapati P, Wirapati P, Becette V, André S, Piccart M, Campone M, Brain E, Macgrogan G, Petit T, et al. A stroma-related gene signature predicts resistance to neoadjuvant chemotherapy in breast cancer. Nat Med. 2009; 15:68–74. https://doi.org/10.1038/nm.1908. [PubMed].
26. Ayers M, Symmans WF, Stec J, Damokosh AI, Clark E, Hess K, Lecocke M, Metivier J, Booser D, Ibrahim N, Valero V, Royce M, Arun B, et al. Gene expression profiles predict complete pathologic response to neoadjuvant paclitaxel and fluorouracil, doxorubicin, and cyclophosphamide chemotherapy in breast cancer. J Clin Oncol. 2004; 22:2284–2293. https://doi.org/10.1200/JCO.2004.05.166. [PubMed].
27. Riva F, Bidard FC, Houy A, Saliou A, Madic J, Rampanou A, Hego C, Milder M, Cottu P, Sablin MP, Vincent-Salomon A, Lantz O, Stern MH, et al. Patient-Specific Circulating Tumor DNA Detection during Neoadjuvant Chemotherapy in Triple-Negative Breast Cancer. Clin Chem. 2017; 63:691–699. https://doi.org/10.1373/clinchem.2016.262337. [PubMed].
28. Takahashi H, Kagara N, Tanei T, Naoi Y, Shimoda M, Shimomura A, Shimazu K, Kim SJ, Noguchi S. Correlation of Methylated Circulating Tumor DNA With Response to Neoadjuvant Chemotherapy in Breast Cancer Patients. Clin Breast Cancer. 2017; 17:61–69.e3. https://doi.org/10.1016/j.clbc.2016.06.006. [PubMed].
29. van la Parra RFD, Tadros AB, Checka CM, Rauch GM, Lucci A, Smith BD, Krishnamurthy S, Valero V, Yang WT, Kuerer HM. Baseline factors predicting a response to neoadjuvant chemotherapy with implications for non-surgical management of triple-negative breast cancer. Br J Surg. 2018; 105:535–543. https://doi.org/10.1002/bjs.10755. [PubMed].
30. Li H, Zhu Y, Burnside ES, Drukker K, Hoadley KA, Fan C, Conzen SD, Whitman GJ, Sutton EJ, Net JM, Ganott M, Huang E, Morris EA, et al. MR Imaging Radiomics Signatures for Predicting the Risk of Breast Cancer Recurrence as Given by Research Versions of MammaPrint, Oncotype DX, and PAM50 Gene Assays. Radiology. 2016; 281:382–391. https://doi.org/10.1148/radiol.2016152110. [PubMed].
31. Teruel JR, Heldahl MG, Goa PE, Pickles M, Lundgren S, Bathen TF, Gibbs P. Dynamic contrast-enhanced MRI texture analysis for pretreatment prediction of clinical and pathological response to neoadjuvant chemotherapy in patients with locally advanced breast cancer. NMR Biomed. 2014; 27:887–896. https://doi.org/10.1002/nbm.3132. [PubMed].
32. Sannachi L, Gangeh M, Tadayyon H, Sadeghi-Naini A, Gandhi S, Wright FC, Slodkowska E, Curpen B, Tran W, Czarnota GJ. Response monitoring of breast cancer patients receiving neoadjuvant chemotherapy using quantitative ultrasound, texture, and molecular features. PLoS One. 2018; 13:e0189634. https://doi.org/10.1371/journal.pone.0189634. [PubMed].
33. Tadayyon H, Sannachi L, Gangeh M, Sadeghi-Naini A, Tran W, Trudeau ME, Pritchard K, Ghandi S, Verma S, Czarnota GJ. Quantitative ultrasound assessment of breast tumor response to chemotherapy using a multi-parameter approach. Oncotarget. 2016; 7:45094–45111. https://doi.org/10.18632/oncotarget.8862. [PubMed].
34. Coudert B, Pierga JY, Mouret-Reynier MA, Kerrou K, Ferrero JM, Petit T, Kerbrat P, Dupré PF, Bachelot T, Gabelle P, Giard S, Coeffic D, Bougnoux P, et al. Use of [(18)F]-FDG PET to predict response to neoadjuvant trastuzumab and docetaxel in patients with HER2-positive breast cancer, and addition of bevacizumab to neoadjuvant trastuzumab and docetaxel in [(18)F]-FDG PET-predicted non-responders (AVATAXHER): an open-label, randomised phase 2 trial. Lancet Oncol. 2014; 15:1493–1502. https://doi.org/10.1016/S1470-2045(14)70475-9. [PubMed].
35. von Minckwitz G, Blohmer JU, Costa SD, Denkert C, Eidtmann H, Eiermann W, Gerber B, Hanusch C, Hilfrich J, Huober J, Jackisch C, Kaufmann M, Kümmel S, et al. Response-guided neoadjuvant chemotherapy for breast cancer. J Clin Oncol. 2013; 31:3623–3630. https://doi.org/10.1200/JCO.2012.45.0940. [PubMed].
36. van la Parra RFD, Kuerer HM. Selective elimination of breast cancer surgery in exceptional responders: historical perspective and current trials. Breast Cancer Res. 2016; 18:28. https://doi.org/10.1186/s13058-016-0684-6. [PubMed].
37. Quiaoit K, DiCenzo D, Fatima K, Bhardwaj D, Sannachi L, Gangeh M, Sadeghi-Naini A, Dasgupta A, Kolios MC, Trudeau M, Gandhi S, Eisen A, Wright F, et al. Quantitative ultrasound radiomics for therapy response monitoring in patients with locally advanced breast cancer: Multi-institutional study results. PLoS One. 2020; 15:e0236182. https://doi.org/10.1371/journal.pone.0236182. [PubMed].
38. Sannachi L, Gangeh M, Naini AS, Bhargava P, Jain A, Tran WT, Czarnota GJ. Quantitative Ultrasound Monitoring of Breast Tumour Response to Neoadjuvant Chemotherapy: Comparison of Results Among Clinical Scanners. Ultrasound Med Biol. 2020; 46:1142–1157. https://doi.org/10.1016/j.ultrasmedbio.2020.01.022. [PubMed].