
INTRODUCTION
Non-alcoholic fatty liver disease (NAFLD) is a clinico-pathological syndrome with lipid accumulation and related pathological changes, in patients without excessive alcohol consumption. It encompasses a broad spectrum of liver injury, ranging from simple steatosis to nonalcoholic steatohepatitis (NASH), fibrosis, and cirrhosis [1]. The pathogenesis of NAFLD is not fully clear. The most widely supported theory is ‘two-hit’ hypothesis. Insulin resistance (IR) acting as the ‘first hit’, plays a key role in hepatic lipid accumulation. Other oxidative stressors give a ‘second hit’, initiating inflammatory cascades and fibrosis [2]. Currently, liver biopsy is the gold standard for NAFLD diagnosis, but not a perfect method due to its invasive nature and inevitable sampling bias. Non-invasive methods, including imaging studies and serologic tests, are emerging as new non-invasive methods in NAFLD diagnosis [1, 3].
Hepatokines are proteins exclusively or predominantly secreted by liver into circulation, which is known to contribute in glucose and lipid metabolism. Major hepatokines isolated now include Angiopoietin-related protein 6, Fetuin-A, Fibroblast growth factor-21 (FGF-21), Insulin-like growth factors (IGFs) and Insulin-like growth factor binding proteins (IGFBPs), Selenoprotein P, and Sex hormone-binding globulin, et al [4]. Their key effect in metabolism is modulating insulin sensitivity, which makes them able to serve as biomarkers of IR [5] and related metabolic disorders, such as NAFLD, type 2 diabetes mellitus (T2DM), and cardiovascular disease (CVD) [4].
Fetuin A (α2-HS-glycoprotein), one member of hepatokine family, is reported to be important regulator of metabolism [4]. In humans, fetuin A gene is located on chromosomal 3q27, whose expression is found to be associated with metabolic syndrome and T2DM [6]. It has been reported that fetuin A positively correlates with markers of early atherosclerosis [7], metabolic syndrome [8, 9] and IR [10, 11]. High circulating fetuin A level was shown to be a strong predictor of incident T2DM [12, 13] and cardiovascular events as well [14], independent of other well-established risk factors, which indicate its role in the pathophysiology of T2DM and CVD [4]. However, in some studies it was found that circulating fetuin A levels were elevated in humans with hepatic fat accumulation [15-17], but there has been different findings [18].
Herein, we performed a case-control study to investigate the association between serum fetuin A level and NAFLD in Chinese population.
RESULTS
A total of 158 subjects were included in this study. The baseline characteristics are presented in Table 1. Serum level of fetuin A in NAFLD patients (0.27±0.17 g/L, P < 0.05) was significantly lower than that in controls (0.32±0.12 g/L, Table 1 ; Figure 1). The mean age of subjects was 41.4 years and 73.4% of them were males. As expected, NAFLD patients presented with a higher BMI than age and gender-matched controls, as well as SBP and DBP (Table 1). In addition, subjects with NAFLD had higher serum levels of liver enzymes (ALT, AST, ALP and GGT), TG, TC, LDL-C, FPG, uric acid, and WBC, while lower levels of HDL-C compared to controls (Table 1). HOMA-IR was significantly higher in NAFLD patients (P < 0.001, Table 1).
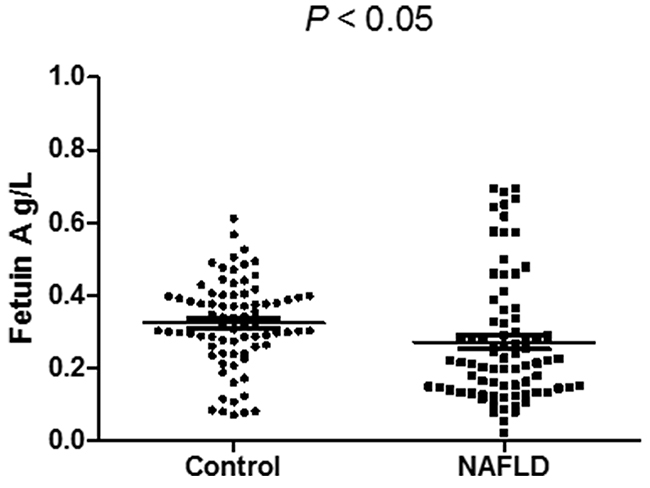
Figure 1: Serum fetuin A level is significantly lower in NAFLD.
Table 1: Baseline characteristics
Variables |
Control |
NAFLD |
Ptrends |
|---|---|---|---|
n (male/female) |
79(58/21) |
79(58/21) |
1.000 |
Age (year) |
40.0±12.0 |
42.8±10.8 |
0.094 |
Body mass index (kg/m2) |
22.0±2.0 |
26.0±3.0 |
< 0.001 |
Systolic blood pressure (mmHg) |
117±15 |
128±13 |
< 0.001 |
Diastolic blood pressure (mmHg) |
71±9 |
79±10 |
< 0.001 |
Alanine aminotransferase (U/L) |
21±13 |
32±21 |
< 0.001 |
Aspartate aminotransferase (U/L) |
21±6 |
24±8 |
< 0.01 |
Alkaline phosphatase (U/L) |
68±19 |
76±19 |
< 0.05 |
γ-Glutamyltransferase (U/L) |
24±18 |
45±43 |
< 0.01 |
Total bilirubin (μmol/L) |
12.7±5.3 |
13.5±5.8 |
0.337 |
Triglyceride (mmol/L) |
1.17±0.63 |
2.12±1.40 |
< 0.001 |
Albumin (g/L) |
48.7±3.0 |
49.2±3.3 |
0.327 |
Total cholesterol (mmol/L) |
4.49±0.91 |
5.15±0.86 |
< 0.01 |
HDL cholesterol (mmol/L) |
1.39±0.37 |
1.22±0.26 |
< 0.05 |
LDL cholesterol (mmol/L) |
2.46±0.74 |
2.96±0.67 |
< 0.05 |
Fasting plasma glucose (mmol/L) |
4.76±0.51 |
5.01±0.85 |
< 0.05 |
Serum uric acid (μmol/L) |
344±77 |
380±87 |
< 0.01 |
White blood cell (×109/L) |
6.4±1.7 |
7.2±1.6 |
< 0.01 |
Platelet count (×109/L) |
228±53 |
236±46 |
0.291 |
HOMA-IR |
1.81±1.80 |
3.27±2.18 |
< 0.001 |
Serum fetuin A (g/L) |
0.32±0.12 |
0.27±0.17 |
< 0.05 |
*mean ± SD
All 158 subjects were divided into four groups (controls, mild, moderate and severe NAFLD), according to of serum ALT level, as indicated in Table 2. Figure 2 shows the comparisons of serum fetuin A levels among the four groups. Compared with controls (0.32±0.12 g/L), mild NAFLD (0.24±0.16 g/L, P < 0.05) and moderate NAFLD (0.25±0.17 g/L, P < 0.05) had significantly lower levels of fetuin A, while serum fetuin A level tended to increase with the severity of NAFLD.
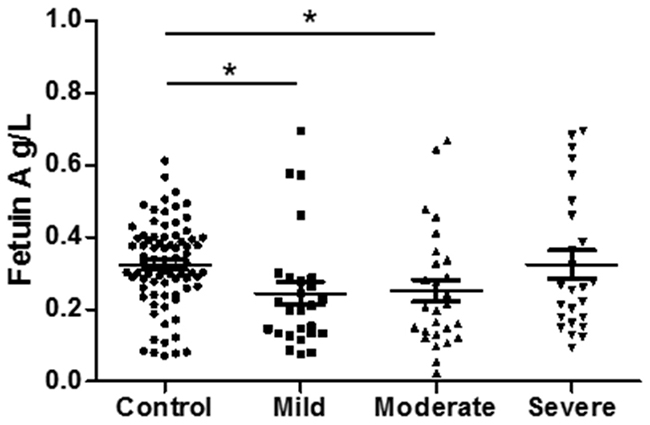
Figure 2: Serum fetuin A level is associated in NAFLD severity.
Table 2: Serum fetuin A level is associated with NAFLD severity
Variables |
Control |
Mild |
Moderate |
Severe |
Ptrends |
|---|---|---|---|---|---|
Alanine aminotransferase (U/L) |
21±13 |
16±3 |
26±4 |
54±22 |
< 0.001 |
Serum fetuin A (g/L) |
0.32±0.12 |
0.24±0.16 |
0.25±0.17 |
0.32±0.19 |
< 0.05 |
No. of subjests |
79 |
26 |
26 |
27 |
|
Age (year) |
40.0±12.0 |
42±12 |
47±10 |
39±10 |
< 0.05 |
n (male/female) |
79(58/21) |
15/11 |
20/6 |
23/4 |
0.148 |
Body mass index (kg/m2) |
22.0±2.0 |
23.3±1.63 |
25.0±3.1 |
27.9±2.8 |
< 0.001 |
Systolic blood pressure (mmHg) |
117±15 |
124±18 |
128±10 |
132±7 |
< 0.001 |
Diastolic blood pressure (mmHg) |
71±9 |
75±12 |
79±10 |
84±6 |
< 0.01 |
Aspartate aminotransferase (U/L) |
21±6 |
25±6 |
27±11 |
21±7 |
< 0.001 |
Alkaline phosphatase (U/L) |
68±19 |
71±18 |
82±14 |
74±23 |
< 0.05 |
γ-Glutamyltransferase (U/L) |
24±18 |
46±35 |
54±42 |
34±49 |
< 0.001 |
Total bilirubin (μmol/L) |
12.7±5.3 |
15.0±6.6 |
13.7±5.2 |
12.0±5.3 |
0.182 |
Triglyceride (mmol/L) |
1.17±0.63 |
2.40±1.07 |
2.62±1.82 |
1.65±1.10 |
< 0.001 |
Albumin (g/L) |
48.7±3.0 |
49.3±3.0 |
48.4±2.7 |
49.7±4.1 |
0.356 |
Total cholesterol (mmol/L) |
4.49±0.91 |
5.24±1.09 |
5.43±0.66 |
4.93±0.76 |
< 0.01 |
HDL cholesterol (mmol/L) |
1.39±0.37 |
1.09±0.20 |
1.22±0.29 |
1.31±0.25 |
< 0.05 |
LDL cholesterol (mmol/L) |
2.46±0.74 |
3.13±0.81 |
3.10±0.57 |
2.78±0.61 |
< 0.01 |
Fasting plasma glucose (mmol/L) |
4.76±0.51 |
4.85±0.43 |
5.27±1.24 |
4.92±0.61 |
< 0.05 |
Serum uric acid (μmol/L) |
344±77 |
402±79 |
398±82 |
342±88 |
< 0.01 |
White blood cell (×109/L) |
6.4±1.7 |
7.2±1.6 |
7.5±1.7 |
7.0±1.5 |
< 0.05 |
Platelet count (×109/L) |
228±53 |
246±51 |
228±46 |
236±41 |
0.397 |
HOMA-IR |
1.81±1.80 |
2.80±2.05 |
3.46±2.24 |
3.56±2.24 |
< 0.001 |
Based on the textiles of serum fetuin A level, all 158 subjects were divided into three groups (T1, T2, and T3), as shown in Table 3. NAFLD proportion presented a significant difference among the three groups (P < 0.001) that the prevalence rate of NAFLD decreased (75 %, 40 %, and 36 %), as fetuin A level elevated (Figure 3). In addition, BMI (P < 0.05) decreased and HOMA-IR showed a decrease-increase trend (P < 0.01) as fetuin A level elevated (Table 3).
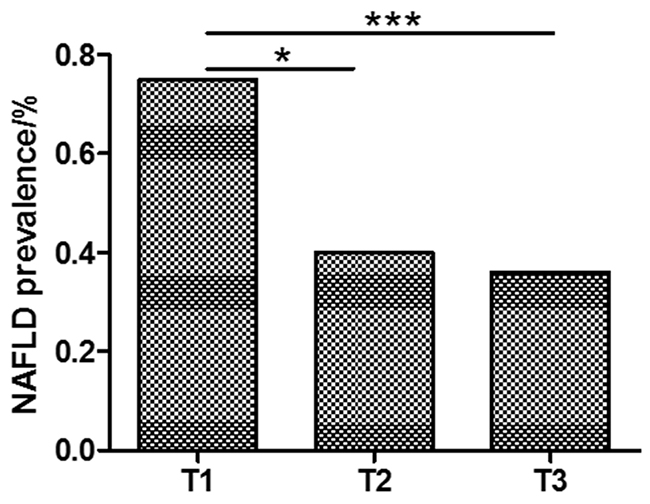
Figure 3: NAFLD is more prevalent in lower fetuin A group.
Table 3: NAFLD proportion is associated with fetuin A tertiles
Variables |
T1 |
T2 |
T3 |
Ptrends |
|---|---|---|---|---|
Serum fetuin A (g/L) |
0.14±0.05 |
0.28±0.03 |
0.47±0.10 |
< 0.001 |
No. of subjests |
52 |
53 |
53 |
|
NAFLD n (%) |
39(75) |
21(40) |
19(36) |
< 0.001 |
Age (year) |
41.5±1.6 |
41.4±12.2 |
40.9±10.6 |
0.963 |
Male, n (%) |
35(67) |
45(85) |
36(68) |
0.068 |
Body mass index (kg/m2) |
24.6±1.6 |
24.3±3.6 |
22.4±3.2 |
< 0.05 |
Systolic blood pressure (mmHg) |
126±9 |
122±16 |
120±15 |
0.285 |
Diastolic blood pressure (mmHg) |
76±9 |
75±13 |
74±10 |
0.795 |
Alanine aminotransferase (U/L) |
25±12 |
27±18 |
27±22 |
0.864 |
Aspartate aminotransferase (U/L) |
24±9 |
22±6 |
22±7 |
0.220 |
Alkaline phosphatase (U/L) |
75±19 |
72±21 |
70±17 |
0.417 |
γ-Glutamyltransferase (U/L) |
40±44 |
31±26 |
33±30 |
0.368 |
Total bilirubin (μmol/L) |
13.1±4.9 |
12.3±6.2 |
13.9±5.4 |
0.330 |
Triglyceride (mmol/L) |
1.85±1.38 |
1.79±1.12 |
1.30±0.84 |
0.135 |
Albumin (g/L) |
48.7±3.0 |
49.1±2.8 |
48.9±3.7 |
0.791 |
Total cholesterol (mmol/L) |
4.91±1.05 |
4.83±0.85 |
4.73±0.92 |
0.765 |
HDL cholesterol (mmol/L) |
1.23±0.24 |
1.27±0.41 |
1.42±0.29 |
0.055 |
LDL cholesterol (mmol/L) |
2.87±0.83 |
2.64±0.73 |
2.62±0.66 |
0.335 |
Fasting plasma glucose (mmol/L) |
4.95±0.96 |
4.86±0.65 |
4.84±0.43 |
0.717 |
Serum uric acid (μmol/L) |
360±73 |
359±93 |
368±86 |
0.845 |
White blood cell (×109/L) |
7.2±1.5 |
6.6±1.8 |
6.7±1.8 |
0.152 |
Platelet count (×109/L) |
237±43 |
227±47 |
233±59 |
0.543 |
HOMA-IR |
3.25±2.17 |
1.94±2.14 |
2.46±1.89 |
< 0.01 |
ROC curve of fetuin A is developed to determine the best cut-off point to improve its diagnostic value of NAFLD (Figure 4). Area under ROC was 0.656, indicating a predictive role of fetuin A in NAFLD.
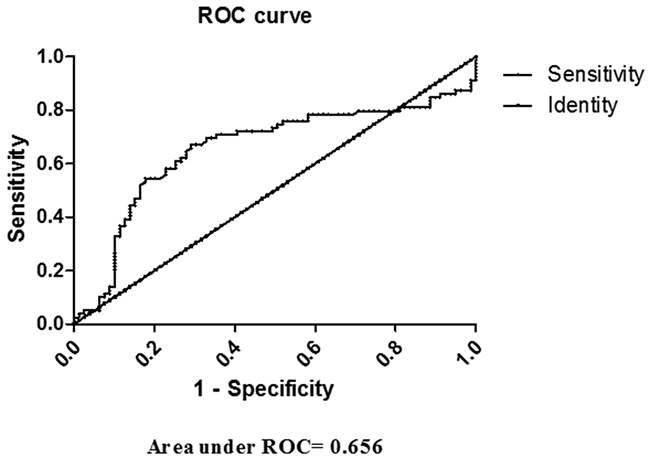
Figure 4: ROC curve of fetuin A in diagnosing NAFLD.
DISCUSSION
In this study, NAFLD patients was shown to have significantly lower serum level of fetuin A than controls in Chinese population, while fetuin A level tended to increase with the severity of NAFLD. Additionally, the prevalence rate of NAFLD increased, as fetuin A level elevated among its textiles.
First, our study population showed typical serological changes as previously reported, represented by higher BMI, SBP and DBP, liver enzymes (ALT, AST, ALP and GGT), liver lipids (TG, TC and LDL-C), FPG, uric acid, and HOMA-IR [19-21]. Previous studies have revealed a dual role of fetuin A in NAFLD. Several article reported that circulating fetuin A level was elevated in NAFLD, whether for adults or children [17, 19, 20]. However, in Japanese population, serum fetuin A level is found to be negatively associated with liver/vessel fibrosis-related markers in NAFLD patients, indicating that circulating fetuin A could be a useful serum biomarker for predicting liver and vascular fibrosis progression in NAFLD patients [18]. In previous basic scientific research, fetuin A was demonstrated to induce IR and activated inflammatory response in NAFLD, indicating an adverse role in NAFLD [22].
Hypothesis has been raised referred to decease-increase trend in serum fetuin A level as NAFLD exacerbated. First, fetuin A was indeed an aggravated element in NAFLD, and down-regulation might be explained by feed-back protection mechanism when steatosis first appeared and cell injury confined to mild range. Second, as disease severity increased, compensatory pathways weakened, and fetuin A as well as other elevated. Third, our study subjects was included f rom annual health examination groups, relatively mild NAFLD, characterized by simple steatosis was identified among all NAFLD patients with no steatohepatitis or fibrosis. So, in general, our population was symbolled by decreased serum fetuin A level. Further populational and basic scientific research are in great need to interpret causal relationship and mechanism in this concern.
There are some limitations in our study. Firstly, all subjects are of health examination population from a single center. In the future, a wider population from multiple centers is needed. Secondly, the diagnosis of NAFLD is based on ultrasonography and the severity of NAFLD is divided by serum ALT level, which were non-invasive, convenient and widely used in clinical studies, despite of not being gold standard as live biopsy.
Our study provides a new way for diagnosis and therapeutic target of NAFLD. Fetuin A, as an important regulator of lipid metabolism, contributes to the development of NAFLD. As serum fetuin A level is lower in mild cases and changes with the severity of NAFLD, it can be used in early diagnosis and disease severity assessment combined with other methods (e.g. ultrasonography). Moreover, besides weight loss, medication regulating the serum level of fetuin A antagonist might be effective for NAFLD treatment. Haukeland JW et al. found that plasma fetuin A level decreased significantly after metformin treatment compared with placebo [17]. Jung TW et al. revealed that salsalate and adiponectin ameliorated hepatic steatosis via fetuin A inhibition through AMPK-NFκB pathway [23]. Based on this, further clinical trials for drugs are required, as well as new therapeutic research.
In conclusion, this case-control study in Chinese population demonstrated that serum level of fetuin A was lower in NAFLD patients than it in controls, while fetuin A level increased with the severity of NAFLD. It suggested fetuin A as a potential biomarker in the development of NAFLD.
MATERIALS AND METHODS
Study design and subjects
79 NAFLD cases and 79 non-NAFLD controls were included in this case-control study. The subjects were adults who received annual health examination in the First Affiliated Hospital of Zhejiang University in 2016. Subjects were excluded if they had excessively alcoholic consumption (men > 140 g/week or women > 70 g/week), viral/drug-induced/autoimmune liver diseases, malignant tumor, severe cardiopulmonary disorders, renal dysfunction, severe inflammatory diseases, thyroid dysfunction and pregnancy. This study was approved by the Ethics Committee of the First Affiliated Hospital of Zhejiang University in accordance with the Helsinki Declaration. All subjects gave informed consent before enrollment.
Diagnostic criteria of NAFLD
NAFLD was diagnosed according to the Guidelines for the diagnosis and management of NAFLD recommended by the Chinese Liver Disease Association [24]. As an important diagnostic method, abdominal ultrasonography was performed for every subject by experienced sonologists using a Toshiba Nemio 20 sonography machine with a 3.5-MHz probe (Toshiba, Tokyo, Japan). In addition, the severity of NAFLD was classified into three grades (mild, moderate, and severe) according to the serum level of alanine aminotransferase.
Anthropometric and serologic examinations
Anthropometric and serologic examinations were performed as previously described [21]. Demographic data, including gender, age, height, body weight, medical history and family medication were recorded. Body mass index (BMI) was calculated as body weight (in kilograms) divided by square of height (in meters). Systolic blood pressure (SBP) and diastolic blood pressure (DBP) were measured with a sphygmomanometer in sitting position. Meanwhile, overnight fasting blood samples were collected from each subject, and serologic tests were performed using a Hitachi 7600 autoanalyzer (Hitachi, Tokyo, Japan). Serum levels of alanine aminotransferase (ALT), aspartate aminotransferase (AST), alkaline phosphatase (ALP), γ-glutamyltransferase (GGT), total bilirubin (TB), triglycerides (TG), albumin, total cholesterol (TC), HDL cholesterol (HDL-C), LDL cholesterol (LDL-C), fasting plasma glucose (FPG), serum uric acid (UA) were recorded, as well as white blood cell (WBC) and platelet count. IR index (homeostasis model assessment for IR, HOMA-IR) was calculated as [fasting insulin (mIU/mL) × fasting plasma glucose (mmol/L)]/22.5 [25]. Serum fetuin A level was measured by a commercial ELISA (No. SEA178Hu; Cloud-Clone Corp., Houston, TX, USA).
Statistics analysis
All statistical analyses were performed using SPSS 20.0 (SPSS Inc., Chicago, IL, USA). Normality of distribution was tested with Kolmogorov–Smirnov test. Normally distributed variables were presented as mean ± standard deviation (SD); variables with skewed distributions were presented as median (interquartile range). Student’s t-test or Mann–Whitney U test for continuous variables, and χ2 test for categorical variables were used to compare the parameters between cases and controls. For comparisons among various groups, one-way ANOVA or Kruskal-Wallis test was performed. Receiver operating characteristic (ROC) curve of fetuin A was developed to help diagnosing NAFLD. A two-sided P < 0.05 was considered statistically significant.
Abbreviations
BMI: Body Mass Index; WC: Waist circumference; FBG: Fasting blood glucose; FINS: Fasting insulin; HOMA-IR: Homeostasis model insulin resistance index; TG: Triglycerides; TC: Total cholesterol; HDL-C: High density lipoprotein cholesterol; LDL-C: Low density lipoprotein cholesterol; UA: Uric acid.
Author contributions
Cui Z designed, conducted whole study and drafted the manuscript; Xuan R collected data, and took part in the statistical analysis; Yang Y provided expertise when conflict existed or consultant needed. All authors have retrieved the manuscript and approved.
CONFLICTS OF INTEREST
There is no conflicts of interest for any author.
FUNDING
This study does not have any funding.
REFERENCES
1. Angulo P. Nonalcoholic fatty liver disease. N Engl J Med. 2002; 346:1221–31.
2. Peverill W, Powell LW, Skoien R. Evolving concepts in the pathogenesis of NASH: beyond steatosis and inflammation. Int J Mol Sci. 2014; 15:8591–638.
3. Oh H, Jun DW, Saeed WK, Nguyen MH. Non-alcoholic fatty liver diseases: update on the challenge of diagnosis and treatment. Clin Mol Hepatol. 2016; 22:327–35.
4. Stefan N, Häring HU. The role of hepatokines in metabolism. Nat Rev Endocrinol. 2013; 9:144–52.
5. Park SE, Park CY, Sweeney G. Biomarkers of insulin sensitivity and insulin resistance: Past, present and future. Crit Rev Clin Lab Sci. 2015; 52:180–90.
6. Siddiq A, Lepretre F, Hercberg S, Froguel P, Gibson F. A synonymous coding polymorphism in the α2-Heremans-schmid glycoprotein gene is associated with type 2 diabetes in French Caucasians. Diabetes. 2005; 54:2477–81.
7. Rittig K, Thamer C, Haupt A, Machann J, Peter A, Balletshofer B, Fritsche A, Haring HU, Stefan N. High plasma fetuin-A is associated with increased carotid intima-media thickness in a middle-aged population. Atherosclerosis. 2009; 207:341–42.
8. Ix JH, Shlipak MG, Brandenburg VM, Ali S, Ketteler M, Whooley MA. Association between human fetuin-A and the metabolic syndrome: data from the Heart and Soul Study. Circulation. 2006; 113:1760–67.
9. Xu Y, Xu M, Bi Y, Song A, Huang Y, Liu Y, Wu Y, Chen Y, Wang W, Li X, Ning G. Serum fetuin-A is correlated with metabolic syndrome in middle-aged and elderly Chinese. Atherosclerosis. 2011; 216:180–86.
10. Mori K, Emoto M, Yokoyama H, Araki T, Teramura M, Koyama H, Shoji T, Inaba M, Nishizawa Y. Association of serum fetuin-A with insulin resistance in type 2 diabetic and nondiabetic subjects. Diabetes Care. 2006; 29:468.
11. Ishibashi A, Ikeda Y, Ohguro T, Kumon Y, Yamanaka S, Takata H, Inoue M, Suehiro T, Terada Y. Serum fetuin-A is an independent marker of insulin resistance in Japanese men. J Atheroscler Thromb. 2010; 17:925–33.
12. Stefan N, Fritsche A, Weikert C, Boeing H, Joost HG, Häring HU, Schulze MB. Plasma fetuin-A levels and the risk of type 2 diabetes. Diabetes. 2008; 57:2762–67.
13. Ix JH, Wassel CL, Kanaya AM, Vittinghoff E, Johnson KC, Koster A, Cauley JA, Harris TB, Cummings SR, Shlipak MG, and Health ABC Study. Fetuin-A and incident diabetes mellitus in older persons. JAMA. 2008; 300:182–88.
14. Weikert C, Stefan N, Schulze MB, Pischon T, Berger K, Joost HG, Häring HU, Boeing H, Fritsche A. Plasma fetuin-a levels and the risk of myocardial infarction and ischemic stroke. Circulation. 2008; 118:2555–62.
15. Stefan N, Hennige AM, Staiger H, Machann J, Schick F, Kröber SM, Machicao F, Fritsche A, Häring HU. Alpha2-Heremans-Schmid glycoprotein/fetuin-A is associated with insulin resistance and fat accumulation in the liver in humans. Diabetes Care. 2006; 29:853–57.
16. Reinehr T, Roth CL. Fetuin-A and its relation to metabolic syndrome and fatty liver disease in obese children before and after weight loss. J Clin Endocrinol Metab. 2008; 93:4479–85.
17. Haukeland JW, Dahl TB, Yndestad A, Gladhaug IP, Løberg EM, Haaland T, Konopski Z, Wium C, Aasheim ET, Johansen OE, Aukrust P, Halvorsen B, Birkeland KI. Fetuin A in nonalcoholic fatty liver disease: in vivo and in vitro studies. Eur J Endocrinol. 2012; 166:503–10.
18. Sato M, Kamada Y, Takeda Y, Kida S, Ohara Y, Fujii H, Akita M, Mizutani K, Yoshida Y, Yamada M, Hougaku H, Takehara T, Miyoshi E. Fetuin-A negatively correlates with liver and vascular fibrosis in nonalcoholic fatty liver disease subjects. Liver Int. 2015; 35:925-935. https://doi.org/10.1111/liv.12478.
19. Lebensztejn DM, Białokoz-Kalinowska I, Kłusek-Oksiuta M, Tarasów E, Wojtkowska M, Kaczmarski M. Serum fetuin A concentration is elevated in children with non-alcoholic fatty liver disease. Adv Med Sci. 2014; 59:81–84.
20. Ballestri S, Meschiari E, Baldelli E, Musumeci FE, Romagnoli D, Trenti T, Zennaro RG, Lonardo A, Loria P. Relationship of serum fetuin-A levels with coronary atherosclerotic burden and NAFLD in patients undergoing elective coronary angiography. Metab Syndr Relat Disord. 2013; 11:289–95.
21. Xu C, Chen Y, Xu L, Miao M, Li Y, Yu C. Serum complement C3 levels are associated with nonalcoholic fatty liver disease independently of metabolic features in Chinese population. Sci Rep. 2016; 6:23279.
22. Lebensztejn DM, Flisiak-Jackiewicz M, Białokoz-Kalinowska I, Bobrus-Chociej A, Kowalska I. Hepatokines and non-alcoholic fatty liver disease. Acta Biochim Pol. 2016; 63:459–67.
23. Jung TW, Youn BS, Choi HY, Lee SY, Hong HC, Yang SJ, Yoo HJ, Kim BH, Baik SH, Choi KM. Salsalate and adiponectin ameliorate hepatic steatosis by inhibition of the hepatokine fetuin-A. Biochem Pharmacol. 2013; 86:960–69.
24. Fan JG, Jia JD, Li YM, Wang BY, Lu LG, Shi JP, Chan LY, and Chinese Association for the Study of Liver Disease. Guidelines for the diagnosis and management of nonalcoholic fatty liver disease: update 2010: (published in Chinese on Chinese Journal of Hepatology 2010; 18:163-166). J Dig Dis. 2011; 12:38–44.
25. Ou HY, Yang YC, Wu HT, Wu JS, Lu FH, Chang CJ. Increased fetuin-A concentrations in impaired glucose tolerance with or without nonalcoholic fatty liver disease, but not impaired fasting glucose. J Clin Endocrinol Metab. 2012; 97:4717–23.