
INTRODUCTION
During pregnancy, high concentrations of total cholesterol, triglycerides (TG), low-density lipoprotein-cholesterol (LDL-C), high-density lipoprotein-cholesterol (HDL-C) levels are common [1]. Studies have shown that serum lipid levels begin rising from the 9th to 13th week of gestation, reach the peak at the 31st to 36th week, maintain at the plateau until childbirth, and finally decline to normal levels 4 to 6 weeks postpartum [2]. Lipid profile disorders are recognized to be involved in the pathophysiology of cardiovascular disease and diabetes [3–6]. HDL-C is a well-known protective lipoprotein. Low plasma HDL-C is an independent risk factor for multiple diseases during pregnancy, including coronary heart disease (CHD), diabetes, and preeclampsia [3, 7]. Decrease in maternal HDL-C levels could also affect fetal programming and susceptibility to chronic diseases in later life [4, 5].
Environmental and genetic factors are important in determining HDL-C levels and the estimated heritability of blood lipid levels is 40–70% [6, 8]. Therefore, the hereditary basis of HDL-C levels was investigated intensively using genome-wide association studies (GWAS) and mitochondrial GWA analysis [9]. To date, 71 single-nucleotide polymorphisms (SNPs) in 71 genes have been found to be associated with HDL-C levels [10] and a few have been verified in the Chinese population [11, 12]. Due to the differences in genome-wide linkage disequilibrium patterns between different ethnic groups and the changes in lipids that occur during pregnancy, it is unclear whether the loci identified in European GWAS also exert similar effects on lipid levels among the pregnant Chinese Han population.
Currently, an increasing number of studies have revealed that microRNAs (miRNAs) play critical roles in various physiological processes. MiRNAs are endogenous, small noncoding RNA molecules about 20 nucleotides in length, that function by binding to the 3’-untranslated region (3’UTR) of target gene mRNAs to regulate gene expression. Recent evidence shows that different miRNAs regulate the expression of target gene through binding to different genotype of the specific SNPs in 3’UTR of the target gene [13]. These kinds of SNPs in miRNA-binding sites of 3’UTR are known to contribute greatly to disease susceptibility, such as angiocardiopathy and diabetes [14, 15].
In this study, we aimed to investigate whether the loci in HDL-C-related genes identified by GWAS and miR-binding SNPs are correlated with HDL-C level in pregnant Chinese Han women.
RESULTS
The clinical characteristics of the pregnant subjects are shown in Table 1. The median of age, gestational week, fasting plasma glucose, pre-pragnancy BMI, HOMAIR, fetal birth weight, total cholesterol, TG, HDL-C, and LDL-C was 31 (yrs), 27.71 (w), 4.60 (mmol/L), 21.09 (kg/m2), 1.44, 3.32 (kg), 6.07 (mmol/L), 2.36 (mmol/L), 2.02 (mmol/L) and 3.31 (mmol/L), respectively.
Table 1: Clinical characteristics of all subjects
Median |
QR |
||
|---|---|---|---|
P25 |
P75 |
||
Age (years) |
31 |
29 |
34 |
Gestational week (weeks) |
27.71 |
26.43 |
28.86 |
Fasting plasma glucose (mmol/L) |
4.60 |
4.33 |
4.90 |
pre-pregnancy BMI (kg/m2) |
21.09 |
19.36 |
23.19 |
HOMAIR |
1.44 |
0.96 |
2.20 |
Fetal birth weight (kg) |
3.32 |
3.02 |
3.63 |
Total cholesterol (mmol/L) |
6.07 |
5.36 |
6.77 |
TG (mmol/L) |
2.36 |
1.88 |
2.98 |
HDL-C (mmol/L) |
2.02 |
1.75 |
2.30 |
LDL-C (mmol/L) |
3.31 |
2.76 |
3.92 |
Data is reported as median (interquartile range) for the quantitative variables with a non-normal distribution.
The allelic and genotype frequencies of the seven SNPs were in Hardy-Weinberg equilibrium in all subjects (P > 0.05). The three miR-binding SNPs (rs4225, rs1059611, and rs16851339) were predicted to interact with hsa-miR-486-3p, hsa-miR-136, and hsa-miR-1260, respectively (Table 2).
Table 2: SNPs in the 3'UTR of HDL-related genes and predicted miRNA binding partner
SNP (gene) |
Minor/major |
Chromosome |
MAF in 1000 |
Predicted binding |
Algorithm |
|---|---|---|---|---|---|
rs4225 (APOC3) |
T/G |
11:116832955 |
0.189 |
hsa-miR-486-3p |
SNP Function Prediction&TargetScan |
rs1059611 (LPL) |
C/T |
8:19967052 |
0.097 |
hsa-miR-136 |
SNP Function PredictionµRNA.org |
rs16851339 (GALNT2) |
A/T |
1:230281086 |
0.097 |
hsa-miR-1260 |
SNP Function Prediction&miRDB |
MAF: minor allele frequency; CHB: Han Chinese in Beijing.
The frequency and the HDL level of each genotype under the additive model are presented in Table 3. After nonparametric data analysis, we discovered that HDL level was significantly associated with rs3764261 (p= 6.70E-6), rs1532085 (p=3.18E-3), rs7241918 (p= 0.0482), rs1883025 (p= 5.06E-3), rs4225 (p= 9.36E-7) and rs16851339 (p= 0.0149). No association with HDL level was observed with respect to rs1059611.
Table 3: Comparison of HDL-C level among pregnant Chinese Han women with different genotype of specific SNP
SNP (gene) |
Genotype |
Subject number (%)a |
HDL levelb |
Additive model P valuec |
|---|---|---|---|---|
rs3764261 (CETP) |
AA |
58(3) |
2.29(1.99, 2.56) |
6.70E-6 |
AC |
506(28) |
2.03(1.76, 2.33) |
||
CC |
1246(69) |
1.99(1.72, 2.27) |
||
rs1532085 (LIPC) |
AA |
410(23) |
2.06(1.79, 2.33) |
3.18E-3 |
AG |
897(50) |
2.02(1.75, 2.31) |
||
GG |
498(27) |
1.95(1.69, 2.25) |
||
rs7241918 (LIPG) |
GG |
22(1) |
1.84(1.61, 2.15) |
0.0482 |
GT |
357(20) |
1.98(1.70, 2.29) |
||
TT |
1436(79) |
2.02(1.75, 2.30) |
||
rs1883025 (ABCA1) |
TT |
81(5) |
1.93(1.71, 2.29) |
5.06E-3 |
TC |
605(33) |
1.95(1.72, 2.24) |
||
CC |
1129(62) |
2.05(1.76, 2.33) |
||
rs4225 (APOC3) |
TT |
69(4) |
1.79(1.61, 2.16) |
9.36E-7 |
TG |
559(31) |
1.94(1.68, 2.24) |
||
GG |
1201(65) |
2.04(1.78, 2.33) |
||
rs1059611 (LPL) |
CC |
15(1) |
2.01(1.70, 2.12) |
0.6628 |
CT |
277(15) |
1.98(1.76, 2.25) |
||
TT |
1519(84) |
2.01(1.74, 2.30) |
||
rs16851339 (GALNT2) |
AA |
29(2) |
2.17(2.02, 2.36) |
0.0149 |
AT |
347(19) |
2.06(1.73, 2.34) |
||
TT |
1458(79) |
1.99(1.74, 2.29) |
aThe total number is different from the whole sample size 1884 because the genotyping success rates were 96.1%, 95.8%, 96.3%, 96.3%, 97.1%, 96.1% and 97.3% for rs3764261, rs1532085, rs7241918, rs1883025, rs4225, rs1059611 and rs16851339, respectively, not 100%.
bData are reported as median (interquartile range) HDL level for non-normally distributed data.
cP value returned from nonparametric tests.
Table 4 shows the associations between HDL-C levels and the seven SNPs in a multiple linear regression model after adjusting for age, gestational week, pre-pregnancy BMI and state of GDM or HOMAIR, respectively, for the significant correlation between “state of GDM” and “HOMAIR”. The four of seven SNPs were found to be significantly associated with HDL-C levels after adjustment in both models, including rs3764261 (b = -0.055 mmol/L, 95% CI -0.101 to -0.008, p = 0.021), rs1883025 (b = -0.054 mmol/L, 95% CI -0.097 to -0.012, p = 0.013), rs4225 (b = -0.071 mmol/L, 95% CI -0.116 to -0.027, p = 1.79E-3) and rs16851339 (b = -0.064 mmol/L, 95% CI -0.120 to -0.008, p = 0.025).Subsequently, the compound effects of multiple risk alleles of susceptible loci on HDL-C were investigated. Here we only selected SNPs significantly associated with HDL-C (rs3764261, rs1883025, rs4225 and rs16851339) and calculated the compound effects by summing the number of risk alleles for each participant (0 to 8 alleles). Individuals were classified into one of three different groups according to the number of risk alleles in their genome (group1: 0-2 alleles, group2: 3-5 alleles, and group3: 6-8 alleles). We found that an increased number of risk alleles was associated with lower plasma HDL-C levels (Figure 1). Subjects in group3 had significantly lower HDL-C levels than subjects in group2 and group1, and group2 had lower HDL-C levels than group1. (median HDL-C (mmol/L) [95% CI]: group1 = 2.26 [2.16-2.35]; group2 = 2.04 [2.02-2.06]; and group3 = 1.92 [1.86-1.98]).
Table 4: Associations between HDL-C levels and SNPs in pregnant Chinese Han women
SNP (gene) |
Effect allele/ |
Regression analysis |
|||
|---|---|---|---|---|---|
Effect size (95%CI) |
P valuea |
Effect size (95%CI) |
P valueb |
||
rs3764261 (CETP) |
C/A |
-0.055(-0.101,-0.008) |
0.021 |
-0.056(-0.104,-0.008) |
0.023 |
rs1532085 (LIPC) |
G/A |
-0.017(-0.052,0.018) |
0.329 |
-0.017(-0.053,0.020) |
0.368 |
rs7241918 (LIPG) |
G/T |
-0.052(-0.107,0.004) |
0.068 |
-0.043(-0.100,0.015) |
0.150 |
rs1883025 (ABCA1) |
T/C |
-0.054(-0.097,-0.012) |
0.013 |
-0.052(-0.096,-0.007) |
0.023 |
rs4225 (APOC3) |
T/G |
-0.071(-0.116,-0.027) |
1.79E-3 |
-0.080(-0.126,-0.033) |
8.86E-4 |
rs1059611 (LPL) |
C/T |
-0.003(-0.066,0.060) |
0.917 |
-0.027(-0.093,0.039) |
0.419 |
rs16851339 (GALNT2) |
T/A |
-0.064(-0.120,-0.008) |
0.025 |
-0.062(-0.120,-0.004) |
0.036 |
a P values are adjusted for age, gestational week, pre-pregnancy BMI and state of GDM
b P values are adjusted for age, gestational week, pre-pregnancy BMI and HOMAIR.
P values < 0.05 are shown in bold.
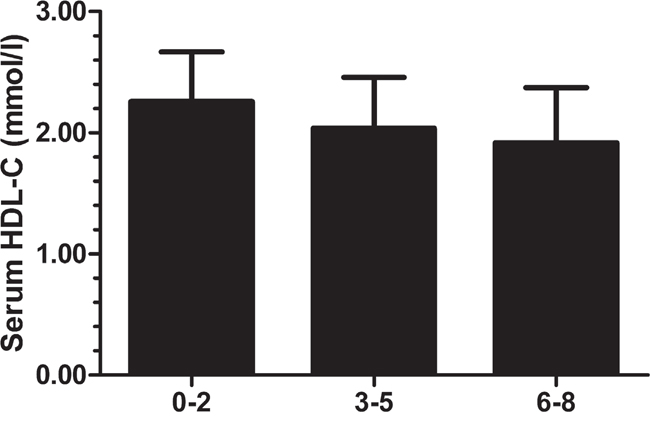
Figure 1: Analysis of the combined effect of multiple alleles associated with low HDL-C. For each participant with complete genotype information for the 7 SNPs, the number of alleles associated with low HDL-C were counted (C of rs3764261, T of rs1883025, T of rs4225, and T of rs16851339). Subjects with 0-2, 3-5, or 6-8 alleles were grouped.
DISCUSSION
Expression of several lipid related genes has been shown to be inhibited by estrogen in adipocytes such as LPL [16]. During pregnancy, the levels of hormones especially estrogen and progesterone change significantly. Therefore, it is necessary to explore the contribution of the HDL-C related genes identified in non-pregnancy population to the variation in serum HDL-C level during pregnancy. In this study, the association between HDL-C-related SNPs from GWAS as well as miRNA-binding sites and the risk of low HDL-C in pregnant Chinese Han women was identified for the first time. Our study shows that CETP rs3764261, ABCA1 rs1883025, APOC3 rs4225 and GALNT2 rs16851339 are associated with HDL-C level, while the other three SNPs, including LIPC rs1532085, LIPG rs7241918 and LPL rs1059611, are not. And we also find that the more risk alleles a pregnant woman carries, the lower her HDL-C levels will be.
ABCA1 rs1883025
The ABCA1 gene (9q31.1) encoding the ATP-binding cassette transporter A1, plays a vital role in the pathogenesis of atherosclerosis and visual loss. Over-expression of ABCA1 increases cellular lipid and cholesterol efflux and levels of plasma HDL [17]. Rs1883025 was originally identified as genetic determinants of HDL-C level by GWAS in 2010 (effect size = - 0.0243 mmol/L, p = 1.75 × 10⁻³³) [8] and our results replicate that the A allele of rs1883025 renders Chinese pregnant women susceptible to lower HDL-C levels.
In a study of meta-analysis which aimed to characterize GWAS-identified variants in diverse population-based studies, researchers were unable to replicate the finding that ABCA1 rs1883025 is associated with lipid levels in six different racial/ethnic groups (European American, African American, American Indian, Mexican American/Hispanic, Japanese/East Asian, and Pacific Islander/Native Hawaiian adults). The association did not have sufficient power, which is duing to mainly the smaller sample sizes of non-European American population, to detect the effect size reported in GWAS (68% power; n= 3,865) [18]. The relationship between rs1883025 and HDL-C level during pregnancy and the underlying pathogenic mechanism need to be further studied.
CETP rs3764261
The role of CETP in metabolism of HDL-C is well studied. CETP facilitates the net transfer of cholesteryl ester from HDL-C to other lipoproteins and transports cholesterol from peripheral tissues to the liver and regulates the concentration of HDL-C [19]. In this study, we discovered that the G allele of rs3764261 was associated with lower HDL-C levels in pregnant Chinese Han women (b = -0.055 mmol/L), which is in accordance with the results of GWAS (b=-0.0875 mmol/L) [8] and other studies in the Indian [20], Japanese [21], and Latvian [22] populations. Supporting our findings, a previous study of the Chinese Xinjiang population found that carriers of the T allele of rs3764261 had significantly lower risk of dyslipidemia compared with carriers of the major G allele [23].
LIPC rs1532085 and LIPG rs7241918
LIPC plays a key role in the lipid metabolism pathway. A study identified the effects of a gene-gene interaction between LIPC rs1532085 and other genome-wide SNPs on HDL-C levels thus finding that rs1532085 is an expression QTL (eQTL) of LIPC, a gene that is a hub in the gene-gene interaction network that regulates HDL-C levels [24]. However, in our study, we observed no association between rs1532085 and HDL-C after adjusting for age, gestational week, pre-pregnancy BMI, state of GDM and HOMAIR, which is not in accordance with the results of GWAS (effect size = -0.0375 mmol/L) [8]. A relatively lower effect (b = -0.017 mmol/L, 95% CI -0.053 to 0.020, p= 0.368) might result in this inconsistent conclusion.
Similar to LIPC rs1532085, we did not find the correlation between LIPG rs7241918 and HDL-C as reported previously either (effect size = -0.0339 mmol/L for G allele) [8]. This discrepancy might be attributed to racial differences and the altered physiological conditions during pregnancy [25].
Because little is known about these loci, further exploration is needed.
APOC3 rs4225, GALNT2 rs16851339, and LPL rs1059611
Rs4225 locating in the 3’UTR of APOC3 is found associated with HDL-C in pregnant Chinese Han women (b = -0.071 mmol/l for allele T) and hsa-miR-486-3p was predicted to be its binding miRNA. There are no studies examining the relationship between APOC3 rs4225 and HDL-C level in any race yet, however, one study [26] recently found that the T allele of rs4225 suppressed APOC3 translation by facilitating its binding with miR-4271, which impacts the key function of rs4225 on the plasma TG regulation. It is well known that the expression of specific target gene is regulated by numbers of microRNAs, therefore, there may be multiple kinds of miRNAs binding with the SNP rs4225 to influence the plasma lipid level.
We also found that the T allele of GALNT2 rs16851339 contributes to lower HDL-C levels (b = -0.064 mmol/L). Genome-wide SNP association studies have identified the GalNAc-transferase polypeptide gene, GALNT2, as a candidate gene for low HDL-C and high TG blood levels. As this is the first study exploring miR-binding SNPs in GALNT2, future research should examine the function of hsa-miR-1260, which is hypothesized to bind to rs16851339.
Although the results of a previous study demonstrated that LPL rs1059611 was associated with HDL-C and TG concentrations in the Chinese Han population [27], we found no relationship between this locus and lipid levels. Moreover, studies reported that rs1059611 influences plasma lipid concentrations and interacts with plasma n-6 PUFA to modulate lipid metabolism [28, 29], indicating the importance of this locus in lipid regulation.
Combined genetic risk of low HDL-C levels
In this study, pregnant women who carry more risk alleles had a greater risk for low HDL-C levels. Because individual variants can only explain a small part of clinical traits’ heritability, investigation into the combined influence of risk loci may improve genetic risk prediction for diseases [30, 31]. Some studies found evidence that combining multiple common genetic risk variants improves HDL-C predictions in non-pregnant populations [32–34]. In a study of Chinese genetic variants in lipid parameters and dyslipidemia, HDL-C levels decreased from 1.38 mmol/L for individuals carrying three or fewer risk alleles to 1.14 mmol/L for individuals carrying all eight risk alleles (MLXIPL rs17145738, LPLrs326, LIPC rs1800588 and CETP rs3764261) [35]. These results support our findings that HDL-C risk alleles have additive effects on lipid levels in pregnant Chinese women. However, there were still inconsistent results, which demonstrate the lack of an association between the combined risk allele score of relative genes for HDL-C (SORT1, GCKR, LPL, APOA1, CETP, LDLR, APOE) and the HDL-C concentration [36].
There are some limitations in the present study. When we analyzed the association between HDL-C level and SNPs, we did not correct for some confounding factors, including hormone levels, especially estrogen, progesterone, and insulin, or changes in life-style, such as less physical exercise during pregnancy, which may greatly influence the results. Additionally, only common variants related to HDL-C were examined, however, more SNPs with relatively low frequencies but important function need to be included. Moreover, the limited sample size may not possess sufficient power to find the related SNPs with small effects on HDL-C.
MATERIALS AND METHODS
Ethics statement
The study’s protocol was approved by the local Ethics Committee of Peking Union Medical College Hospital, and written informed consent was obtained from each participant.
Subjects
During the period of 2006 to 2011, we recruited a total of 1,884 participants among outpatients attending the Endocrinology Clinics of Peking Union Medical College Hospital, Beijing, China, including 594 women with GDM. Participants who had previously been diagnosed with hyperlipidemia, preeclampsia, hypertension, or severe systemic disease, or had been prescribed medications affecting lipid metabolism were excluded from the study. Levels of serum glucose, insulin, and lipids (including TG, total cholesterol, LDL-C, and HDL-C) were measured in the pregnant women between 24 and 28 weeks of gestation.
SNP selection
SNPs were selected according to the following 2 steps: 1) the selection of common HDL-C related loci: We selected genes containing SNPs associated with HDL-C levels (as shown in GWAS). First, the top five of these loci with the smallest p values were selected. Then, four (locating at 4 different gene) of the five SNPs with a minor allele frequency (MAF) >5% in the Chinese Han population were identified based on the 1000 genomes browser (http://www.1000genomes.org/), including rs3764261 (CETP), rs1532085 (LIPC), rs7241918 (LIPG) and rs1883025 (ABCA1). 2) the selection of miR-binding SNPs: Four genes mentioned above and additional 25 genes that had a statistically significant correlation with more than two serum lipid levels (including HDL-C) were included [37]. A total of 25 genes were analyzed further for the presence of potential miR-binding SNPs. To investigate SNPs in miRNA-binding sites, we used four miRNA target prediction software packages, miRanda (http://www.microrna.org), TargetScan (http://www.targetscan.org/), SNP Function Prediction (https://snpinfo.niehs.nih.gov/), and miRDB (http://mirdb.org/). Only SNPs predicted to have concordant effects on miRNA-binding based on predictions by at least two software packages were chosen. After excluding loci with MAF < 5%, based on the NCBI dbSNP database (http://www.ncbi.nlm.nih.gov/snp/), three SNPs potentially located in miRNA-binding sites of all the 25 candidate genes were included. These loci were in the 3’UTR of nearby genes, APOC3 (rs4225), LPL (rs1059611), and GALNT2 (rs16851339). Thus a total of 7 SNPs (4 from step 1 and 3 from step 2) were ultimately selected to our study. The selection procedure was shown in Figure 2.
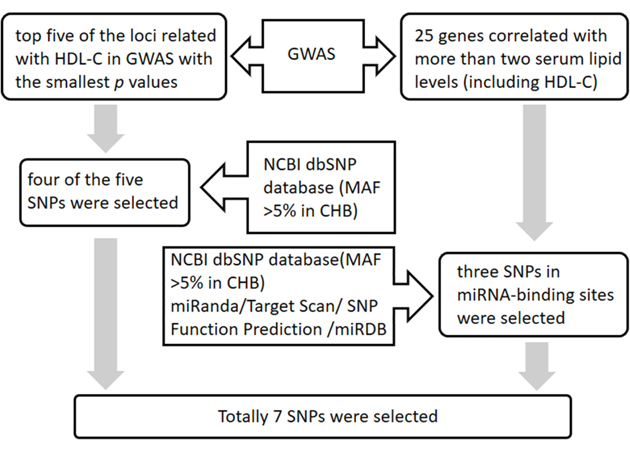
Figure 2: The flowchart of the SNP selection procedure.
DNA extraction and genotyping
Total genomic DNA was extracted from whole blood samples obtained from subjects using a Qiagen blood DNA mini kit (QIAGEN, Germany). DNA samples were diluted to a final concentration of 20-50 ng/uL and stored at -20°C. Genotyping was performed using the SequenomMassARRAY (Agena Bioscience, USA). As a genotyping quality-control measure, a second round of analysis was performed on 10% of the samples, which were randomly selected. All replicate assay results were in complete accordance with the original analysis. The genotyping success rates were 96.1%, 95.8%, 96.3%, 96.3%, 97.1%, 96.1% and 97.3% for rs3764261, rs1532085, rs7241918, rs1883025, rs4225, rs1059611 and rs16851339, respectively.
Statistical analysis
All quantitative variables in this study were non-normally distributed and expressed as median and interquartile range and nonparametric tests were used to analyze differences between groups. Three types of genotype in specific locus were given codes of 0, 1, and 2 (A1A1 vs A1A2 vs A2A2) and a multiple linear regression model was used to investigate the individual effect of these genes on serum lipid levels during pregnancy, after adjusting for age, gestational week, pre-pregnancy BMI and state of GDM or HOMAIR. The regression coefficients (b) with 95% confidence intervals (CIs) are presented. To explore the compound effects of multiple risk alleles on HDL-C, data of which were normal distribution after splitting into three groups, subjects were classified into one of the groups, which were given codes of 1, 2, and 3 (corresponding to 0-2, 3-5, and 6-8 risk alleles, respectively) and comparisons between groups were tested by One - Way ANOVA analysis and LSD test.
A two-tailed P value < 0.05 was considered statistically significant. Hardy-Weinberg equilibrium of the genotypes for each SNP was tested using a Chi-square test.
Statistical analyses were performed using SPSS software version 20.0.
Abbreviations
HDL-C: high-density lipoprotein-cholesterol; GWAS: genome-wide association studies; FPG: fasting plasma glucose; LDL-C: low-density lipoprotein-cholesterol; TG: triglyceride; CHD: coronary heart disease; SNP: single-nucleotide polymorphism; miRNA: microRNA; 3’UTR: 3’-untranslated region; miR-binding-SNP: SNP in miRNA-binding site; MAF: minor allele frequency; PCR: polymerase chain reaction; SAP: Shrimp alkaline phosphatase; CI: confidence interval; PAGE: Population Architecture using Genomics and Epidemiology; AMD: age-related macular degeneration; OR: odds ratio.
Author contributions
Conceived and designed the experiments: MN. Performed the experiments: MC, MN, WL, LM, FP, JL, XW, JM, XW. Analyzed the data: MN, MC. Wrote the paper: MC, MN.
ACKNOWLEDGMENTS
We thank all the participants of this research.
CONFLICTS OF INTEREST
The authors have no conflicts of interest to disclose.
FUNDING
This study was supported by grants from the Project of National Natural Science Foundation of China (No. 81270879) and National Key Program of Clinical Science (WBYZ2011-873).
REFERENCES
1. Mazurkiewicz JC, Watts GF, Warburton FG, Slavin BM, Lowy C, Koukkou E. Serum lipids, lipoproteins and apolipoproteins in pregnant non-diabetic patients. J Clin Pathol. 1994; 47:728-731.
2. Saarelainen H, Laitinen T, Raitakari OT, Juonala M, Heiskanen N, Lyyra-Laitinen T, Viikari JS, Vanninen E, Heinonen S. Pregnancy-related hyperlipidemia and endothelial function in healthy women. Circ J. 2006; 70:768-772.
3. El KN, Sanad ZF, Saleh SA, Shabana AA, Elhalaby AF, Badr EE. Value of first-trimester serum lipid profile in early prediction of preeclampsia and its severity: a prospective cohort study. Hypertens Pregnancy. 2016; 35:73-81. doi:10.3109/10641955.2015.1115060.
4. Gobl CS, Handisurya A, Klein K, Bozkurt L, Luger A, Bancher-Todesca D, Kautzky-Willer A. Changes in serum lipid levels during pregnancy in type 1 and type 2 diabetic subjects. Diabetes Care. 2010; 33:2071-2073. doi:10.2337/dc10-0484.
5. Ye K, Bo QL, Du QJ, Zhang D, Shen Y, Han YP, Li YB, Li Y, Hu CL, Li L. Maternal serum lipid levels during late pregnancy and neonatal body size. Asia Pac J Clin Nutr. 2015; 24:138-143.
6. Kaess B, Fischer M, Baessler A, Stark K, Huber F, Kremer W, Kalbitzer HR, Schunkert H, Riegger G, Hengstenberg C. The lipoprotein subfraction profile: heritability and identification of quantitative trait loci. J Lipid Res. 2008; 49:715-723. doi:10.1194/jlr.M700338-JLR200.
7. Callegari SB, de Resende EA, Barbosa NO, Rodrigues VJ, de Oliveira EM, Borges MF. [Obesity and cardiometabolic risk factors during pregnancy]. [Article in Portugese]. Rev Bras Ginecol Obstet. 2014; 36:449-455.
8. Teslovich TM, Musunuru K, Smith AV, Edmondson AC, Stylianou IM, Koseki M, Pirruccello JP, Ripatti S, Chasman DI, Willer CJ, Johansen CT, Fouchier SW, Isaacs A, et al. Biological, clinical and population relevance of 95 loci for blood lipids. Nature. 2010; 466:707-713. doi:10.1038/nature09270.
9. Flaquer A, Rospleszcz S, Reischl E, Zeilinger S, Prokisch H, Meitinger T, Meisinger C, Peters A, Waldenberger M, Grallert H, Strauch K. Mitochondrial GWA analysis of lipid profile identifies genetic variants to be associated with HDL cholesterol and triglyceride levels. PLoS One. 2015; 10:e126294. doi:10.1371/journal.pone.0126294.
10. Lange LA, Willer CJ, Rich SS. Recent developments in genome and exome-wide analyses of plasma lipids. Curr Opin Lipidol. 2015; 26:96-102. doi:10.1097/MOL.0000000000000159.
11. Zhou L, He M, Mo Z, Wu C, Yang H, Yu D, Yang X, Zhang X, Wang Y, Sun J, Gao Y, Tan A, He Y, et al. A genome wide association study identifies common variants associated with lipid levels in the Chinese population. PLoS One. 2013; 8:e82420. doi:10.1371/journal.pone.0082420.
12. Zhang Z, Tao L, Chen Z, Zhou D, Kan M, Zhang D, Li C, He L, Liu Y. Association of genetic loci with blood lipids in the Chinese population. PLoS One. 2011; 6:e27305. doi:10.1371/journal.pone.0027305.
13. Lewis BP, Burge CB, Bartel DP. Conserved seed pairing, often flanked by adenosines, indicates that thousands of human genes are microRNA targets. Cell. 2005; 120:15-20. doi:10.1016/j.cell.2004.12.035.
14. Nossent AY, Hansen JL, Doggen C, Quax PH, Sheikh SP, Rosendaal FR. SNPs in microRNA binding sites in 3'-UTRs of RAAS genes influence arterial blood pressure and risk of myocardial infarction. Am J Hypertens. 2011; 24:999-1006. doi:10.1038/ajh.2011.92.
15. Ciccacci C, Di Fusco D, Cacciotti L, Morganti R, D'Amato C, Greco C, Rufini S, Novelli G, Sangiuolo F, Spallone V, Borgiani P. MicroRNA genetic variations: association with type 2 diabetes. Acta Diabetol. 2013; 50:867-872. doi:10.1007/s00592-013-0469-7.
16. Homma H, Kurachi H, Nishio Y, Takeda T, Yamamoto T, Adachi K, Morishige K, Ohmichi M, Matsuzawa Y, Murata Y. Estrogen suppresses transcription of lipoprotein lipase gene. Existence of a unique estrogen response element on the lipoprotein lipase promoter. J Biol Chem. 2000; 275:11404-11411.
17. Duncan KG, Hosseini K, Bailey KR, Yang H, Lowe RJ, Matthes MT, Kane JP, LaVail MM, Schwartz DM, Duncan JL. Expression of reverse cholesterol transport proteins ATP-binding cassette A1 (ABCA1) and scavenger receptor BI (SR-BI) in the retina and retinal pigment epithelium. Br J Ophthalmol. 2009; 93:1116-1120. doi:10.1136/bjo.2008.144006.
18. Dumitrescu L, Carty CL, Taylor K, Schumacher FR, Hindorff LA, Ambite JL, Anderson G, Best LG, Brown-Gentry K, Buzkova P, Carlson CS, Cochran B, Cole SA, et al. Genetic determinants of lipid traits in diverse populations from the population architecture using genomics and epidemiology (PAGE) study. PLoS Genet. 2011; 7:e1002138. doi:10.1371/journal.pgen.1002138.
19. Chapman MJ, Le Goff W, Guerin M, Kontush A. Cholesteryl ester transfer protein: at the heart of the action of lipid-modulating therapy with statins, fibrates, niacin, and cholesteryl ester transfer protein inhibitors. Eur Heart J. 2010; 31:149-164. doi:10.1093/eurheartj/ehp399.
20. Walia GK, Gupta V, Aggarwal A, Asghar M, Dudbridge F, Timpson N, Singh NS, Kumar MR, Kinra S, Prabhakaran D, Reddy KS, Chandak GR, Smith GD, et al. Association of common genetic variants with lipid traits in the Indian population. PLoS One. 2014; 9:e101688. doi:10.1371/journal.pone.0101688.
21. Nakamura A, Niimura H, Kuwabara K, Takezaki T, Morita E, Wakai K, Hamajima N, Nishida Y, Turin TC, Suzuki S, Ohnaka K, Uemura H, Ozaki E, et al. Gene-gene combination effect and interactions among ABCA1, APOA1, SR-B1, and CETP polymorphisms for serum high-density lipoprotein-cholesterol in the Japanese population. PLoS One. 2013; 8:e82046. doi:10.1371/journal.pone.0082046.
22. Radovica I, Fridmanis D, Vaivade I, Nikitina-Zake L, Klovins J. The association of common SNPs and haplotypes in CETP gene with HDL cholesterol levels in Latvian population. PLoS One. 2013; 8:e64191. doi:10.1371/journal.pone.0064191.
23. Guo S, Hu Y, Ding Y, Liu J, Zhang M, Ma R, Guo H, Wang K, He J, Yan Y, Rui D, Sun F, Mu L, et al. Association between eight functional polymorphisms and haplotypes in the cholesterol ester transfer protein (CETP) gene and dyslipidemia in national minority adults in the far west region of China. Int J Environ Res Public Health. 2015; 12:15979-15992. doi:10.3390/ijerph121215036.
24. Ma L, Ballantyne C, Brautbar A, Keinan A. Analysis of multiple association studies provides evidence of an expression QTL hub in gene-gene interaction network affecting HDL cholesterol levels. PLoS One. 2014; 9:e92469. doi:10.1371/journal.pone.0092469.
25. Pecks U, Rath W, Kleine-Eggebrecht N, Maass N, Voigt F, Goecke TW, Mohaupt MG, Escher G. Maternal serum lipid, estradiol, and progesterone levels in pregnancy, and the impact of placental and hepatic pathologies. Geburtshilfe Frauenheilkd. 2016; 76:799-808. doi:10.1055/s-0042-107078.
26. Hu SL, Cui GL, Huang J, Jiang JG, Wang DW. An APOC3 3'UTR variant associated with plasma triglycerides levels and coronary heart disease by creating a functional miR-4271 binding site. Sci Rep. 2016; 6:32700. doi:10.1038/srep32700.
27. Mo X, Liu X, Wang L, Li H, Lu X, Huang J, Chen J, Cao J, Li J, Chen S, Tang Y, Peng X, Gu D. Lipoprotein lipase gene polymorphism rs1059611 functionally influences serum lipid concentrations. Atherosclerosis. 2013; 229:511-516. doi:10.1016/j.atherosclerosis.2013.05.005.
28. Garcia-Rios A, Delgado-Lista J, Perez-Martinez P, Phillips CM, Ferguson JF, Gjelstad IM, Williams CM, Karlstrom B, Kiec-Wilk B, Blaak EE, Lairon D, Planells R, Malczewska-Malec M, et al. Genetic variations at the lipoprotein lipase gene influence plasma lipid concentrations and interact with plasma n-6 polyunsaturated fatty acids to modulate lipid metabolism. Atherosclerosis. 2011; 218:416-422. doi:10.1016/j.atherosclerosis.2011.07.092.
29. Ghanbari M, Franco OH, de Looper HW, Hofman A, Erkeland SJ, Dehghan A. Genetic variations in microRNA-binding sites affect microRNA-mediated regulation of several genes associated with cardio-metabolic phenotypes. Circ Cardiovasc Genet. 2015; 8:473-486. doi:10.1161/CIRCGENETICS.114.000968.
30. Chatterjee N, Wheeler B, Sampson J, Hartge P, Chanock SJ, Park JH. Projecting the performance of risk prediction based on polygenic analyses of genome-wide association studies. Nat Genet. 2013; 45:400-405, 401e-405e. doi:10.1038/ng.2579.
31. Isaacs A, Willems SM, Bos D, Dehghan A, Hofman A, Ikram MA, Uitterlinden AG, Oostra BA, Franco OH, Witteman JC, van Duijn CM. Risk scores of common genetic variants for lipid levels influence atherosclerosis and incident coronary heart disease. Arterioscler Thromb Vasc Biol. 2013; 33:2233-2239. doi:10.1161/ATVBAHA.113.301236.
32. Buscot MJ, Magnussen CG, Juonala M, Pitkanen N, Lehtimaki T, Viikari JS, Kahonen M, Hutri-Kahonen N, Schork NJ, Raitakari OT, Thomson RJ. The combined effect of common genetic risk variants on circulating lipoproteins is evident in childhood: a longitudinal analysis of the cardiovascular risk in young finns study. PLoS One. 2016; 11:e146081. doi:10.1371/journal.pone.0146081.
33. Kanoni S, Masca NG, Stirrups KE, Varga TV, Warren HR, Scott RA, Southam L, Zhang W, Yaghootkar H, Muller-Nurasyid M, Couto AA, Strawbridge RJ, Lataniotis L, et al. Analysis with the exome array identifies multiple new independent variants in lipid loci. Hum Mol Genet. 2016; 25:4094-4106. doi:10.1093/hmg/ddw227.
34. Hodoglugil U, Williamson DW, Mahley RW. Polymorphisms in the hepatic lipase gene affect plasma HDL-cholesterol levels in a Turkish population. J Lipid Res. 2010; 51:422-430. doi:10.1194/jlr.P001578.
35. Liu Y, Zhou D, Zhang Z, Song Y, Zhang D, Zhao T, Chen Z, Sun Y, Zhang D, Yang Y, Xing Q, Zhao X, Xu H, et al. Effects of genetic variants on lipid parameters and dyslipidemia in a Chinese population. J Lipid Res. 2011; 52:354-360. doi:10.1194/jlr.P007476.
36. Meroufel DN, Mediene-Benchekor S, Lardjam-Hetraf SA, Ouhaibi-Djellouli H, Boulenouar H, Hamani-Medjaoui I, Hermant X, Saidi-Mehtar N, Amouyel P, Houti L, Meirhaeghe A, Goumidi L. Associations of common SNPs in the SORT1, GCKR, LPL, APOA1, CETP, LDLR, APOE genes with lipid trait levels in an Algerian population sample. Int J Clin Exp Pathol. 2015; 8:7358-7363.
37. Willer CJ, Schmidt EM, Sengupta S, Peloso GM, Gustafsson S, Kanoni S, Ganna A, Chen J, Buchkovich ML, Mora S, Beckmann JS, Bragg-Gresham JL, Chang HY, et al. Discovery and refinement of loci associated with lipid levels. Nat Genet. 2013; 45:1274-1283. doi:10.1038/ng.2797.