
INTRODUCTION
Glioblastoma (GBM) is a highly aggressive and the most prevalent primary brain tumour in adults. GBM has a dismal outcome, the median survival is typically less than 2 years [1]. The current treatment consists of maximal surgical resection of the tumour followed by concurrent chemo- (TMZ, temozolomide) and radiation therapy (RT) [2]. Despite extensive efforts to improve treatment, GBM is still resistant to current postoperative therapies making GBM a compelling field of cancer research [3]. Improving the outcome requires novel diagnostic approaches and effective treatment strategies [4].
The biological basis of the resistance involves many factors, including molecular heterogeneity, and impaired DNA repair mechanisms. Currently, targeting the poly(ADP-ribose) polymerase 1 (PARP1) DNA repair protein in GBM is a new and promising aspect in clinical trials [5]. PARP1 is a nuclear protein, and is normally involved in DNA repair and the maintenance of genomic stability [6]. PARP1 binds to DNA strand breaks and produces a poly (ADP-ribose) chain from NAD+ substrate which signals the cell to initiate DNA damage repair. The role of PARP1 has been already investigated in brain diseases [7, 8], and its overexpression has been reported in various tumour types, such as breast, ovary, skin, colorectum, lung and brain [9–11]. Upregulated PARP1 can enhance the anti-apoptotic property of tumours resulting in resistance to DNA damaging therapeutic agents [12]. PARP inhibitors (PARPi) sensitize tumour cells to radiotherapy and to chemotherapeutic agents. The inhibitors attach to the catalytic domain of the protein thereby blocking synthesis of ADP-ribose polymers. Consequently, the cellular responses to DNA damage do not occur, leading to cell death [6].
Although all GBMs share common histological features, they individually vary at their molecular level resulting in significant differences in terms of prognosis and response to treatment [13]. In the last decade, numerous high-scale genomic profiling studies were performed to elucidate the biology of GBM. In addition, large scale functional proteomics studies were performed, where ENCODE software developments were used to integrate RNA-Seq and its correlation to protein expression, and regulation in GBM patients [14, 15]. The proteogenomic initiative runs as a HUPO (www.HUPO.org) disease initiative, recently reported on [16]. In a comprehensive analysis by The Cancer Genome Atlas (TCGA) project, dysregulation of p53, Rb and receptor tyrosine kinase pathways were identified [17]. Recently, several glioma lineage and GBM subtype specific molecular alterations were described, indicating a diversity amid similar histological types. The identification of isocitrate dehydrogenase 1 and 2 (IDH1 and IDH2) mutations was a breakthrough in the field of GBM research. Soon after it became an important diagnostic and prognostic marker in gliomas [18]. To date, GBM can be divided into IDH-wildtype and mutant based on their IDH status [19]. Furthermore, IDH1 together with Alpha Thalassemia/Mental Retardation Syndrome X-linked (ATRX) and TP53 status are reliable diagnostic and prognostic markers for the astrocytoma lineage and they are also relevant in GBM stratification. Beyond that, GBM was further divided into four molecular subtypes: Classical (CL), Mesenchymal (ME), Proneural (PN) and Neural (NE), based on their chromosomal structural alterations, copy number alterations (CNAs), point mutation status and gene expression profiles [20–22].
Although the efficiency of PARP1 inhibition was already established in GBM, its molecular characteristics and prognostic role regarding molecular heterogeneity is not fully understood. The aim of our study is to analyse the role of PARP1 using the latest genomic datasets of the TCGA, and an independent clinical cohort (Figure 1). To the best of our knowledge, we hereby present the first comprehensive study that evaluate I) PARP1 CNAs and mRNA expressions, II) its usefulness in GBM subtype prognosis, and III) the associations of PARP1 with specific astrocytoma molecular markers. Finally, IV) we demonstrate a close link between PARP1 and TP53 that can serve as a prognostic and diagnostic marker for GBM.
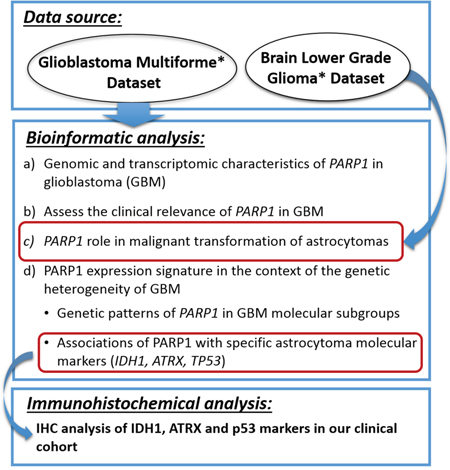
Figure 1: The overview of the analysis strategy for PARP1 characterisation used in this study.
RESULTS
Genomic and transcriptomic characteristics of PARP1 in GBM
We first analysed PARP1 mutations and copy numbers of GBM specimens in the TCGA database via cBioPortal (http://www.cbioportal.org/public-portal/). Only two PARP1 somatic mutations were observed (V948I and A709T) in GBM. Information on CNA data was available for 562 GBM samples. PARP1 exhibited a low-level gain and heterozygous deletions in more than 14% and 6% of the cases, respectively. On the other hand, PARP1 amplification was infrequent (0.35%), however homozygous deletion was not observed.
Next, we examined the relative PARP1 mRNA levels in GBM. The database included 135 adult GBM cases with DNA sequencing, CNAs and mRNA expression data according to the screening criteria detailed in Materials and Methods. In addition, an increased expression was observed (z-score ≥1) in 20.74% (28/135) of the cases.
Lastly, for determining the possible regulation mechanisms associated with PARP1 expression values, we evaluated the correlation between CNAs and mRNA levels. A significant expression difference was found between heterozygous deletion and diploid (p=0.005), gain and diploid (p<0.001), as well as heterozygous deletion and gain statuses (p<0.001). These results demonstrate a close link between the copy number and gene expression (Figure 2A).
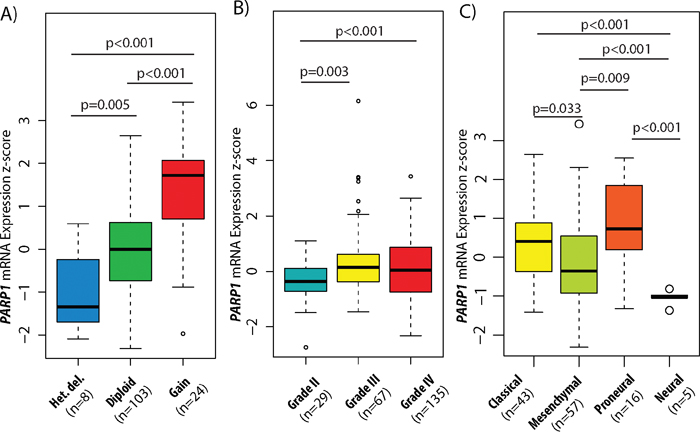
Figure 2: PARP1 copy number and expression levels in GBM subtypes and glioma WHO grades. Association between copy number alterations (CNAs) and mRNA expressions of PARP1 in GBM (A). PARP1 mRNA expression level z-scores in different grades of astrocytomas (B) and in GBM subtypes (C). The TCGA glioblastoma multiforme (WHO grade IV) & brain lower grade glioma (WHO grade II & III) TCGA datasets were used for the analysis.
PARP1 levels are increased in higher grade astrocytomas
To examine the significance of PARP1 in malignant transformation of astrocytomas, the Brain Lower Grade Glioma (TCGA, Provisional) dataset was investigated through cBioPortal. Altogether, CNA data of 169 lower grade tumours (55 grade II and 114 grade III astrocytomas) were added to the 562 GBM samples. We found, that grade II tumours have the lowest CNA rate (0.036) followed by grade III astrocytomas (0.167) and grade IV GBM (0.215), and high PARP1 copy numbers correlate with higher histological grades (p<0.001) (Supplementary Figure 1). Homozygous deletions occurred in only 0.1% of the grade II tumours. PARP1 amplification was also rare, found in only 0.3% of GBMs. In total, mRNA expression data were available for 97 lower-grade astrocytomas (29 grade II and 67 grade III tumours). Increased PARP1 mRNA levels were found in the high-grade tumours as opposed to grade II astrocytomas (GII vs. GIII, p=0.003, and GII vs. GIV, p<0.001). Although PARP1 expression was increased in both grade III and IV tumours, there were no significant changes between those two grades (Figure 2B). PARP1 CNAs showed significant differences in distribution among WHO grades (p<0.001).
Mutation status of ATRX and TP53 genes are associated with PARP1 expressions
We evaluated the PARP1 expression signature in the context of the genetic heterogeneity of GBM. We analysed the association between PARP1 levels and the mutation status of astrocytoma lineage specific genes such as IDH1, ATRX and TP53. We discovered that samples carrying mutated ATRX (p=0.006) and TP53 (p=0.015) were associated with higher PARP1 expression levels (Table 1). The IDH status of GBMs did not show any association with PARP1 expression. The TCGA dataset contains only the IDH and ATRX status of the tumours (Table 2). To examine the association between PARP1 and TP53 status, cases were classified into wildtype (n=92) and mutant TP53 (n=43) tumours. Next, mutant TP53 samples were further divided into missense (n=33) and null (n=10) mutations in order to investigate the mutation effects on PARP1 expressions (Figure 3A, Table 2). PARP1 mRNA expression was higher in TP53 mutated cases (p=0.015) than in its wildtype counterpart. Importantly, there was no significant changes between missense and null TP53 mutations (Figure 3B).
Table 1: Correlations between the mRNA expressions of PARP1 and key molecular glioma markers
Key glioma markers |
N |
Mean |
± SE1 |
p-Value |
95% CI2 |
|
|---|---|---|---|---|---|---|
Lower |
Upper |
|||||
ATRX status |
|
|
|
|
|
|
Wild-type |
128 |
0.130 |
0.103 |
0.006 |
-2.124 |
-0.367 |
Mutant |
7 |
1.375 |
0.271 |
|
|
|
IDH status |
|
|
|
|
|
|
Wild-type |
127 |
0.158 |
0.104 |
0.151 |
-1.457 |
0.228 |
Mutant |
8 |
0.772 |
0.369 |
|
|
|
TP53 status |
|
|
|
|
|
|
Wild-type |
92 |
0.028 |
0.118 |
0.015 |
-0.943 |
-0.101 |
Mutant |
43 |
0.550 |
0.182 |
|
|
|
(Significant p-values are marked in bold.)
1Standard error; 2confidence of interval.
Table 2: Patient characteristics with available sequencing, CNA, and mRNA expression data
|
Brain lower grade glioma (TCGA, provisional) (n=97) |
Glioblastoma multiforme (TCGA, provisional) (n=135) |
|---|---|---|
Diagnosis age (years) |
|
|
|
42.31 ± 13.14 |
60.59±13.48 |
|
(range: 20-74) |
(range: 21-89) |
Overall survival (months) |
|
|
|
24.76 ± 22.17 |
13.33 ± 12.64 |
Sex |
|
|
Female |
42 |
45 |
Male |
55 |
90 |
WHO grade1 |
|
|
II |
29 |
- |
III |
67 |
- |
IV |
- |
135 |
ATRX status |
|
|
Mutant |
45 |
7 |
Wild-type |
52 |
128 |
IDH status |
|
|
Mutant |
66 |
8 |
Wild-type |
31 |
127 |
TP53 status |
|
|
Missense mut. |
51 |
33 |
Null mut. |
14 |
10 |
Wild-type |
32 |
92 |
1WHO grade was unknown in one sample.
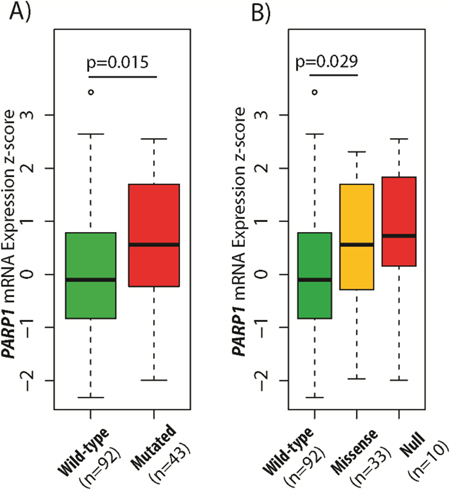
Figure 3: Association between TP53 gene status and PARP1 mRNA expression in glioblastoma. PARP1 mRNA expression was higher in mutated TP53 cases (A), but only missense TP53 mutations showed significant difference compared to wild-type TP53 (B). The TCGA glioblastoma multiforme, provisional dataset was used for the analysis.
Immunohistochemical expression of PARP1 is correlated with ATRX and p53
We immunohistochemically studied PARP1 in a series of GBMs to evaluate its potential differential expression in association with key markers at protein levels. PARP1 staining was primarily localized in the nucleus of tumour cells, consistent with previous studies [11] (Figure 4). Ninety percent (54/60) of all cases were PARP1 positive, while 10% (6/60) were negative. The relationships between PARP1 and ATRX, IDH1 and p53, respectively, were also evaluated. In our clinical cohort, PARP1 IHC expression was significantly associated with the expression of p53 (p=0.0281) and ATRX (p=0.002) but not with that of IDH1 (Table 3).
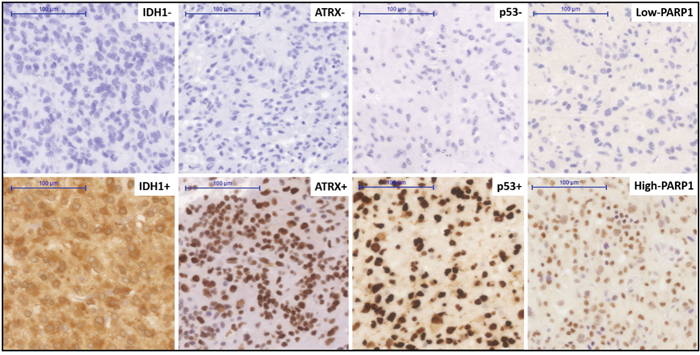
Figure 4: Immunohistochemical staining pattern for various markers in a clinical cohort of glioblastoma. Immunohistochemical positive and negative staining for IDH1R132H, positive and negative staining patterns of ATRX and p53, high and low nuclear expression of the PARP1. Original magnification: x200. Scale bar: 100 μm.
Table 3: Immunohistochemical expression of PARP1 and its relationship with key molecular glioma markers
|
PARP1 IHC expression |
p-Value |
|
|---|---|---|---|
Negative |
Positive |
||
Sex |
|
|
|
Female |
2 |
28 |
0.3894 |
Male |
4 |
26 |
|
Age |
|
|
|
Mean ± SD* |
61.69 ± 6.45 |
58.52 ± 9.18 |
0.415 |
p53 expression |
|
|
|
Negative |
4 |
13 |
0.0281 |
Positive |
2 |
41 |
|
IDH1 expression |
|
|
|
Negative |
6 |
52 |
0.6316 |
Positive |
0 |
2 |
|
ATRX expression |
|
|
|
Negative |
3 |
4 |
0.0020 |
Positive |
3 |
50 |
|
(Significant p-values are marked in bold).
*Standard deviation.
PARP1 mRNA levels are increased in PN and CL GBM subtypes
In the exploration of the subtype-specific role of PARP1 in GBM, we identified that PN and CL subtypes showed an increased PARP1 expression (Figure 2C). More specifically, PN (mean z-score: 0.801) and CL (mean z-score: 0.375) subtypes have the highest average PARP1 mRNA level, followed by ME (mean z-score: -0.121) and NE (mean z-score: -1.049), respectively.
Simultaneously, we also assessed whether PARP1 CNAs were related to specific GBM subtypes. CNAs information on transcriptional subtypes were available for 475 cases. We found that the PN subtype had the highest CNA rate (0.275), followed by the ME (0.226), NE (0.224), and CL (0.129) subtypes. PARP1 copy number gains were observed in all subtypes: ME (4.4%), PN (4.4%), CL (2.9%) and NE (2.3%). Heterozygous deletion of PARP1 was found in 3.4% of ME GBMs. PARP1 amplification occurred only in CL and ME subtypes (0.2-0.2%) (Supplementary Figure 2).
High PARP1 expression is associated with shorter survival in CL GBM subtype
To assess the clinical relevance of PARP1 in GBM, we examined the association between PARP1 mRNA expression and the overall survival in TCGA GBM samples. The mean overall survival (OS) of the TCGA patients was 13.3 months. GBM cases were assigned into PARP1-high (n=68) and PARP1-low (n=67) groups, using median PARP1 mRNA expression z-score as cut off value. Although patients with PARP1-low expression had longer survival, there were no statistically significant differences observed between the groups (Figure 5A).
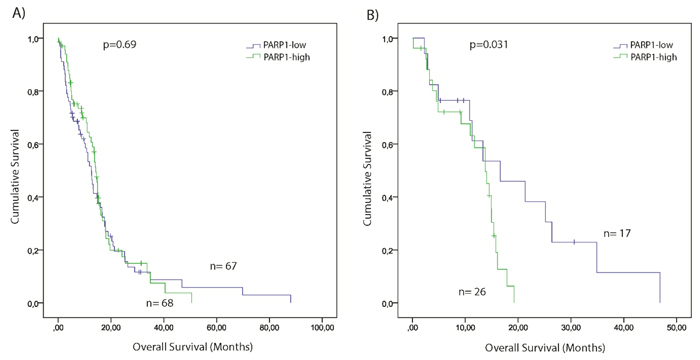
Figure 5: Kaplan–Meier plot of overall survival (OS) stratified by high and low PARP1 mRNA expression in GBM (A) and in Classical GBM subgroup (B). The TCGA glioblastoma multiforme, provisional dataset was used for the analysis. (Significance was assessed by the log-rank method.)
The mean OS of TCGA patients across different GBM subtypes was the following: CL=12.7; PN=19.8; ME=11.7, and NE=7.7 months. Kaplan-Meier survival analysis indicated that patients of the PARP1-low group had statistically significant shorter overall survival time compared with their PARP1-high counterpart (p=0.031) (Figure 5B). No significant differences were noted in the survival values between the PARP1-low, and -high expression cohorts of other GBM subtypes.
We also investigated whether PARP1’s genetic signatures were related to the clinicopathological characteristics of GBM patients. No significant associations were observed between PARP1 status and age and sex (Table 3).
High PARP1 level together with wildtype TP53 predict a shorter survival in GBM
We analysed cumulative effects of p53 and PARP1 on survival with GBM. TCGA samples were further classified according to their PARP1 levels and TP53 mutation status: I) TP53mut/PARP1-high (n=29); II) TP53mut/PARP1-low (n=14); III) TP53WT/PARP1-high (n=39); and IV) TP53WT/PARP1-low (n=53). We found, that GBM patients with wild-type TP53 gene and PARP1-high level have a shorter survival (p=0.039) compared to the other groups (Figure 6).
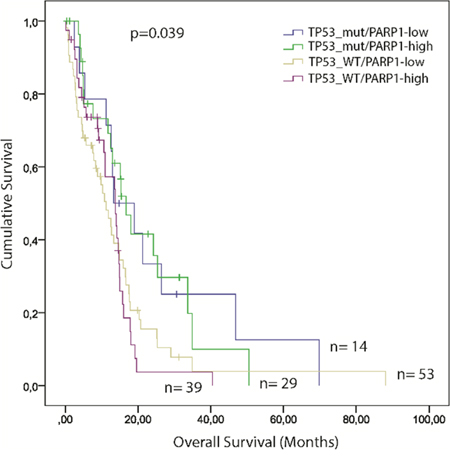
Figure 6: Kaplan–Meier plot of overall survival (OS) stratified by the combination of high and low PARP1 mRNA expression and TP53 mutation status in GBM. The TCGA glioblastoma multiforme, provisional dataset was used for the analysis. (Significance was assessed by the log-rank method.)
PARP1 status is associated with the p53 pathway
To extend our investigations, the relationship between PARP1 status and the p53 pathway (CDKN1A (p21), MDM2, MDM4, CDKN2A (p14), and TP53BP1) was also examined. Regarding mRNA expressions, PARP1 displayed significant correlation with TP53, CDKN1A, and TP53BP1 (Table 4, Figure 7A). Accordingly, mRNA expression levels of TP53 (p=0.003), and TP53BP1 (p=0.004) were increased in PARP1-high, and CDKN1A (p=0.009) was increased in PARP1-low GBMs (Table 5, Figure 8). PARP1 levels showed correlation with copy number alterations of CDKN2A and MDM4 genes (Figure 7B). More specifically, PARP1 levels were decreased in homozygously deleted CDKN2A (p=0.013) cases, and increased in cases with MDM4 gain (p=0.026) when we compared CNAs to the diploid variants of the genes. However, there was no significant association between MDM2 CNAs and PARP1.
Table 4: Relationship between mRNA expressions of PARP1 and components of the p53 pathway
Genes |
Kendall's tau b |
Spearman's rho |
||
|---|---|---|---|---|
Cor. coef. |
p-Value |
Cor. coef. |
p-Value |
|
CDKN1A |
-0.187 |
0.001 |
-0.272 |
0.001 |
CDKN2A |
0.028 |
0.629 |
0.047 |
0.587 |
MDM2 |
-0.111 |
0.057 |
-0.168 |
0.051 |
MDM4 |
-0.003 |
0.953 |
-0.004 |
0.961 |
TP53 |
0.169 |
0.004 |
0.246 |
0.004 |
TP53BP1 |
0.162 |
0.005 |
0.230 |
0.007 |
(Significant p-values are marked in bold).
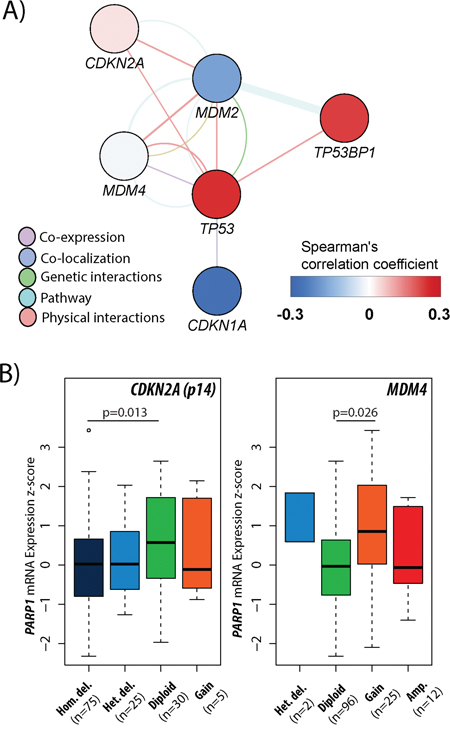
Figure 7: Association between PARP1 and p53 pathway in glioblastoma. A gene-gene interaction network presenting the correlation between PARP1 and the general members of p53 pathway in GBM according to mRNA expressions (A). The associations of PARP1 mRNA expression levels with CDKN2A and MDM4 copy number alterations in GBM (B). The TCGA glioblastoma multiforme, provisional dataset was used for the analysis.
Table 5: The impact of PARP1-low and high mRNA expression levels in the p53 pathway
Genes |
PARP1 levels1 |
p-Value |
± SE2 |
95% CI3 |
||
|---|---|---|---|---|---|---|
Low |
High |
Lower |
Upper |
|||
CDKN1A |
0.075 |
-0.227 |
0.009 |
0.113 |
0.077 |
0.526 |
CDKN2A |
-1.117 |
-1.029 |
0.560 |
0.151 |
-0.387 |
0.210 |
MDM2 |
2.363 |
5.240 |
0.310 |
2.819 |
-8.472 |
2.717 |
MDM4 |
0.614 |
2.366 |
0.310 |
1.718 |
-5.151 |
1.647 |
TP53 |
-0.278 |
0.225 |
0.003 |
0.164 |
-0.828 |
-0.178 |
TP53BP1 |
-0.520 |
-0.052 |
0.004 |
0.161 |
-0.787 |
-0.150 |
(Significant p-values are marked in bold.)
1Mean mRNA z-scores; 2standard error; 3confidence of interval.
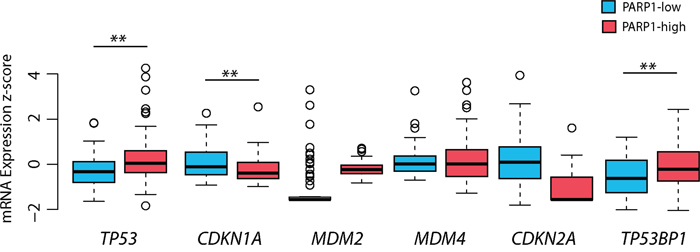
Figure 8: The impact of PARP1 levels on p53 pathway-related genes in glioblastoma. The mRNA expression of TP53 and TP53BP1 was increased in PARP1-high group, whereas CDKN1A (p21) mRNA expression was higher in PARP1-low group. The TCGA glioblastoma multiforme, provisional dataset was used for the analysis. Level of significance: * (p < 0.05), ** (p < 0.01), and *** (p < 0.001).
DISCUSSION
Glioblastoma is one of the most assiduously studied cancer, yet the majority of patients are still resistant to the conventional therapies [1]. Thus, the identification of novel biomarkers to improve the management of GBM is an ongoing and challenging task [4]. Although PARP1 inhibition is a potential therapeutic target in GBM [5], its efficiency in the context of heterogeneity is unknown. Therefore, we performed an integrated bioinformatic analysis to evaluate PARP1’s genetic signature, and prognostic role regarding the molecular diversity of the tumour. Moreover, the correlations between PARP1 and three routinely used glioma markers detected by IHC were also tested in a clinical GBM cohort.
PARP1 is overexpressed in a variety of cancers [7–9], including glioblastoma [23]. Increased PARP1 expression has been reported in paediatric high-grade astrocytomas, medulloblastoma, and ependymoma [24, 25]. Furthermore, in GBM stem cells (GSCs), the combination of PARPi and TMZ may represent a valuable strategy to reverse the stem cells’ chemo-resistance. Tentori et al. found, that PARPi together with TMZ exerted synergistic anti-tumour effects in eight out of ten GSC lines. Moreover, the dose reduction of TMZ is associated with the sensitivity of each cell line to PARPi as single agent [26]. Recent bioinformatic analysis of TCGA datasets revealed that PARP1 expression is restricted to higher grade tumours, and partially caused by genomic gain. Our findings underline that PARP1 is a marker candidate of higher-grade in astrocytomas, presumably because higher PARP1 expression facilitates the repair of damaged DNA and, thereby, overcomes the genetic instability characteristics of tumour cells [27].
Given this complex heterogeneous nature of GBM, it is relevant to investigate PARP1’s associations with key molecular markers [20, 21]. The importance of ATRX, IDH1, and TP53 mutations in the early development and the progression of astrocytic glioma lineage is well-known [21]. These markers also have treatment and prognostic relevance [21] and their mutation status can distinguish astrocytomas from oligodendrogliomas, as well as secondary from primary GBM [20]. PARP1 expression can occur in both IDH-wild type and mutated GBMs. Although there was no statistically proven association between PARP1 expression and IDH mutation status, a recent study reported that 2-hydroxyglutarate produced by mutated IDH induces PARP inhibitor sensitivity in patient-derived primary glioma cells and genetically matched tumour xenografts [28], which has therapeutic implications. On the other hand, higher PARP1 expression levels were tightly associated with ATRX and TP53 mutations. ATRX alterations occur in the vast majority of lower-grade astrocytomas and IDH1-mutated (secondary) GBMs [21]. Somatic mutations in TP53 play important roles in gliomas, particularly in the tumorigenesis of lower grade astrocytomas and IDH1-mutated GBMs [4]. Considering that the inhibition of PARP1 enzyme is dose-dependent [29], our results indicate that PARP inhibitors could be more effective in ATRX and TP53 mutated tumours, where PARP1 levels are usually increased.
Although high-throughput technologies are widely used for diagnostic purposes, there is still a need to improve the IHC-based stratification of GBM with the integration of molecular data [30]. Consistent with a previous study [23], PARP1 IHC expression was observed in the majority of clinical GBM cases. To date, the IHC detection of key molecular markers is possible and highly informative: I) using IDH1R132H mutation specific antibody [31]; II) most ATRX mutations result in undetectable ATRX expression by IHC [32]; and III) mutated p53 protein accumulates in the nucleus of tumour cells [33]. Furthermore, we have demonstrated that IHC expression of PARP1 has an inverse correlation with ATRX, and linear correlation with p53 staining. These observations suggest that PARP1 IHC expression along with p53 overexpression and ATRX loss can be promising predictive markers for PARPi in GBM.
This study investigates for the first time, to our knowledge, the genomic signature and prognostic significance of PARP1 in GBM subtypes. We hereby present evidence, that PARP1 can distinguish PN and CL from the other subtypes as increased PARP1 expression was increased in these two subtypes (Figure 2C). Our data showed that high PARP1 levels were associated with shorter survival in the CL group. It was previously presented that CL GBM is characterized by EGFR amplification and wild-type TP53, whereas PN is characterized by both IDH1 and TP53 mutations and PDGFRA amplification [22]. These results indicate that PARP1 and p53 are suitable markers to distinguish PN and CL subtypes, and have a prognostic relevance in GBM.
In our previous study, we demonstrated that p53 immunopositivity correlates with TP53 mutational status, except for certain mutation types [33]. In GBM, we found that PARP1 IHC expression is correlated with p53 positive cases. In addition, PAPR1 mRNA levels were higher in samples with TP53 mutations. Importantly, the detection of TP53 null mutations is not accurate by IHC due to the truncated protein [33]. Beside the increased PARP1 levels in TP53 mutated cases, there was no statistical difference between missense and null mutated samples.
Both PARP1 and p53 play important roles in maintaining genomic integrity [34, 35]. Several studies have shown that genomic instability is usually correlated with poor prognosis [17, 36]. It has been previously reported that high level of PARP1 expression is often associated with poor overall survival in cancer [12]. Although there is a trend towards shorter survival of PARP1-high patients as compared to PARP1-low patients, no significant differences were observed when all GBMs were considered. Interestingly, we found a significantly shorter survival in PARP-high patients with wildtype TP53 gene (Figure 6) – possibly because not only TP53 mutations but also an impaired p53 pathway can facilitate tumour progression [37]. The p53 signalling pathway mediates several cellular processes including growth arrest, angiogenesis, apoptosis, and DNA repair [36]. It is widely accepted, that the progression and recurrence of glioblastoma is related to p53 pathway abnormalities in 87% of primary GBM [17]. To gain insights into the interaction between p53 and PARP1, we investigated and found that PARP1 showed association with CDKN2A deletions and MDM4 gain (both CDKN2A and MDM4 are components of the p53 pathway) (Figure 7B). These two genetic alterations are frequent in GBM, and result in abnormal p53 signalling in tumour cells [17]. Furthermore, PARP1 was negatively correlated with CDKN1A, which is a downstream member of the p53 cascade involved in the p53-mediated G1 arrest. This observation suggests that down-regulated CDKN1A cannot inhibit the Cyclin E-CDK2 complex in GBMs with higher PARP1 levels. Consequently, it can result in an augmented cell-cycle activity and absence of apoptosis [38]. Furthermore, it has been reported, that low levels of 53BP1 could predict resistance to PARP inhibitors, because 53BP1 depletion reduces the cytotoxicity of PARP inhibitors [39]. Consistent with this notion, we found an overall low expression of TP53BP1 in GBM with higher levels in high-PARP1 cases.
In conclusion, PARP1 expression was increased in GBM at both mRNA and protein levels. To best of our knowledge, this is the first study to investigate the relevance of PARP1 in the context of specific molecular markers and subtypes of GBM. We have demonstrated that increased PARP1 levels show positive correlation with increasing tumour grades in gliomas Higher PARP1 mRNA expression levels were associated with ATRX and TP53 mutations. An IHC analysis in an independent clinical cohort also confirmed this relationship. Our results revealed that PARP1 levels were increased in the PN and CL subtypes and correlated with shorter survival in CL GBMs. The observed subtype-specificity suggests that PARP1, together with p53, is not only a diagnostic marker to differentiate PN and CL subtypes, but also a predictive marker of shorter survival and poor therapy response in the CL subgroup. We also pointed out that there is a close interplay between PARP1 and the members of the p53 pathway in GBM. Our results support the therapeutic role of PARP inhibitors in high-grade gliomas with the caveat that molecular heterogeneity needs to be taken into account.
MATERIALS AND METHODS
TCGA datasets
Genetic alterations of PARP1, somatic mutation, CNA, and mRNA expression (z-score, RNA Seq V2 RSEM) data were collected from two TCGA cohorts: Glioblastoma Multiforme (TCGA, Provisional) and Brain Lower Grade Glioma (TCGA, Provisional) using the cBioPortal for Cancer Genomics (www.cbioportal.org). The relative expression of each gene and the gene expression distribution in a reference population were examined. The reference population was, either, all tumours that are diploid for the gene in question or, when available, have a normal adjacent tissue. The returned value indicates the number of standard deviations away from the mean of expression in the reference population (z-score) [40, 41]. In cBioPortal, copy numbers are computed using the GISTIC (Genomic Identification of Significant Targets in Cancer) algorithm, which identifies the putative copy number level as follows: I) high-level amplification, II) low-level gain, III) diploid, IV) heterozygous deletion, or V) homozygous deletion [40, 41].
Clinicopathological data for each patient including: age, sex, and survival time, was compiled from the TCGA portal (www.tcga-data.nci.nih.gov) and tabulated with genetic data. Cases for the analysis were selected according to the following criteria: I) only patients older than 18 years with available clinical data were included, considering that paediatric GBM represents a distinct molecular and genetic background (see reviews [42, 43]); II) oligodendrogliomas and mixed gliomas were omitted; III) tumours with complete genomic data (available somatic mutations, CNA, and mRNA expression information) were selected for the PARP1 mRNA expression analysis. Altogether, 135 WHO grade IV glioblastoma and 96 lower grade astrocytomas (grade II & grade III) were assembled for the present analyses. The clinicopathological parameters, and key marker status of the cases are summarized in Table 2. GBM subtypes were accessible on 119 cases, with the following distribution: 57 ME, 43 CL, 16 PN, and 5 NE.
The relationships between PARP1 mRNA expression and the overall patient survival were analysed by dividing the samples into PARP1-low and PARP1-high expression groups, based on median mRNA expression z-score in TCGA dataset.
Patients with GBM
Samples were obtained from 60 patients (30 males and 30 female) diagnosed with GBM between 2006 and 2014 at the first author’s affiliated institute. The mean age at diagnosis was 58.47 ± 9.03 years (range 30.21- 76.67 years). After surgical removal, sections were cut and stained with haematoxylin-eosin (H&E) from formalin-fixed and paraffin-embedded (FFPE) blocks. All the histopathological specimens were reviewed and diagnosed by a neuropathologist (TH) according to World Health Organization (WHO) criteria [19]. This research protocol was approved by the Institutional Review Board of the University of Debrecen.
Immunohistochemistry
Immunohistochemical (IHC) analysis was carried out as previously described [44]. Briefly, the staining was performed on 4-μm-thick FFPE sections using the manufacturers’ protocols. At first, sections were deparaffinised in xylene and rehydrated in a graded series of ethanol. Heat-induced epitope retrieval was performed utilizing citrate buffer (pH 6.0). After blocking endogenous peroxidase activity, sections were incubated with primary antibodies (anti-p53, anti-ATRX, anti-IDH1, and anti-PARP1) for 6 hours at room temperature. Specifications of the antibodies are listed in Table 6. Visualization was achieved with SuperSensitive™ One-step Polymer-HRP Detection System on Leica Bond Max™ automated IHC stainer, employing 3,3'-diaminobenzidine (DAB), then followed by counterstaining with hematoxylin. Adequate positive and negative controls (with omission of the primary antibodies) were included in the immunohistochemical experiments.
Table 6: Specifications of the antibodies used for immunohistochemical staining
Antibodies |
Catalogue numbers |
Manufacturer |
Dilutions |
|---|---|---|---|
anti-ATRX |
HPA001906 |
Sigma-Aldrich |
1:1000 |
anti-IDH1 |
DIA-H09 |
Dianova |
1:50 |
anti-p53 |
DO-7 |
Dako |
1:700 |
anti-PARP1 |
ab6079 |
Abcam |
1:500 |
Cases with ≥10 % stained cells were defined as positive for IDH1 and p53 [20]. A cut-off point of 10 % was considered for the evaluation of presence or absence of nuclear ATRX [32]. All FFPE sections were scored in a blinded manner by two independent observers (MC & RH). The expression of all IHC markers was determined semi-quantitatively. Ten randomly selected high-power fields (or the entire tumour if the sample was smaller) were examined in each neurosurgical specimen.
The PARP1 expression was evaluated based on the distribution of positive cells. The percentage of positivity was scored as follows: “0” (<5%, negative), “1” (5–25%, sporadic), “2” (25–50%, focal), or “3” (>50%, diffuse). For the statistical analysis, negative and sporadic staining was combined as low PARP1 staining and focal and diffuse nuclear staining as high PARP1 staining.
Statistical and data analyses
Statistical analyses were performed using R software (http://www.r-project.org) and SPSS 21.0 software (SPSS Inc., IL, USA). Comparisons between groups were calculated with Pearson’s Chi-square (χ2) test for categorical variables applying Yates' correction when required. The association between mRNA levels was measured using the Kendall’s tau and Spearmann’s correlation test. The difference in mRNA expression levels, between groups was calculated using a two-tailed Student’s t-test. Kaplan–Meier method and Log-Rank (Mantel-Cox) test were used for overall survival measurements. Differences were significant when p<0.05.
Gene-gene interaction network to demonstrate p53 pathway and PARP1 interaction was generated by the GeneMania Cytoscape 3.4.0 application. Physical, co-expression and gene-gene interactions were evaluated [45].
CONFLICTS OF INTEREST
The Authors do not have any conflicts of interest.
GRANT SUPPORT
This study was supported by the New National Excellence Program of the Ministry of Human Capacities; ÚNKP-16-3 (BM), the Hungarian Brain Research Program (NAP) – Grants No. KTIA_13_NAP-A-II/7 and KTIA_13_NAP-A-V/3, AGR_PIAC_13-1-2013-0008, and GINOP-2.3.2-15-2016-00043 (TH & ÁK).
REFERENCES
1. Parker NR, Khong P, Parkinson JF, Howell VM, Wheeler HR. Molecular heterogeneity in glioblastoma: potential clinical implications. Front Oncol. 2015; 5: 55.
2. Garrido W, Rocha JD, Jaramillo C, Fernandez K, Oyarzún C, Martin RS, Quezada C. Chemoresistance in high-grade gliomas: relevance of adenosine signalling in stem-like cells of glioblastoma multiforme. Curr Drug Targets. 2014; 15: 931–42.
3. Aldape K, Zadeh G, Mansouri S, Reifenberger G, von Deimling A. Glioblastoma: pathology, molecular mechanisms and markers. Acta Neuropathol. 2015; 129: 829–48.
4. Murnyák B, Csonka T, Hegyi K, Méhes G, Klekner A, Hortobágyi T. [Occurrence and molecular pathology of high grade gliomas]. [Article in Hungarian]. Ideggyogy Sz. 2013; 66: 312–21.
5. Nile DL, Rae C, Hyndman IJ, Gaze MN, Mairs RJ. An evaluation in vitro of PARP-1 inhibitors, rucaparib and olaparib, as radiosensitisers for the treatment of neuroblastoma. BMC Cancer. 2016; 16: 621.
6. Ito S, Murphy CG, Doubrovina E, Jasin M, Moynahan ME. PARP inhibitors in clinical use induce genomic instability in normal human cells. PLoS One. 2016; 11: e0159341.
7. Lacza Z, Horváth EM, Komjáti K, Hortobágyi T, Szabó C, Busija DW. PARP inhibition improves the effectiveness of neural stem cell transplantation in experimental brain trauma. Int J Mol Med. 2003; 12: 153–9.
8. Hortobágyi T, Görlach C, Benyo Z, Lacza Z, Hortobágyi S, Wahl M, Harkany T. Inhibition of neuronal nitric oxide synthase-mediated activation of poly (ADP-ribose) polymerase in traumatic brain injury: neuroprotection by 3-aminobenzamide. Neuroscience. 2003; 121: 983–90.
9. Beck C, Robert I, Reina-San-Martin B, Schreiber V, Dantzer F. Poly (ADP-ribose) polymerases in double-strand break repair: focus on PARP1, PARP2 and PARP3. Exp Cell Res. 2014; 329: 18–25.
10. Livraghi L, Garber JE. PARP inhibitors in the management of breast cancer: current data and future prospects. BMC Med. 2015; 13: 188.
11. Csonka T, Murnyák B, Szepesi R, Kurucz A, Klekner Á, Hortobágyi T. Poly (ADP-ribose) polymerase-1 (PARP1) and p53 labelling index correlates with tumour grade in meningiomas. Folia Neuropathol. 2014; 52: 111–20.
12. Domagala P, Huzarski T, Lubinski J, Gugala K, Domagala W. PARP-1 expression in breast cancer including BRCA1-associated, triple negative and basal-like tumors: possible implications for PARP-1 inhibitor therapy. Breast Cancer Res Treat. 2011; 127: 861–9.
13. Ohgaki H, Dessen P, Jourde B, Horstmann S, Nishikawa T, Di Patre PL, Burkhard C, Schüler D, Probst-Hensch NM, Maiorka PC, Baeza N, Pisani P, Yonekawa Y, et al. Genetic pathways to glioblastoma: a population-based study. Cancer Res. 2004; 64: 6892–9.
14. Nilsson CL, Mostovenko E, Lichti CF, Ruggles K, Fenyö D, Rosenbloom KR, Hancock WS, Paik YK, Omenn GS, LaBaer J, Kroes RA, Uhlén M, Hober S, et al. Use of ENCODE resources to characterize novel proteoforms and missing proteins in the human proteome. J Proteome Res. 2014; 14: 603–8.
15. Lichti CF, Liu H, Shavkunov AS, Mostovenko E, Sulman EP, Ezhilarasan R, Wang Q, Kroes RA, Moskal JC, Fenyö D, Oksuz BA, Conrad CA, Lang FF, et al. Integrated chromosome 19 transcriptomic and proteomic data sets derived from glioma cancer stem-cell lines. J Proteome Res. 2013; 13: 191–9.
16. Paik YK, Jeong SK, Omenn GS, Uhlen M, Hanash S, Cho SY, Lee HJ, Na K, Choi EY, Yan F, Zhang F, Zhang Y, Snyder M, et al. The Chromosome-Centric Human Proteome Project for cataloging proteins encoded in the genome. Nat Biotechnol. 2012; 30: 221–3.
17. Cancer Genome Atlas Research Network. Comprehensive genomic characterization defines human glioblastoma genes and core pathways. Nature. 2008; 455: 1061–8.
18. Parsons DW, Jones S, Zhang X, Lin JC, Leary RJ, Angenendt P, Mankoo P, Carter H, Siu IM, Gallia GL, Olivi A, McLendon R, Rasheed BA, et al. An integrated genomic analysis of human glioblastoma multiforme. Science. 2008; 321: 1807–12.
19. Louis DN, Perry A, Reifenberger G, von Deimling A, Figarella-Branger D, Cavenee WK, Ohgaki H, Wiestler OD, Kleihues P, Ellison DW. The 2016 World Health Organization classification of tumors of the central nervous system: a summary. Acta Neuropathol. 2016; 131: 803–20.
20. Takano S, Ishikawa E, Sakamoto N, Matsuda M, Akutsu H, Noguchi M, Kato Y, Yamamoto T, Matsumura A. Immunohistochemistry on IDH 1/2, ATRX, p53 and Ki-67 substitute molecular genetic testing and predict patient prognosis in grade III adult diffuse gliomas. Brain Tumor Pathol. 2016; 33: 107–16.
21. Jiao Y, Killela PJ, Reitman ZJ, Rasheed BA, Heaphy CM, de Wilde RF, Rodriguez FJ, Rosemberg S, Oba-Shinjo SM, Marie SK, Bettegowda C, Agrawal N, Lipp E, et al. Frequent ATRX, CIC, FUBP1 and IDH1 mutations refine the classification of malignant gliomas. Oncotarget. 2012; 3: 709–22. doi: 10.18632/oncotarget.588.
22. Verhaak RG, Hoadley KA, Purdom E, Wang V, Qi Y, Wilkerson MD, Miller CR, Ding L, Golub T, Mesirov JP, Alexe G, Lawrence M, O'Kelly M, et al. Integrated genomic analysis identifies clinically relevant subtypes of glioblastoma characterized by abnormalities in PDGFRA, IDH1, EGFR, and NF1. Cancer Cell. 2010; 17: 98–110.
23. Galia A, Calogero A, Condorelli R, Fraggetta F, La Corte A, Ridolfo F, Bosco P, Castiglione R, Salemi M. PARP-1 protein expression in glioblastoma multiforme. Eur J Histochem. 2012; 56: e9.
24. van Vuurden DG, Hulleman E, Meijer OL, Wedekind LE, Kool M, Witt H, Vandertop WP, Würdinger T, Noske DP, Kaspers GJ, Cloos J. PARP inhibition sensitizes childhood high grade glioma, medulloblastoma and ependymoma to radiation. Oncotarget. 2011; 2: 984–96. doi: 10.18632/oncotarget.362.
25. Barton VN, Donson AM, Kleinschmidt-DeMasters B, Gore L, Liu AK, Foreman NK. PARP1 expression in pediatric central nervous system tumors. Pediatr Blood Cancer. 2009; 53: 1227–30.
26. Tentori L, Ricci-Vitiani L, Muzi A, Ciccarone F, Pelacchi F, Calabrese R, Runci D, Pallini R, Caiafa P, Graziani G. Pharmacological inhibition of poly (ADP-ribose) polymerase-1 modulates resistance of human glioblastoma stem cells to temozolomide. BMC Cancer. 2014; 14: 151.
27. Malyuchenko NV, Kotova EY, Kulaeva OI, Kirpichnikov MP, Studitskiy VM. PARP1 Inhibitors: antitumor drug design. Acta Naturae. 2015; 7: 27–37.
28. Sulkowski PL, Corso CD, Robinson ND, Scanlon SE, Purshouse KR, Bai H, Liu Y, Sundaram RK, Hegan DC, Fons NR, Breuer GA, Song Y, Mishra-Gorur K, et al. 2-Hydroxyglutarate produced by neomorphic IDH mutations suppresses homologous recombination and induces PARP inhibitor sensitivity. Sci Transl Med. 2017; 9: eaal2463.
29. Haince JF, McDonald D, Rodrigue A, Déry U, Masson JY, Hendzel MJ, Poirier GG. PARP1-dependent kinetics of recruitment of MRE11 and NBS1 proteins to multiple DNA damage sites. J Biol Chem. 2008; 283: 1197–208.
30. Le Mercier M, Hastir D, Lopez XM, De Neve N, Maris C, Trepant AL, Rorive S, Decaestecker C, Salmon I. A simplified approach for the molecular classification of glioblastomas. PLoS One. 2012; 7: e45475.
31. Kato Y, Jin G, Kuan CT, McLendon RE, Yan H, Bigner DD. A monoclonal antibody IMab-1 specifically recognizes IDH1 R132H, the most common glioma-derived mutation. Biochem Biophys Res Commun. 2009; 390: 547–51.
32. Ebrahimi A, Skardelly M, Bonzheim I, Ott I, Mühleisen H, Eckert F, Tabatabai G, Schittenhelm J. ATRX immunostaining predicts IDH and H3F3A status in gliomas. Acta Neuropathol Commun. 2016; 4: 60.
33. Murnyák B, Hortobágyi T. Immunohistochemical correlates of TP53 somatic mutations in cancer. Oncotarget. 2016; 7: 64910–20. doi: 10.18632/oncotarget.11912.
34. Valenzuela MT, Guerrero R, Nunez MI, Ruiz de Almodovar JM, Sarker M, de Murcia G, Oliver FJ. PARP-1 modifies the effectiveness of p 53-mediated DNA damage response. Oncogene. 2002; 21: 1108–16.
35. Wesierska-Gadek J, Ranftler C, Schmid G. Physiological ageing: role of p53 and PARP-1 tumor suppressors in the regulation of terminal senescence. J Physiol Pharmacol. 2005; 56: 77.
36. Stracquadanio G, Wang X, Wallace MD, Grawenda AM, Zhang P, Hewitt J, Zeron-Medina J, Castro-Giner F, Tomlinson IP, Goding CR, Cygan KJ, Fairbrother WG, Thomas LF, et al. The importance of p53 pathway genetics in inherited and somatic cancer genomes. Nat Rev Cancer. 2016; 16: 251–65.
37. Boersma BJ, Howe TM, Goodman JE, Yfantis HG, Lee DH, Chanock SJ, Ambs S. Association of breast cancer outcome with status of p53 and MDM2 SNP309. J Natl Cancer Inst. 2006; 98: 911–9.
38. Harris SL, Levine AJ. The p53 pathway: positive and negative feedback loops. Oncogene. 2005; 24: 2899–908.
39. Hong R, Ma F, Zhang W, Yu X, Li Q, Luo Y, Zhu C, Jiang W, Xu B. 53BP1 depletion causes PARP inhibitor resistance in ATM-deficient breast cancer cells. BMC Cancer. 2016; 16: 725.
40. Cerami E, Gao J, Dogrusoz U, Gross BE, Sumer SO, Aksoy BA, Jacobsen A, Byrne CJ, Heuer ML, Larsson E, Antipin Y, Reva B, Goldberg AP, et al. The cBio cancer genomics portal: an open platform for exploring multidimensional cancer genomics data. Cancer Discov. 2012; 2: 401–4.
41. Gao J, Aksoy BA, Dogrusoz U, Dresdner G, Gross B, Sumer SO, Sun Y, Jacobsen A, Sinha R, Larsson E, Cerami E, Sander C, Schultz N. Integrative analysis of complex cancer genomics and clinical profiles using the cBioPortal. Sci Signal. 2013; 6: pl1.
42. Diaz AK, Baker SJ. The genetic signatures of pediatric high-grade glioma: no longer a one-act play. Semin Radiat Oncol. 2014; 24: 240–7.
43. Schwartzentruber J, Korshunov A, Liu XY, Jones DT, Pfaff E, Jacob K, Sturm D, Fontebasso AM, Quang DA, Tönjes M, Hovestadt V, Albrecht S, Kool M, et al. Driver mutations in histone H3. 3 and chromatin remodelling genes in paediatric glioblastoma. Nature. 2012; 482: 226–31.
44. Csonka T, Murnyák B, Szepesi R, Bencze J, Bognár L, Klekner Á, Hortobágyi T. Assessment of candidate immunohistochemical prognostic markers of meningioma recurrence. Folia Neuropathol. 2016; 54: 114–26.
45. Montojo J, Zuberi K, Rodriguez H, Bader GD, Morris Q. GeneMANIA: fast gene network construction and function prediction for Cytoscape. F1000Res. 2014; 3: 153.