
INTRODUCTION
The Uyghur ethnic group, the fourth largest ethnic minority of China, primarily lives in northwest China’s Xinjiang Uyghur Autonomous Region. Previous population genetic studies [1–3] indicated that Uyghurs possess mixed anthropometric and genetic traits of both Europeans and Central Asians. Therefore, the genetic data analysis of more markers in Uyghur group will be of benefit to shed light on its genetic relationships with other populations.
Short tandem repeats (STRs) have been publicly recognized as vital genetic markers in forensic sciences. In order to achieve better performances in forensic applications, especially in some mutation events of parentage testing, we need more genetic markers with high polymorphisms. Meantime, we should obtain population genetic data of these markers as much as possible before putting them into actual forensic cases. In this study, we investigated the allelic frequencies and forensic descriptive parameters of autosomal multi STR loci in Uyghur group using HuaXia Platinum PCR Amplification system, which included 23 autosomal STR loci and two sex associated markers (Y-chromosome insertion and deletion and Amelogenin). Furthermore, we evaluated genetic relationships between studied Uyghur group and other reference populations [4–17] from the same or different regions based on 14 shared STR loci including D8S1179, D21S11, D7S820, CSF1PO, TH01, D13S317, D16S539, D2S1338, D19S433, vWA, TPOX, D18S51, D5S818 and FGA loci.
RESULTS
Allelic frequencies and forensic descriptive parameters
The results of allelic frequencies and forensic descriptive parameters for 23 STR loci were presented in Table 1 and Table 2, respectively. A total of 281 alleles were observed in Uyghur group with their corresponding frequencies ranging from 0.0004 to 0.5390. For Hardy-Weinberg equilibrium (HWE) test, twenty-two of 23 STR loci were observed to exhibit HWE after Bonferroni correction (p = 0.05/23≈0.0022); only D3S1358 violated Hardy-Weinberg equilibrium. The match of probability (MP) ranged from 0.0123 at Penta E locus to 0.2003 at TPOX locus with the average of 0.0692. The probability of exclusion (PE) ranged from 0.2862 at TPOX locus to 0.8102 at Penta E locus with the average of 0.5969. The mean values of discrimination power (DP), polymorphic information content (PIC), observed heterozygosity (Ho) and expected heterozygosity (He) were 0.9380, 0.7776, 0.7957 and 0.8048, respectively; and the highest values of DP, PIC, Ho and He were also found at Penta E locus, the least observed at TPOX locus. The combined match probability (CMP) and combined probability of exclusion (CPE) of 23 STR loci were 5.192×10⁻²⁹ and 0.9999999996594, respectively.
Table 1: Allelic frequencies for 23 autosomal STR loci of Uyghur group in the Xinjiang Uyghur Autonomous Region, northwest China
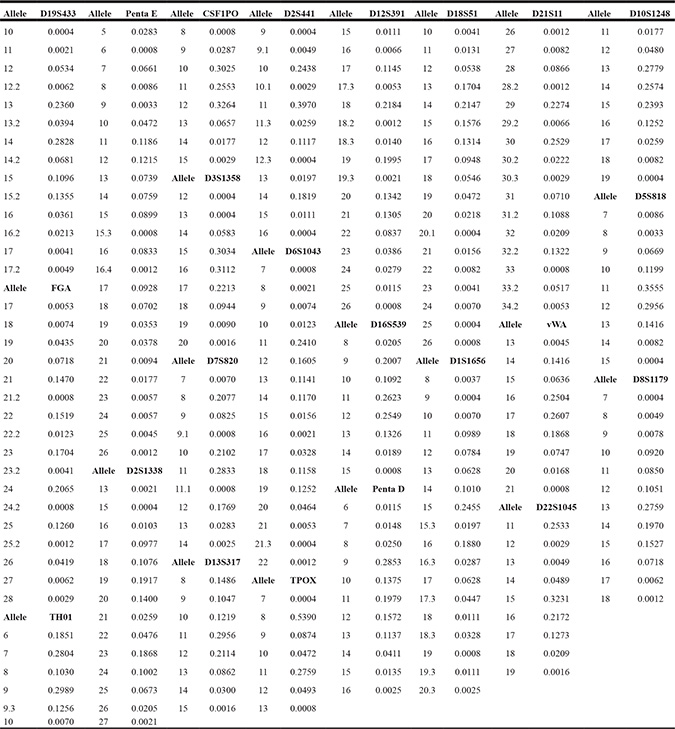
Table 2: Forensic descriptive parameters for 23 autosomal STR loci of Uyghur group in the Xinjiang Uyghur Autonomous Region, northwest China
Loci |
MP |
DP |
PIC |
PE |
Ho |
He |
p |
|---|---|---|---|---|---|---|---|
CSF1PO |
0.1207 |
0.8793 |
0.6831 |
0.4814 |
0.7332 |
0.7313 |
0.3023 |
D10S1248 |
0.0801 |
0.9199 |
0.7458 |
0.5161 |
0.7537 |
0.7802 |
0.1110 |
D12S391 |
0.0384 |
0.9616 |
0.8380 |
0.7155 |
0.8604 |
0.8545 |
0.3008 |
D13S317 |
0.0605 |
0.9395 |
0.7868 |
0.6386 |
0.8210 |
0.8117 |
0.8202 |
D16S539 |
0.0710 |
0.9290 |
0.7649 |
0.5668 |
0.7824 |
0.7956 |
0.7072 |
D18S51 |
0.0319 |
0.9681 |
0.8503 |
0.6671 |
0.8358 |
0.8646 |
0.0047 |
D19S433 |
0.0509 |
0.9491 |
0.8017 |
0.6153 |
0.8087 |
0.8230 |
0.3590 |
D1S1656 |
0.0309 |
0.9691 |
0.8529 |
0.7057 |
0.8555 |
0.8658 |
0.1503 |
D21S11 |
0.0442 |
0.9558 |
0.8200 |
0.6480 |
0.8259 |
0.8387 |
0.8892 |
D22S1045 |
0.0917 |
0.9083 |
0.7277 |
0.5133 |
0.7521 |
0.7653 |
0.0477 |
D2S1338 |
0.0318 |
0.9682 |
0.8559 |
0.7204 |
0.8629 |
0.8696 |
0.0042 |
D2S441 |
0.1082 |
0.8918 |
0.6962 |
0.4841 |
0.7348 |
0.7362 |
0.5120 |
D3S1358 |
0.1035 |
0.8965 |
0.7075 |
0.4679 |
0.7250 |
0.7498 |
0.0013 |
D5S818 |
0.1048 |
0.8952 |
0.7075 |
0.4882 |
0.7373 |
0.7472 |
0.2904 |
D6S1043 |
0.0374 |
0.9626 |
0.8409 |
0.6928 |
0.8489 |
0.8567 |
0.2279 |
D7S820 |
0.0741 |
0.9259 |
0.7621 |
0.5924 |
0.7964 |
0.7935 |
0.7715 |
D8S1179 |
0.0519 |
0.9481 |
0.8089 |
0.6544 |
0.8292 |
0.8297 |
0.0235 |
FGA |
0.0371 |
0.9629 |
0.8427 |
0.7074 |
0.8563 |
0.8587 |
0.3969 |
Penta D |
0.0564 |
0.9436 |
0.7969 |
0.6292 |
0.8161 |
0.8200 |
0.3302 |
Penta E |
0.0123 |
0.9877 |
0.9152 |
0.8102 |
0.9072 |
0.9207 |
0.2037 |
TH01 |
0.0870 |
0.9130 |
0.7348 |
0.5332 |
0.7635 |
0.7714 |
0.2223 |
TPOX |
0.2003 |
0.7997 |
0.5678 |
0.2862 |
0.5961 |
0.6211 |
0.0040 |
vWA |
0.0665 |
0.9335 |
0.7764 |
0.5954 |
0.7980 |
0.8045 |
0.9422 |
MP: match of probability; DP: discrimination power; PIC: polymorphic information content; PE: probability of exclusion; Ho: observed heterozygosity; He: expected heterozygosity; p: probability values for Hardy-Weinberg equilibrium tests.
Comparisons of inter-population genetic differentiations and genetic distances
As shown in Table 3, the results of population differentiation comparisons (p-value) were obtained with the method of analysis of molecular variance (AMOVA). After applying Bonferroni correction to multiple tests (p = 0.05/238≈0.00021), the least differentiations were found between Uyghur group and Uyghur1, Hui and Xibe groups at the same 14 loci, with significant differences at 0, 1 and 3 loci, respectively. By contrast, more significant differences were observed between Uyghur group and African American and Caucasian populations, with significant differences at 13 loci. Among all the compared loci, the most population diversity locus was found at TH01 with significant difference between Uyghur and 16 reference populations, the least found at TPOX with only 2 reference populations.
Table 3: The results of inter-population differentiations (p-value) between Uyghur group and other previously published populations using the AMOVA method
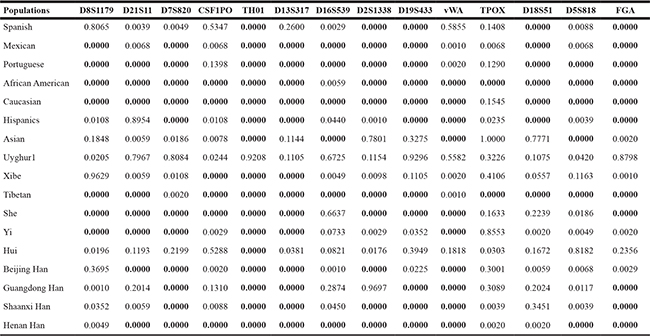
Notes: The numbers in bold mean statistically significant after Bonferroni correction (p = 0.05/238≈0.00021).
The pairwise fixation index (Fst) genetic distances between Uyghur group and other 17 reference populations were generated by the Genepop v4.0.10 [18] based on 14 overlapping STR loci which were shown in Supplementary Table 1. The close genetic distances were found between two Uyghur groups (0.0009), followed by Hui (0.0038) and Xibe (0.0043) groups; and the longest distance was observed between Uyghur and Mexican (0.0225) group.
Multidimensional scaling and principal component analysis
A principal component analysis (PCA) plot was drawn using allelic frequencies of 14 shared loci of Uyghur group and 17 previously published populations by MVSP v3.1 software [19]. As demonstrated in Figure 1, four conglomerate groups were obviously observed: the first group consisting of Asian and nine Chinese populations including Beijing Han, Henan Han, Shaanxi Han, Guangdong Han, Hui, Tibetan, She, Yi and Xibe populations located in the right part of the graph; the second group including Spanish, Portuguese, Caucasian, and African American populations located in the top left corner; the third one, Hispanics and Mexican group, found to be positioned in the lower left part; the last group of two Uyghur groups clustering together located in the middle part. As shown in Figure 2, a multidimensional scaling (MDS) plot of eighteen populations was illustrated based on genetic distances (Fst values) using the ‘R’ package (http://www.r-tutor.com/category/r-packages). The similar population distributions were observed in the MDS plot: Chinese populations and Asian population were located in the right part; Mexican and African American were located in the left part; Spanish, Caucasian, Portuguese and Hispanics were located in the middle of the plot.
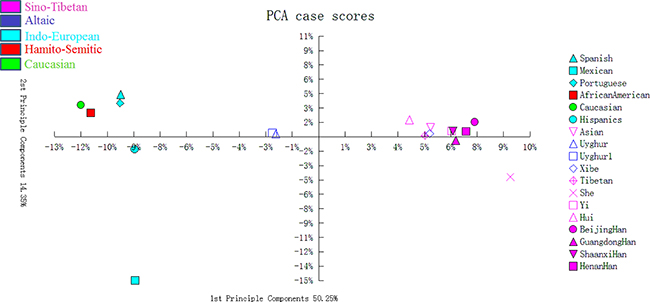
Figure 1: The PCA of Uyghur and other 17 reference populations based on the 14 STRs.
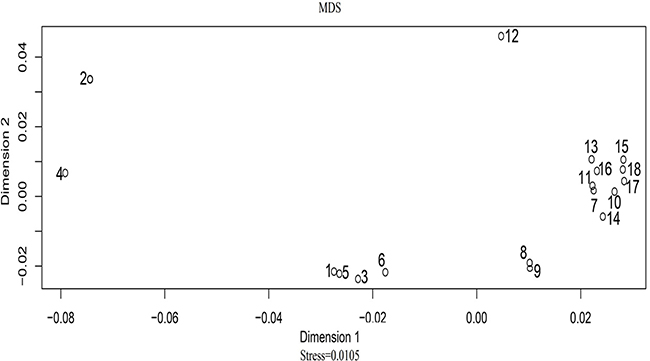
Figure 2: The MDS plot based on Fst distances across 18 populations. The annotations of the above-mentioned number are listed as follows: 1, Spanish; 2, Mexican; 3, Portuguese; 4, African American; 5, Caucasian; 6, Hispanics; 7, Asian; 8, Uyghur; 9, Uyghur1; 10, Xibe; 11, Tibetan; 12, She; 13,Yi; 14, Hui; 15, Beijing Han; 16, Guangdong Han; 17, Shaanxi Han; 18, Henan Han.
Phylogenic reconstructions
By using neighbor-joining method, two phylogenic trees were constructed by the software PHYLIP v3.6 (Figure 3A) and MEGA v5 (Figure 3B), respectively. The similar results which were obtained from two phylogenic trees depicted three clusters. And the first cluster consisted of Hui, Tibetan, Xibe, Shaanxi Han, Beijing Han, Henan Han, Yi, She, Asian and Guangdong Han; the second clade was shared by two Chinese Uyghur groups; the last comprised Mexican, Hispanics, African American, Spanish, Portuguese and Caucasian populations.
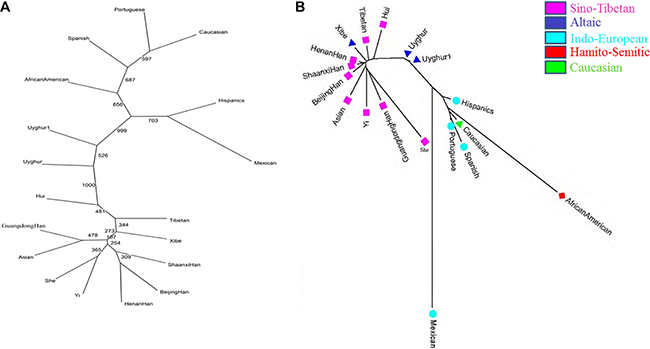
Figure 3: Phylogenic trees among 18 populations based on allelic frequencies by PHYLIP v3.6 software and DA distances by MEGA v5 software, respectively.
DISCUSSION
Forensic parameter analysis
HWE announces that a large random-mating population without selecting, mutating or migrating is thought to be in HWE. For populations in HWE, allelic frequencies and genotype frequencies usually remain constant from generation to generation [20–21]. Since HWE was influenced by multiple factors such as genetic drift, gene flowing and so on, it states an ideal condition with respect to the studied population. In the present study, only D3S1358 locus was observed to deviate from the HWE. A possible explanation for the deviation might result from population substructure. Since the blood samples we collected were from the whole territory of Xinjiang which comprises multiple ethnic minorities, individuals from different regions may form population substructures because of their geographical isolations. At 23 STR loci, the Penta E locus possessed the greatest values of PD and PE, whereas the TPOX locus owned the lowest. Previous studies [22–23] also found the similar results, which indicated Penta E was the most valuable locus and TPOX was a lower polymorphic locus than other STR loci in forensic cases. Therefore, we should screen more highly polymorphic loci so as to obtain better system effectiveness in subsequent forensic DNA and population genetic studies. The CMP and CPE could be regarded as indicators to evaluate efficiency of genetic markers in forensic application. In this study, the CMP and CPE obtained from the studied Uyghur group were 5.192 × 10⁻²⁹ and 0.9999999996594, respectively, which indicated the panel could be a robust and valid tool for individual identification and parentage testing in forensic caseworks.
Analysis of inter-population differentiations and genetic distances
If the loci with significant differences in allelic frequencies between pairwise populations are too many, it means that their genetic relationships are long distance and vice versa. Comparisons of genetic differentiations between Uyghur group and other reference populations based on 14 overlapping STR loci indicated the Uyghur had closer genetic relationships with some Chinese populations than those from different continents. By investigating inter-population differentiations based on allelic frequencies using AMOVA method, the two Uyghur groups showed no significant differences at these loci, and the significant differences were found between the studied Uyghur and Hui group at only TH01 locus; Xibe group at CSF1PO, TH01, D13S317 loci, revealing the short distances between Uyghur and Hui, Xibe groups. Deng [24] et al. reported the similar result that significant difference between Hui and Uyghur group was only observed at TH01 locus at the same 14 STR loci. Furthermore, the TH01 locus showed the most population diversities in the current study, which was also reported by Meng et al [9]; and the locus would have contributed to study the genetic differentiations among different populations.
Fst is a measure of genetic differentiation between compared populations which is used frequently in population genetics. The pairwise populations whose Fst is small usually show similar allelic frequency distributions; on the contrary, they show greatly different. In this study, the relative small Fst values were observed between Uyghur group with its adjacent populations such as Hui and Xibe groups, which indicated they had tight genetic relationships.
Phylogenic analysis
The genetic relationships between Uyghur group and 17 reference populations were revealed by the PCA and MDS figures based on allelic frequencies of the same 14 STR and population pairwise Fst values, respectively. The results of PCA and MDS analysis indicated that the populations with closer geographical distances had more intimate relationships. Besides, results obtained once again showed that Uyghur is a Eurasian population. In order to further evaluate genetic relationships among these populations, we constructed two phylogenic trees. The results obtained from phylogenic trees were basically in agreement with above genetic relationship analysis. In addition, previous studies also reported the similar results as following. Shen et al. constructed a phylogenic tree between Uyghur group and other reported populations based on allelic frequencies of HLA-B locus, revealing that Uyghur group had close genetic relationships with the Xibe and Hui groups [25]. A dendrogram which was conducted using allelic frequencies of four VNTRs and a STR locus demonstrated that Uyghur, Hui and other three Asian groups shared the same branch [26]. Bian et al. reported that Hui was most closely related to Uyghur with the method of pairwise Rst at 17 Y-STR loci [27]. The close relationship between Uyghur group and Hui group may be attributed to the analogous historical backdrops. On the one hand, both the ethnic minorities mainly located in northwestern China, an important zone crossed by the famous Silk Road. Since the convenient advantages of their geographical locations, both may have undergone extensive interactions which led to their similar genetic pattern. On the other hand, Uyghur and Hui group both have diverse origins, especially Hui ethnic group. Previous study [28] indicated that Huis in northwest China were derived from the convergence of Mongol, Turkic, Iranian and other Central Asia settlers including Han people and Uighurs. To sum up, both nationalities may have intimate blood relationships.
MATERIALS AND METHODS
Population samples and DNA extraction
We gathered blood samples from 1218 unrelated healthy individuals of Uyghur ethnic minority in northwest China’s Xinjiang Uyghur Autonomous Region after receiving their written informed consents. Each individual whose family has been living in the region for at least three generations didn’t intermarriage with other ethnic groups. All experiment procedures were in agreement with the ethical committee of Xi'an Jiaotong University Health Science Center, China. Under the instructions of Walsh et al, we obtained genomic DNA of each sample with the Chelex-100 method [29].
PCR and DNA typing
All loci were co-amplified using HuaXia Platinum PCR Amplification kit in GeneAmp 9700 PCR system (Applied Biosystems, Foster City, USA) under the producer’s specification. Thermal cycler conditions were as described below: pre-denaturation at 95°C for 1 min, followed by 27 cycles of 94°C for 3 s, 59°C for 16 s, 65°C for 29 s, and a final extension for 5 min at 60°C. The whole PCR reaction could be finished in 1 hour. Separation of amplified products was performed by capillary electrophoresis on the ABI 3130xl Genetic Analyzer (Applied Biosystems, Foster City, CA, USA) following the instructions in 11 μl reactions which consist of 1 μl PCR product or allelic ladder and the mixture of 9.6 μl Hi-Di Formamide and 0.4 μl GeneScan®-600 LIZ® Size Standard v2.0. The loading mixture was first denatured at 95°C for 3 min, followed by cooling at 4°C for 3 min immediately. The results of STRs typing were identified by the GeneMapper ID 3.2 software (Applied Biosystems, Foster City, CA, USA). Deionized water and control DNA from human cell line 9948 were typed as negative and positive control, respectively.
Statistical analysis
We calculated allelic frequencies, MP, PE, DP, and PIC using the corrected PowerStats v1.2 [30]. We evaluated Ho and He by making use of GenAlEx software version 6.503 [31] which could analyze a range of population genetic data. The test of HWE for each locus was performed by the Genepop v4.0.10 using the Markov chain algorithm. AMOVA was employed to calculate the inter-population differentiation by ARLEQUIN v3.5.1.2 software (http://cmpg.unibe.ch/software/arlequin3). On the basis of 14 overlapping STR loci, Fst values of pairwise populations were calculated with the Genepop v4.0.10. A PCA of eighteen populations was plotted by MVSP v3.1 software which could perform a variety of ordination and cluster analyses. A MDS plot was illustrated based on Fst values via the ‘R’ packages. Two phylogenic trees were constructed based on the allelic frequencies of the same 14 STRs by PHYLIP v3.6 software and DA distances (obtained from the DISPAN program) by MEGA v5 software, respectively.
Abbreviations
STRs: short tandem repeats; HWE: Hardy-Weinberg equilibrium; MP: match of probability; PE: probability of exclusion; DP: discrimination power; PIC: polymorphic information content; Ho: observed heterozygosity; He: expected heterozygosity; CMP: combined match probability; CPE: combined probability of exclusion; AMOVA: analysis of molecular variance; Fst: fixation index; PCA: principal component analysis; MDS: multidimensional scaling; HLA: human leucocyte antigen; VNTR: variable number of tandem repeat.
Authors’ contributions
X.J. wrote the main manuscript text. Y.W., T.K., Y.M., Y.G. and Q.D. conducted the data processing. J.C. provided human blood samples. T.X., H.M., M.Z., and J.L. performed statistical analyses. X.L. designed the study. B.Z. revised the manuscript.
ACKNOWLEDGMENTS
This research was supported by the National Natural Science Foundation of China (NSFC No. 81373248, 81525015, 81460286). The authors were very grateful for Jianye Ge to provide statistical analysis about HWE.
CONFLICTS OF INTEREST
No relevance interests were reported.
REFERENCES
1. Ablimit A, Qin W, Shan W, Wu W, Ling F, Ling KH, Zhao C, Zhang F, Ma Z, Zheng X. Genetic diversities of cytochrome B in Xinjiang Uyghur unveiled its origin and migration history. BMC Genet. 2013; 14:100.
2. Xu S, Huang W, Qian J, Jin L. Analysis of genomic admixture in Uyghur and its implication in mapping strategy. Am J Hum Genet. 2008; 82:883–94.
3. Lou H, Li S, Jin W, Fu R, Lu D, Pan X, Zhou H, Ping Y, Jin L, Xu S. Copy number variations and genetic admixtures in three Xinjiang ethnic minority groups. Eur J Hum Genet. 2015; 23:536–42.
4. Coudray C, Calderon R, Guitard E, Ambrosio B, González-Martín A, Dugoujon JM. Allele frequencies of 15 tetrameric short tandem repeats (STRs) in Andalusians from Huelva (Spain). Forensic Sci Int. 2007; 168:e21–4.
5. Almeida C, Ribeiro T, Oliveira AR, Porto MJ, Costa Santos J, Dias D, Dario P. Population data of the GlobalFiler(®) Express loci in South Portuguese population. Forensic Sci Int Genet. 2015; 19:39–41.
6. Aguilar-Velázquez JA, Martínez-Cortés G, Inclán-Sánchez A, Romero-Rentería O, Díaz-Navarro XX, Rangel-Villalobos H. Population data of 23 STR loci (PowerPlex® Fusion System) in Mexican Mestizos from the West Region. Int J Legal Med. 2016; 130:1489–1491.
7. Hill CR, Duewer DL, Kline MC, Coble MD, Butler JM. U.S. population data for 29 autosomal STR loci. Forensic Sci Int Genet. 2013; 7:e82–3.
8. Yuan L, Liu H, Liao Q, Xu X, Chen W, Hao S. Genetics analysis of 38 STR loci in Uygur population from Southern Xinjiang of China. Int J Legal Med. 2016; 130:687–8.
9. Meng H, Guo Y, Dong Q, Yang G, Yan J, Shi J, Zhu B. Autosomal-STR based genetic structure of Chinese Xibe ethnic group and its relationships to various groups. Int J Legal Med. 2016; 130:1501–1503.
10. Yan J, Shen C, Li Y, Yu X, Xiong X, Mu H, Huang Y, Deng Y, Yu J. Genetic analysis of 15 STR loci on Chinese Tibetan in Qinghai Province. Forensic Sci Int. 2007; 169:e3–6.
11. Yuan L, Ou Y, Liao Q, Gui J, Bai X, Ge J, Ye J, Zhang L. Population genetics analysis of 38 STR loci in the She population from Fujian Province of China. Leg Med (Tokyo). 2014; 16:314–8.
12. Zhu BF, Shen CM, Wu QJ, Deng YJ. Population data of 15 STR loci of Chinese Yi ethnic minority group. Leg Med (Tokyo). 2008; 10:220–4.
13. Wang Z, Huang P, Chen L, Xu Y, He K, Zhu X. Genetic polymorphisms of 15 STR loci in Chinese Hui population. J Forensic Sci. 2005; 50:1508–9.
14. Xiuyan R, Weini W, Yaran Y, Bingbing X, Jing C, Yacheng L, Jiangwei Y. [Genetic variability and phylogenetic analysis of 39 short tandem repeat loci in Beijing Han population]. [Article in Chinese]. Yi Chuan. 2015; 37:683–91.
15. Zhu J, Li J, Guo Y, Liu K, Zhu B, Liu Y. Population data of 15 STR in Chinese Han population from north of Guangdong. J Forensic Sci. 2005; 50:1510–1.
16. Wu YM, Zhang XN, Zhou Y, Chen ZY, Wang XB. Genetic polymorphisms of 15 STR loci in Chinese Han population living in Xi’an city of Shaanxi Province. Forensic Sci Int Genet. 2008; 2:e15–8.
17. Hongdan W, Bing K, Ning S, Miao H, Bo Z, Yuxin G, Bofeng Z, Shixiu L, Zhaoshu Z. Evaluation of the genetic parameters and mutation analysis of 22 STR loci in the central Chinese Han population. Int J Legal Med. 2017; 131:103–105.
18. Rousset F. genepop’007: a complete re-implementation of the genepop software for Windows and Linux. Mol Ecol Resour. 2008; 8:103–6.
19. Kovach WL, 2007. MVSP - A Multi Variate Statistical Package for Windows, ver. 3.1. Kovach Computing Services, Pentraeth, Wales, U.K.
20. Hardy GH. Mendelian proportions in a mixed population. 1908. Yale J Biol Med. 2003; 76:79–80.
21. Weinberg W. On the demonstration of heredity in man. 1908. In:Boyer SH (ed) (1963) Papers on human genetics. PrenticeHall, Englewood Cliffs, NJ.
22. Xie B, Chen L, Yang Y, Lv Y, Chen J, Shi Y, Chen C, Zhao H, Yu Z, Liu Y, Fang X, Yan J. Genetic distribution of 39 STR loci in 1027 unrelated Han individuals from Northern China. Forensic Sci Int Genet. 2015; 19:205–6.
23. Xiao C, Zhang W, Wei T, Pan C, Huang D. Population data of 21 autosomal STR loci in Chinese Han population from Hubei province in Central China. Forensic Sci Int Genet. 2016; 20:e13–4.
24. Deng YJ, Zhu BF, Shen CM, Wang HD, Huang JF, Li YZ, Qin HX, Mu HF, Su J, Wu J, Zhang B, Fan SL. Genetic polymorphism analysis of 15 STR loci in Chinese Hui ethnic group residing in Qinghai province of China. Mol Biol Rep. 2011; 38:2315–22.
25. Shen CM, Zhu BF, Deng YJ, Ye SH, Yan JW, Yang G, Wang HD, Qin HX, Huang QZ, Zhang JJ. Allele polymorphism and haplotype diversity of HLA-A, -B and -DRB1 loci in sequence-based typing for Chinese Uyghur ethnic group. PLoS One. 2010; 5:e13458.
26. Katsuyama Y, Inoko H, Imanishi T, Mizuki N, Gojobori T, Ota M. Genetic relationships among Japanese, northern Han, Hui, Uygur, Kazakh, Greek, Saudi Arabian, and Italian populations based on allelic frequencies at four VNTR (D1S80, D4S43, COL2A1, D17S5) and one STR (ACTBP2) loci. Hum Hered. 1998; 48:126–37.
27. Bian Y, Zhang S, Zhou W, Zhao Q, Siqintuya, Zhu R, Wang Z, Gao Y, Hong J, Lu D, Li C. Analysis of genetic admixture in Uyghur using the 26 Y-STR loci system. Sci Rep. 2016; 6:19998.
28. Lipman JN. Familiar strangers: a history of Muslims in Northwest China. American Historical Review. 2001.
29. Walsh PS, Metzger DA, Higushi R. Chelex 100 as a medium for simple extraction of DNA for PCR-based typing from forensic material. BioTechniques. 1991; 10:506–13.
30. Tereba A. Tools for analysis of population statistics. Profiles DNA. 1999; 2:14–16.
31. Peakall R, Smouse PE. GenAlEx 6.5: genetic analysis in Excel. Population genetic software for teaching and research—an update. Bioinformatics. 2012; 28:2537–9.