
INTRODUCTION
Cancer remains one of the most difficult diseases to cure, with successful treatment primarily relying on early diagnosis. However, the clinical outcome is often insufficient because the patients’ quality of life is already poor when they are diagnosed. Thus, clinical success would be greatly enhanced by a noninvasive method for identification of malignant transformation. As reported in recent decades, a reduction in extracellular pH (pHe) is a characteristic of most malignant tumors [1]. The pHe of the tumor microenvironment is typically acidic, in the range of 6.5 to 6.9, whereas the pHe of normal tissue is approximately 7.2 to 7.5 [2]. Extracellular tumor acidosis is the result of increased lactic acid production by high aerobic glycolysis [3] and poor perfusion of tumor cells [4]. This resultant acidity can enhance tumor aggressiveness [5], metastasis [6], chromosomal rearrangements [7], and angiogenesis [8]. Furthermore, low pHe also leads to resistance to radiation treatment and specific chemotherapeutics [9]. Acidic tumors are more sensitive to weak-acid chemotherapies such as esomeprazole than to weak-base chemotherapies such as doxorubicin [10-12]. Additionally, modulation of tumor pHe in a breast cancer mouse model has been shown to reduce metastasis and improve survival [13]. Given the association of acidity with tumor malignancy, accurate measurement of tumor pHe may greatly aid in identification of malignancy and tumor invasion, as well as in predicting therapeutic efficacy.
A variety of biomedical imaging methods have been developed to monitor tumor pHe in vivo. Optical imaging is a low cost imaging tool with good sensitivity, but can only evaluate surface-accessible tumors [14]. Whole-body PET allows rapid measurement of pHe [15]. Magnetic resonance spectroscopy provides excellent contrast with limited radiation exposure. However, both methods suffer from limited accuracy, poor sensitivity, low spatial resolution, and limited diagnostic ability [16, 17]. Based on these limitations, a novel magnetic resonance imaging contrast mechanism called chemical exchange saturation transfer may be desirable. Unlike traditional MRI, which is operated by altering the T1 or T2 relaxation times of water protons, CEST effects are detected indirectly through the reduced water signal obtained after selectively saturating the exchangeable protons on a CEST agent using radiofrequency (RF) irradiation [18-21]. CEST contrast agents map the pHe in the microenvironment in which they distribute [22]. Generally, CEST effects are modulated by several factors including pH, contrast agent concentration, and temperature [23, 24]. In order to minimize the effect of contrast agent concentration, ratiometric methods have been introduced [25]. Several iodinated contrast agents have been employed to measure tissue pHe [26, 27]. Ioversol, a widely used non-ionic X-ray contrast agent with high water solubility and low toxicity, has been shown to be pH-dependent [26]. Ioversol has two amide groups detected 4.3 ppm downfield from water (Figure 1), and has different CEST effects at different RF power levels, allowing an RF power-based ratiometric method to rule out concentration effects [27], and making ioversol more sensitive than traditional iodinated contrast agents such as iopamidol. However, the correlation between the CEST effects of ioversol and pH value still remains unclear.
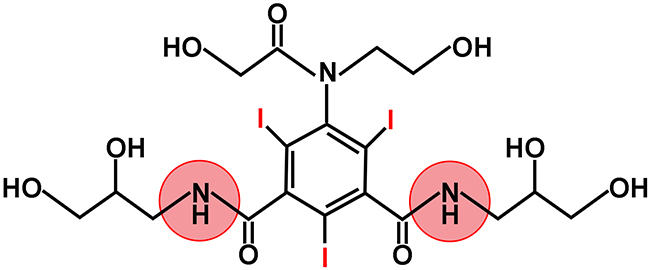
Figure 1: Ioversol chemical structure. Ioversol contains 2 amide groups, 4.3 ppm downfield from the bulk water resonance.
There are several reports concerning tumor CEST pHe imaging, especially in breast cancer, indicating that CEST pHe imaging can detect the acidic pHe of tumors [4, 12, 27], which is helpful for identifying malignancy in the clinical works. However, for liver cancer, which is of high incidence [28], little is known about its pHe imaging. Therefore, we investigated whether CEST MRI could be used as a noninvasive method to diagnose and analyze liver cancer. In this study, we predicted that liver cancer tissue would show a significantly lower CEST signal compared with normal liver tissue. Initially, we aimed to explore the correlation between CEST effects and pH values of ioversol in vitro, at high magnetic fields, and then applied our findings to a breast cancer model to demonstrate the feasibility of CEST imaging for liver cancer in vivo. Finally, we obtained a pHe map of liver cancer, which provides a novel imaging method for liver cancer diagnosis in the clinical setting, and predicting the efficacy of clinical treatment [29].
RESULTS
CEST effects of ioversol
As the CEST signals are pH-dependent, we first obtained the CEST Z-spectra of 30 mM ioversol at varying pH and under a B1 irradiation level of 6 μT (Figure 2A). The spectra revealed broad CEST effects, with a peak at 4.3 ppm corresponding to the two exchangeable amide groups. With increasing pH, the signals broadened because of the higher exchange rate. To evaluate the CEST effects, we measured the saturation transfer effect (ST%) within a pH range of 6.0 to 7.8 in vitro, using two saturation pulse powers (1.5 and 6 μT, Figure 2B). As expected, the CEST effects were markedly pH-dependent, with minimum values at pH 6.0, that gradually increased with pH up to pH 7.5 at an irradiation power of 6 μT, and to pH 7.2 at 1.5 μT, then decreased at higher pH. At high pH, the CEST effect decreases because the exchange rate becomes too high [26]. The unequal CEST effects under different irradiation powers enable a novel ratiometric pH MRI method first proposed by Longo et al [27].
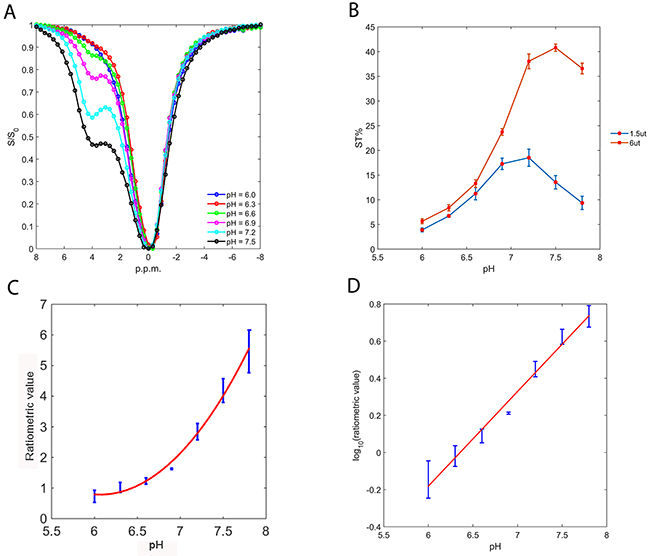
Figure 2: Ioversol exhibits a strong CEST signal. (A) Z-spectra of 30 mM ioversol at different pH values at 6 μT. (B) Ioversol ST% depends on pH at RF saturation powers of 1.5 and 6 μT. (C) The CEST ratio was exponentially correlated with pH. (D) The log10 ratio of the CEST effect linearly correlated with pH.
Theratiometric value is calculated according to the following equation:
STRF1,2 represents the saturation transfer (ST) acquired under different RF powers. Then we calculated the RF power mismatch (RPM) by determining the ST% ratio at RF power levels of 1.5 and 6 μT (Figure 2C). The RPM curve demonstrated that the ratiometric values increased exponentially with the pH value in the pH range of 6.0 to 7.8, with the log10 ratio of the CEST effects exhibiting an excellent correlation with pH (R2 = 0.98, p < 0.001, Figure 2D).
In vitro imaging of ioversol
Next, to determine whether the corresponding pH images could distinguish the ioversol solutions at different pH values, we performed experiments on 7 tubes of 30 mM ioversol at pH 6.0 to 7.8 and under B1 irradiation levels of 1.5 and 6 μT. Figure 3A and Figure 3B show strong CEST signal changes occurred with increasing pH, with the signal changes at 6 μT (Figure 3B) being greater than that at 1.5 μT (Figure 3A). Then we obtained a pH map by calculating from the ratiometric map, which was calculated from the ratio of the corresponding ST images (Figure 3C). The pH map showed that the different pH values could be clearly distinguished by the colorful signals. The calculated pH values strongly correlate with the titrated pH values, with pH(MRI) = pH(titrated) + 2E-0.5 (R2 = 0.98, p < 0.001) (Figure 3E). It should be noted that, this CEST agent has been previously used for in vivo applications, so we must ensure that it is concentration-independent. To answer this question, we prepared 6 tubes of pH 7.2 ioversol solution with different ioversol concentrations (10-60 mM). The pH map revealed no significant difference between these ioversol solutions (Figure 3D), and the calculated pH values were obtained within a small error for all concentrations (Figure 3F), confirming that pH quantification by ioversol CEST imaging can indeed measure pH over the 6-fold concentration range used in this study.
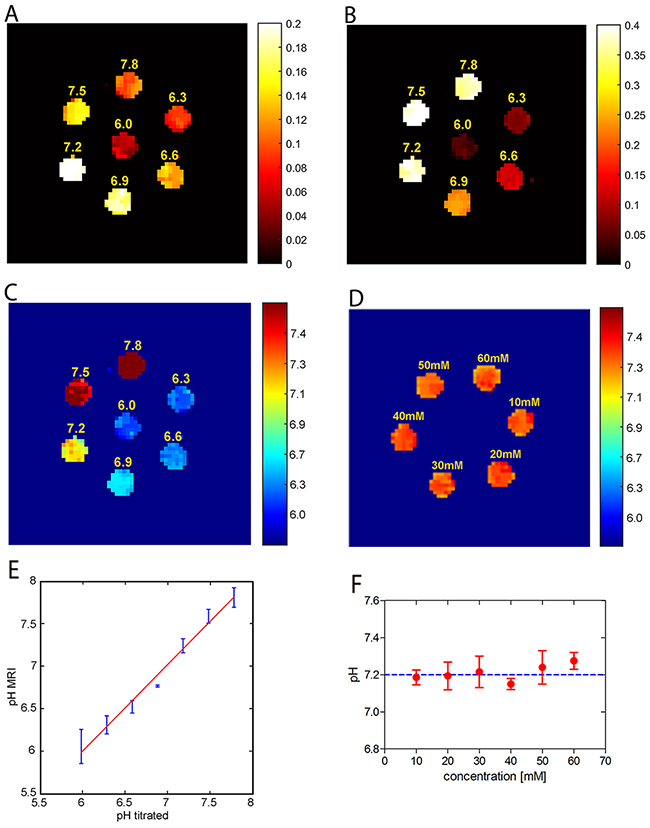
Figure 3: Ioversol CEST MR images of a phantom consisting of test tubes. ST images of 30 mM ioversol at different pH values under RF powers of 1.5 μT (A) and 6 μT (B). (C) pH map calculated using the corresponding ST images (A and B). (D) pH mapping is independent of ioversol concentration. (E) The calculated pH values strongly correlate with the titrated pH values. (F) Mean pH values calculated for several concentrations.
In vivo imaging of breast cancer
To assess whether our in vitro results are relevant for in vivo studies, we first applied ioversol CEST pHe in themouse mammary tumor virus (MMTV)-Erbb2 transgenic mouse breast tumor model, which is often used in CEST pHe studies. The axial T2 image of a breast cancer before injection shows the location of the tumor (Figure 4A). Then we directly injected ioversol into the tail vein, whereupon a strong CEST signal was generated in the tumor. The CEST ST maps, from the tumor region at 1.5 μT (Figure 4B) and 6 μT (Figure 4C) power saturation, showed that at 6 μT in the tumor (Figure 4C) was brighter than at 1.5 μT (Figure 4B), owing to the faster exchange rate. The tumor pHe map (ratiometric map in Figure 4B and 4C) of the tumor superimposed on the anatomic MR image shows an acidic extracellular environment, in the tumor region, corresponding to pHe values between 6.3-6.9 (Figure 4D).
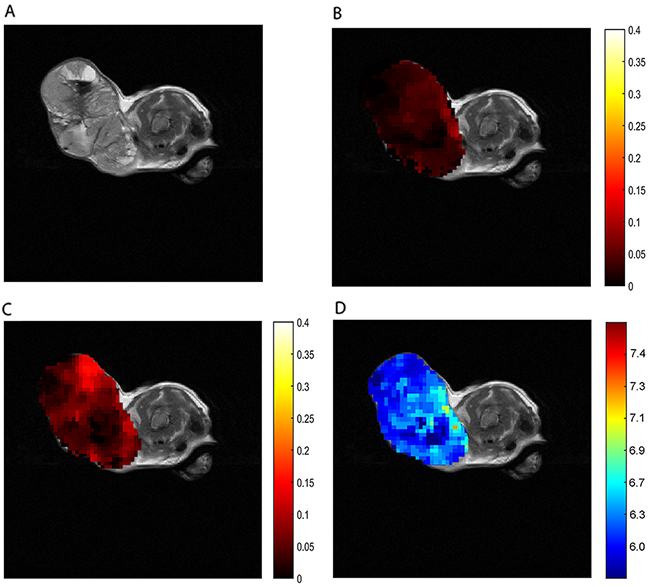
Figure 4: In vivo CEST imaging of breast cancer. (A) T2 breast cancer image. ST map after ioversol injection at 1.5 μT (B) and 6 μT (C). (D) The pHe map calculated by using corresponding ST images (B and C).
In vivo imaging of normal liver and liver tumors
Next, we tested whether ioversol CEST imaging could be performed on liver tissue. A reasonable CEST signal was observed throughout the normal liver at RF powers of 1.5 and 6 μT (Figure 5B and 5C, respectively), and the signal of the calculated pHe map (Figure 5D) displayed well in the region of the liver on the T2 image (Figure 5A), indicating ioversol CEST pHe MRI is feasible for liver applications. In an effort to determine whether ioversol CEST imaging could differentiate between liver tumor and normal tissue, we transplanted McA-RH7777 rat hepatoma cells into the left lateral hepatic lobe of Sprague-Dawley (SD) rats and allowed tumors to form for 14 days prior to ioversol CEST MRI. The axial T2 image showed that the tumor diameter was 9 mm (Figure 6A). After injecting ioversol, the liver tumor exhibited a lower CEST signal compared with the normal liver tissue, at both 1.5 μT (Figure 6B) and 6 μT (Figure 6C) irradiation. The ioversol CEST pHe maps were obtained from the rat tumors at 7T (Figure 6D). The pHe map clearly distinguished tumor from normal tissue, and the pHe of the tumor was lower than that of normal liver tissue in all 10 rats examined (p < 0.05, Figure 5E). Interestingly, we also found in the ioversol CEST pHe image that the tumor region was slightly greater than the region obtained by T2 imaging in both a breast and liver tumor model. Images of the tissue stained with hematoxylin and eosin (HE) are shown in the Supplementary Figure 1.
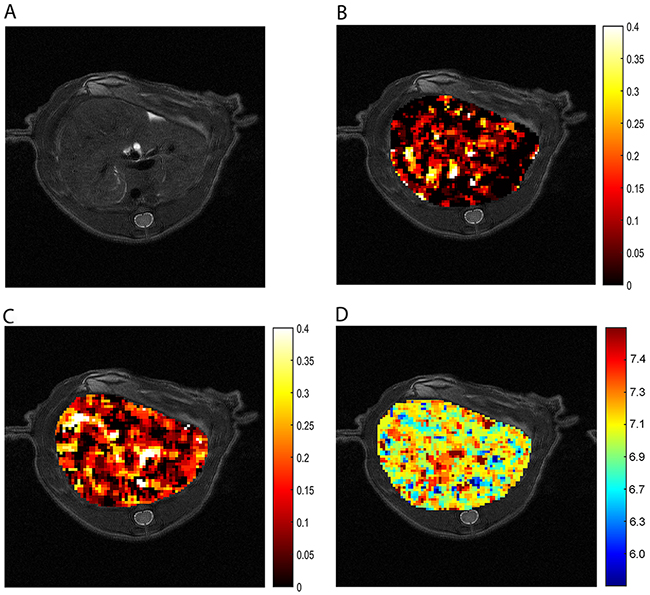
Figure 5: CEST imaging of normal liver tissue. (A) T2 liver image. ST map after ioversol injection at 1.5 μT (B) and 6 μT (C). (D) The pHe map calculated using the corresponding ST images (B and C).
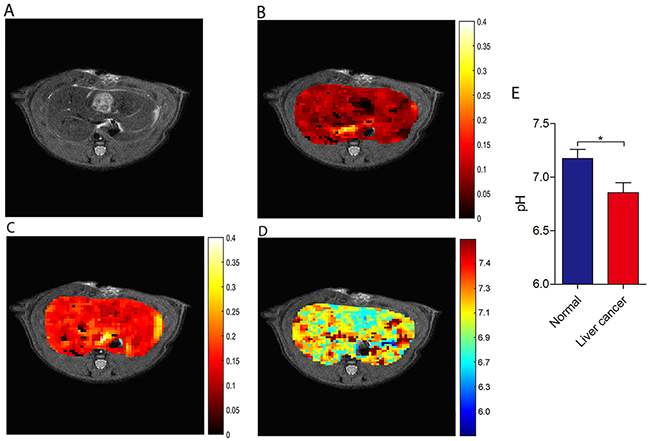
Figure 6: CEST imaging of liver cancer. (A) T2 liver cancer image. ST map after ioversol injection at 1.5 μT (B) and 6 μT (C). (D) The pHe map calculated using corresponding ST images (B and C). (E) pH values of the two tissues showing a significant difference (*p < 0.05, Student’s t-test). Error bars represent the standard deviation (n = 10)
DISCUSSION
Our findings provide the first evidence that ioversol CEST pHe MRI can accurately measure liver and breast tumor pHe in a concentration-independent manner, with excellent spatial resolution. In phantom studies, we showed that the log10 ratio of the CEST effect was linearly proportional to the pH value in the range of 6.0-7.8. These results extend the study of Longo et al., who only showed that ioversol is pH-dependent [26]. Moreover, compared with traditional CEST agents that have two CEST effects in one Z-spectrum, ioversol has two Z-spectra that may be more sensitive because the two CEST effects from different RF levels do not interact with each other. However, besides the contrast agent concentration, the CEST effect also depends on temperature, so attention must be paid to pH measurements at the same temperature during experiments [30].
Compared with the mouse xenograft models in previous reports, we choose the MMTV-Erbb2 transgenic mouse breast tumor model for our study because this reflects human breast cancer characteristics more accurately [31]. As we can see from the results, the pHe of the tumor region was fairly acidic, in the range of 6.3-6.9, suggesting a high degree of malignancy. We further show that liver cancer tissue had lower CEST signals compared with normal tissue. For our liver tumor model, we chose an orthotopic transplantation tumor model, using McA-RH7777 rat hepatoma cells, instead of a subcutaneous tumor model, because it simulates the characteristics and environment of human liver cancer. However, the accompanying challenges could not be neglected, especially motion artefacts and field inhomogeneity corrections. To minimize motion artifacts from breathing, we used a respiratory gating device and bellyband to reduce the respiratory amplitude. We also adopted motion correction and B0-shift correction to improve the image quality. In addition, a duration of 15 minutes post injection was allowed, to permit stabilization and prolonged accumulation of the contrast agent within the tumor, during the CEST MRI acquisition. However, the signal-to-noise ratio (SNR) in the liver of liver and liver cancer images was not always satisfactory, compared with kidney pH maps previously reported [25, 32]. This is mainly because: 1) the extracellular concentration of agent that accumulates in the liver is lower than that in the kidney [33, 34], and 2) the effect of breathing motion more profoundly affects the liver compared with that to kidney. The pHe map of the tumor region was slightly larger than that of the T2 map, indicating that either the acid diffused out of the tumor, or the pHe map was affected by noise, remaining to be further elucidated.
Future studies will be needed to optimize the parameters of this approach, for purpose of improving the image SNR. Shortening the acquisition time while maintaining good SNR by reducing the offset number also needs further investigation [35]. Moreover, as more and more patients accept chemotherapy, we should further explore and use CEST pH MRI to assess the response of liver cancer following chemotherapy in mouse models, and now we have compounded a nano-targeted chemotherapy medicine. Additionally, we will also attempt to translate this technique from high field to lower field strengths. It is important to note that we are preparing to explore ioversol pH imaging using a 3T MR scanner, as pHe imaging with iodinated agents and CEST liver imaging in patients has been recently reported [35, 36]. Future studies using this approach may provide new insights into liver cancer development and biomarkers for the clinical studies.
MATERIALS AND METHODS
Phantom preparation
One phantom contained seven micro-centrifuge tubes with 30 mM ioversol (Hengrui Medicine Co., Ltd., Jiangsu, China) in phosphate-buffered solution, titrated using HCl or NaOH, to various pH values ranging from 6.0 to 7.8 in units of 0.3. The other phantom contained six micro-centrifuge tubes of pH 7.2 ioversol, at concentrations from 10 to 60 mM, in phosphate-buffered solution. The phantoms were filled with agarose solution and solidified at 37°C.
Cell culture
The McA-RH7777 rat hepatoma cell line was purchased from the Chinese Academy of Sciences (Shanghai, China). Cells were cultured in Dulbecco’s modified Eagle’s medium (DMEM), supplemented with 10% fetal bovine serum and 2% penicillin and streptomycin, at 37˚C in a humidified atmosphere containing 5% CO2. The cell media was changed every 2 days.
Liver cancer model
All animal experiments were performed according to protocols approved by the Animal Care and Use Committee of the Medical College of Shantou University. Ten female SD rats (Shantou University Medical Center Laboratory, Shantou, China), weighing 250 to 300 g, were used for this study. SD rats were anesthetized by injecting a solution of chloral hydrate into the enterocoelia. Then, a midline mini-laparotomy was performed and the left lateral hepatic lobe was exposed. McA-RH7777 rat hepatoma cells (1 × 10⁷) were prepared in 0.05 mL of a mixture of serum-free DMEM and Matrigel, and injected into the left lateral lobe [37]. At the end of the operation, the abdominal incisions were closed using a two-layer technique, and tumors were allowed to form for 14 days.
Breast cancer model
Six MMTV-Erbb2 transgenic mice were purchased from Jackson Laboratories and bred in-house. This model carries an activated Erbb2 oncogene driven by the MMTV promoter, leading to the overexpression of constitutively active oncogenic Erbb2 in the breast [38]. These mice develop spontaneous mammary tumors after a latency period and are a good model for human breast cancer.
MRI
Experiments were performed on a 7T animal MRI scanner (Agilent, VNMRS, USA) at room temperature using a 63 mm internal diameter standard 1H volume coil (single-channel). For T2 MRI, we used a fast spin echo sequence. The parameters were as follows: relaxation time (TR) = 2000 ms; echo time (TE) = 4.1 ms; number of excitations (NEX) = 1; field of view (FOV) = 50 × 50 mm; slice thickness = 3 mm; matrix = 128 × 128. CEST images were acquired using an echo planner imaging sequence. Continuous wave RF saturation was applied for 5 s, with RF irradiation powers of 1.5, 3, 6, and 9 μT for investigating the CEST Z-spectra of phantoms, and 1.5 and 6 μT for CEST imaging. The other parameters were as follows: TR = 6.0 s; TE = 4.1 ms; NEX = 4; FOV = 30 × 30 mm for in vitro and 50 × 50 mm for in vivo experiments; slice thickness = 3 mm; matrix = 64 × 64. We obtained Z-spectra ranging from -8 to 8 ppm, at intervals of 0.31 ppm B0, and B1 field inhomogeneities were mapped and used for removing field inhomogeneity-induced artifacts during the Z-spectra reconstruction [18].
Animal preparation
During MR imaging, mice were anesthetized by inhaling a mixture of isoflurane (1.5%) and oxygen. Breathing rate was monitored throughout the in vivo MRI experiment using a respiratory gating device. Respiratory gating was performed by triggering the start of the pulse sequence soon after the end of the exhalation, with a rate of 40 breaths per min. Ioversol (dose, 4 g I/kg body weight) solution was slowly injected into the tail vein, and we acquired CEST images at two RF power 1.5 and 6.0 μT) 15 min after ioversol injection.
After MRI acquisition, mice were sacrificed and the tumor tissue were excised. Tissue was sectioned and stained with HE for microscopy.
Statistical analysis
All CEST images were analyzed using MATLAB (The Mathworks, Inc., Natick, MA, USA) [39, 40]. Z-spectra were interpolated by smoothing splines. B0-shift correction was defined as the lowest intensity point in the Z-spectrum of each voxel as the central water frequency, then the other data points in the voxel’s Z-spectrum were shifted accordingly [34]. Saturation transfer efficiency (ST%) was measured by MTRasym = (SΔω – S+Δω) / S0, and S-Δω, S+Δω, with S0 representing the water signal with a saturation frequency offset at -Δω, +Δω with and without saturation, respectively. Assessment of the pHe difference between the tumor and normal liver tissue were analyzed using Student’s t-tests, and a p < 0.05 was considered significant.
Author contributions
M.C. and R.W. designed the project; M.C. and C.C. drafted the manuscript; C.M. and Z.S. performed the MRI experiments; M.C. and C.C. performed animal studies; M.C., C.C. and X.Z. analyzed the data; R.W. critically reviewed and revised the manuscript.
ACKNOWLEDGMENTS
We thank Stanley Lin (Shantou University Medical College) for proofreading the manuscript.
FUNDING
This project was supported by the National Natural Science Foundation of China (Grant No. 81471730) and the National High Technology Research and Development Program (863 Program) of China (Program No. 2014AA021101).
REFERENCES
1. Webb BA, Chimenti M, Jacobson MP, Barber DL. Dysregulated pH: a perfect storm for cancer progression. Nat Rev Cancer. 2011; 11: 671-7. doi: 10.1038/nrc3110.
2. Gatenby RA, Gawlinski ET, Gmitro AF, Kaylor B, Gillies RJ. Acid-mediated tumor invasion: a multidisciplinary study. Cancer Res. 2006; 66: 5216-23. doi: 10.1158/0008-5472.CAN-05-4193.
3. Gatenby RA, Gillies RJ. Why do cancers have high aerobic glycolysis? Nat Rev Cancer. 2004; 4: 891-9. doi: 10.1038/nrc1478.
4. Hashim AI, Zhang X, Wojtkowiak JW, Martinez GV, Gillies RJ. Imaging pH and metastasis. NMR Biomed. 2011; 24: 582-91. doi: 10.1002/nbm.1644.
5. Estrella V, Chen T, Lloyd M, Wojtkowiak J, Cornnell HH, Ibrahim-Hashim A, Bailey K, Balagurunathan Y, Rothberg JM, Sloane BF, Johnson J, Gatenby RA, Gillies RJ. Acidity generated by the tumor microenvironment drives local invasion. Cancer Res. 2013; 73: 1524-35. doi: 10.1158/0008-5472.CAN-12-2796.
6. Gillies RJ, Gatenby RA. Hypoxia and adaptive landscapes in the evolution of carcinogenesis. Cancer Metastasis Rev. 2007; 26: 311-7. doi: 10.1007/s10555-007-9065-z.
7. Morita T, Nagaki T, Fukuda I, Okumura K. Clastogenicity of low pH to various cultured mammalian cells. Mutat Res. 1992; 268: 297-305.
8. Shi Q, Le X, Wang B, Abbruzzese JL, Xiong Q, He Y, Xie K. Regulation of vascular endothelial growth factor expression by acidosis in human cancer cells. Oncogene. 2001; 20: 3751-6. doi: 10.1038/sj.onc.1204500.
9. Bix G, Castello R, Burrows M, Zoeller JJ, Weech M, Iozzo RA, Cardi C, Thakur ML, Barker CA, Camphausen K, Iozzo RV. Endorepellin in vivo: targeting the tumor vasculature and retarding cancer growth and metabolism. J Natl Cancer Inst. 2006; 98: 1634-46. doi: 10.1093/jnci/djj441.
10. Robey IF, Baggett BK, Kirkpatrick ND, Roe DJ, Dosescu J, Sloane BF, Hashim AI, Morse DL, Raghunand N, Gatenby RA, Gillies RJ. Bicarbonate increases tumor pH and inhibits spontaneous metastases. Cancer Res. 2009; 69: 2260-8. doi: 10.1158/0008-5472.CAN-07-5575.
11. Mahoney BP, Raghunand N, Baggett B, Gillies RJ. Tumor acidity, ion trapping and chemotherapeutics. I. Acid pH affects the distribution of chemotherapeutic agents in vitro. Biochem Pharmacol. 2003; 66: 1207-18.
12. Chen LQ, Howison CM, Jeffery JJ, Robey IF, Kuo PH, Pagel MD. Evaluations of extracellular pH within in vivo tumors using acidoCEST MRI. Magn Reson Med. 2014; 72: 1408-17. doi: 10.1002/mrm.25053.
13. Raghunand N, Mahoney BP, Gillies RJ. Tumor acidity, ion trapping and chemotherapeutics. II. pH-dependent partition coefficients predict importance of ion trapping on pharmacokinetics of weakly basic chemotherapeutic agents. Biochem Pharmacol. 2003; 66: 1219-29.
14. Hassan M, Riley J, Chernomordik V, Smith P, Pursley R, Lee SB, Capala J, Gandjbakhche AH. Fluorescence lifetime imaging system for in vivo studies. Mol Imaging. 2007; 6: 229-36.
15. Vavere AL, Biddlecombe GB, Spees WM, Garbow JR, Wijesinghe D, Andreev OA, Engelman DM, Reshetnyak YK, Lewis JS. A novel technology for the imaging of acidic prostate tumors by positron emission tomography. Cancer Res. 2009; 69: 4510-6. doi: 10.1158/0008-5472.CAN-08-3781.
16. Khramtsov VV, Grigor’ev IA, Foster MA, Lurie DJ, Nicholson I. Biological applications of spin pH probes. Cell Mol Biol (Noisy-le-grand). 2000; 46: 1361-74.
17. Gillies RJ, Morse DL. In vivo magnetic resonance spectroscopy in cancer. Annu Rev Biomed Eng. 2005; 7: 287-326. doi: 10.1146/annurev.bioeng.7.060804.100411.
18. Cai K, Haris M, Singh A, Kogan F, Greenberg JH, Hariharan H, Detre JA, Reddy R. Magnetic resonance imaging of glutamate. Nat Med. 2012; 18: 302-6. doi: 10.1038/nm.2615.
19. Sherry AD, Woods M. Chemical exchange saturation transfer contrast agents for magnetic resonance imaging. Annu Rev Biomed Eng. 2008; 10: 391-411. doi: 10.1146/annurev.bioeng.9.060906.151929.
20. Song X, Airan RD, Arifin DR, Bar-Shir A, Kadayakkara DK, Liu G, Gilad AA, van Zijl PC, McMahon MT, Bulte JW. Label-free in vivo molecular imaging of underglycosylated mucin-1 expression in tumour cells. Nat Commun. 2015; 6: 6719. doi: 10.1038/ncomms7719.
21. Sun PZ, Lu J, Wu Y, Xiao G, Wu R. Evaluation of the dependence of CEST-EPI measurement on repetition time, RF irradiation duty cycle and imaging flip angle for enhanced pH sensitivity. Phys Med Biol. 2013; 58: N229-40. doi: 10.1088/0031-9155/58/17/N229.
22. Ward KM, Balaban RS. Determination of pH using water protons and chemical exchange dependent saturation transfer (CEST). Magn Reson Med. 2000; 44: 799-802.
23. Wu R, Longo DL, Aime S, Sun PZ. Quantitative description of radiofrequency (RF) power-based ratiometric chemical exchange saturation transfer (CEST) pH imaging. NMR Biomed. 2015; 28: 555-65. doi: 10.1002/nbm.3284.
24. Wu R, Liu CM, Liu PK, Sun PZ. Improved measurement of labile proton concentration-weighted chemical exchange rate (k(ws)) with experimental factor-compensated and T(1)-normalized quantitative chemical exchange saturation transfer (CEST) MRI. Contrast Media Mol Imaging. 2012; 7: 384-9. doi: 10.1002/cmmi.505.
25. Longo DL, Dastru W, Digilio G, Keupp J, Langereis S, Lanzardo S, Prestigio S, Steinbach O, Terreno E, Uggeri F, Aime S. Iopamidol as a responsive MRI-chemical exchange saturation transfer contrast agent for pH mapping of kidneys: in vivo studies in mice at 7 T. Magn Reson Med. 2011; 65: 202-11. doi: 10.1002/mrm.22608.
26. Longo DL, Michelotti F, Consolino L, Bardini P, Digilio G, Xiao G, Sun PZ, Aime S. In vitro and in vivo assessment of nonionic iodinated radiographic molecules as chemical exchange saturation transfer magnetic resonance imaging tumor perfusion agents. Invest Radiol. 2016; 51: 155-62. doi: 10.1097/RLI.0000000000000217.
27. Longo DL, Sun PZ, Consolino L, Michelotti FC, Uggeri F, Aime S. A general MRI-CEST ratiometric approach for pH imaging: demonstration of in vivo pH mapping with iobitridol. J Am Chem Soc. 2014; 136: 14333-6. doi: 10.1021/ja5059313.
28. El-Serag HB. Hepatocellular carcinoma. N Engl J Med. 2011; 365: 1118-27. doi: 10.1056/NEJMra1001683.
29. Raghunand N, Gillies RJ. pH and chemotherapy. Novartis Found Symp. 2001; 240: 199-211; discussion 65-8.
30. Moon BF, Jones KM, Chen LQ, Liu P, Randtke EA, Howison CM, Pagel MD. A comparison of iopromide and iopamidol, two acidoCEST MRI contrast media that measure tumor extracellular pH. Contrast Media Mol Imaging. 2015; 10: 446-55. doi: 10.1002/cmmi.1647.
31. Koren S, Bentires-Alj M. Breast tumor heterogeneity: source of fitness, hurdle for therapy. Mol Cell. 2015; 60: 537-46. doi: 10.1016/j.molcel.2015.10.031.
32. Longo DL, Busato A, Lanzardo S, Antico F, Aime S. Imaging the pH evolution of an acute kidney injury model by means of iopamidol, a MRI-CEST pH-responsive contrast agent. Magn Reson Med. 2013; 70: 859-64. doi: 10.1002/mrm.24513.
33. Meurer K, Kelsch B, Hogstrom B. The pharmacokinetic profile, tolerability and safety of the iodinated, non-ionic, dimeric contrast medium Iosimenol 340 injection in healthy human subjects. Acta Radiol. 2015; 56: 581-6. doi: 10.1177/0284185114534414.
34. Gharekhanloo F, Torabian S. Comparison of allergic adverse effects and contrast enhancement between iodixanol and iopromide. Iran J Radiol. 2012; 9: 63-6. doi: 10.5812/iranjradiol.7696.
35. Deng M, Chen SZ, Yuan J, Chan Q, Zhou J, Wang YX. Chemical exchange saturation transfer (CEST) MR technique for liver imaging at 3.0 Tesla: an evaluation of different offset number and an after-meal and over-night-fast comparison. Mol Imaging Biol. 2016; 18: 274-82. doi: 10.1007/s11307-015-0887-8.
36. Muller-Lutz A, Khalil N, Schmitt B, Jellus V, Pentang G, Oeltzschner G, Antoch G, Lanzman RS, Wittsack HJ. Pilot study of Iopamidol-based quantitative pH imaging on a clinical 3T MR scanner. MAGMA. 2014; 27: 477-85. doi: 10.1007/s10334-014-0433-8.
37. Gross C, Steiger K, Sayyed S, Heid I, Feuchtinger A, Walch A, Hess J, Unger K, Zitzelsberger H, Settles M, Schlitter AM, Dworniczak J, Altomonte J, et al. Model matters: differences in orthotopic rat hepatocellular carcinoma physiology determine therapy response to sorafenib. Clin Cancer Res. 2015; 21: 4440-50. doi: 10.1158/1078-0432.CCR-14-2018.
38. Muller WJ, Sinn E, Pattengale PK, Wallace R, Leder P. Single-step induction of mammary adenocarcinoma in transgenic mice bearing the activated c-neu oncogene. Cell. 1988; 54: 105-15.
39. Dai Z, Ji J, Xiao G, Yan G, Li S, Zhang G, Lin Y, Shen Z, Wu R. Magnetization transfer prepared gradient echo MRI for CEST imaging. PLoS One. 2014; 9: e112219. doi: 10.1371/journal.pone.0112219.
40. Huang D, Li S, Dai Z, Shen Z, Yan G, Wu R. Novel gradient echo sequencebased amide proton transfer magnetic resonance imaging in hyperacute cerebral infarction. Mol Med Rep. 2015; 11: 3279-84. doi: 10.3892/mmr.2015.3165.