
INTRODUCTION
Colorectal cancer is the third most common cancer worldwide, representing almost 10% of all cancer diagnoses [1]. Rectal cancer accounts for around one third of colorectal cancer cases. Standard treatment for locally advanced rectal cancer consists of neoadjuvant radiotherapy with concurrent 5-fluorouracil (5-FU)-based chemotherapy (neoadjuvant CRT), followed by surgery. Neoadjuvant CRT reduces tumour volume and decreases the risk of local recurrence [2, 3]. However, response (degree of regression) varies considerably between individuals. While approximately 20% of patients have a pathologic complete response (defined as no viable tumour cells in the surgical resection specimen), around 60% have a partial or intermediate response, and approximately 20% experience little to no regression [4–6]. The benefit of CRT for this latter patient group is therefore less clear and factors associated with response are not well understood. Importantly, the extent of tumour regression following CRT is associated with improved long-term outcome, even in the context of potentially curative surgery [7–9].
It is well established that the immune system plays an important role in cancer control and treatment response [10, 11]. Infiltration of tumours by T cells is associated with improved prognosis in many cancers [12–15] and may even be more prognostic than histological TNM stage for patients with stage I-III colorectal cancer [16]. In rectal cancer patients treated with surgery alone, a higher density of total and CD8+ T cells in the central tumour and invasive margin is associated with improved disease-free and overall survival [17], and in neoadjuvantly-treated rectal cancer, a greater pre-treatment CD8+ T cell infiltrate predicts good response to CRT [17–19]. In contrast, tumour infiltration by CD4+ regulatory T cells (Tregs), which constitutively express the transcription factor forkhead box protein 3 (Foxp3) and negatively regulate immune responses, is often associated with poorer clinical outcome [20–23].
Both chemotherapy and radiotherapy can enhance anti-tumour immunity through a range of different mechanisms, including selective depletion of Tregs [24–28]. We recently reported that, in a cohort of 128 patients who underwent neoadjuvant CRT and surgery for rectal cancer at our institution, the presence of fewer Tregs in the stroma of surgical resection specimens (post-CRT) was strongly associated with improved tumour regression [29]. Patients with a low stromal Treg density were over five times more likely to have a complete pathological response (pCR) after adjustment for clinical factors. While this may represent selective Treg depletion in these patients, an alternate hypothesis is that fewer Tregs in the local tumour environment prior to treatment may allow for effective chemoradiotherapy-induced antitumour immunity.
Here we present an evaluation of Foxp3+, CD8+ and CD3+ cell density in pre-treatment diagnostic biopsy samples from this same cohort, with the aim of determining whether pre-CRT T cell density can predict subsequent treatment response.
RESULTS
Diagnostic biopsy samples with sufficient material remaining for immunohistochemistry (IHC) analysis were obtained for 113 patients (88% of our originally reported cohort [29]). Eight cases were stained for Foxp3 and CD8 only. Six cases were judged to be of inadequate staining quality (detached/folded tissue or high non-specific background DAB staining) and were subsequently excluded (five cases for CD3 only and one case for all stains). Three cases were found to have no invasive cancer remaining in the sample and were excluded from all analyses. To minimise sampling bias, samples with a total analysis area (sum of all fragments) <1mm2 (a further three patients) were also excluded. Of the remaining 106 cases, median total tissue area analysed per sample was 6 mm2. Moderate, but significant concordance in T cell subset densities between individual biopsy fragments selected for analysis was observed (Supplementary Figure 1B).
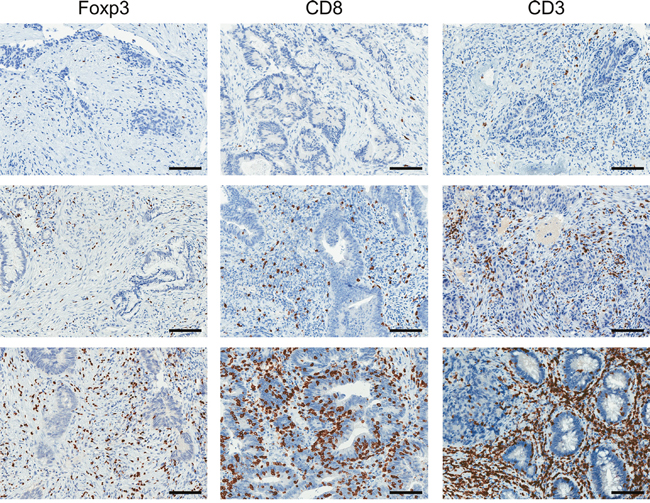
Figure 1: Identification of T cell subsets in diagnostic biopsy samples by immunohistochemistry. Representative images (from different patients) demonstrating low (top row), moderate (middle row) and high (bottom row) densities of Foxp3+, CD8+ and CD3+ cells. Scale bar, 100μm.
Pre-treatment characteristics, treatment response and infiltrating T cell densities for the 106 patients included in the analyses are shown in Table 1. The majority of patients were male and the mean age at time of surgery was 62 years. Most (83%) patients were clinical T stage 3, and 79% were assessed as having lymph node involvement on pre-treatment imaging. According to the Dworak grading system [30], 21 patients (20%) had a complete response to CRT (Dworak grade 4), 38 patients (36%) a good response (Dworak grade 3), 40 (38%) an intermediate response (Dworak grade 2) and 7 patients (6%) were classed as Dworak 1 poor responders.
Table 1: Patient characteristics
n = 106 |
|
|---|---|
Age, mean (sd) |
62 (12.3) |
Gender, n (%) |
|
male |
77 (73) |
female |
29 (27) |
Distance from anal verge (cm), mean (sd) |
7 (3.6) |
Weeks between end CRT and surgery, median (IQR) |
7 (6, 8) |
Pre-treatment clinical T stage, n (%) |
|
T2 |
7 (7) |
T3 |
86 (83) |
T4 |
11 (11) |
NR |
2 (2) |
Pre-treatment clinical N stage, n (%) |
|
N0 |
22 (21) |
N1-2 |
82 (79) |
NR |
2 (2) |
Pre-treatment clinical M stage, n (%) |
|
M0 |
95 (90) |
M1-2 |
10 (9) |
NR |
1 (1) |
Dworak grade, n (%) |
|
4 (pCR) |
21 (20) |
3 |
38 (36) |
2 |
40 (38) |
1 |
7 (6) |
Foxp3+ cell density (cells / mm2), median (range) |
427 (42, 1562) |
CD8+ cell density (cells / mm2), median (range) |
373 (29, 1814) |
CD3+ cell density (cells / mm2), median (range) |
1104 (108, 2514)* |
Abbreviations: IQR = interquartile range; NR = not recorded; pCR = pathologic complete response
* n = 93 (8 cases were stained for Foxp3 and CD8 only; a further 5 cases were excluded due to poor staining/tissue quality)
We observed considerable variation in infiltrating T cell densities between patients (Table 1, Figure 1 and Supplementary Figure 1). However, analysis of T cell subset density by Dworak grade revealed no association between pre-treatment Foxp3+, CD8+ or CD3+ cell densities and response to CRT (Figure 2). There was no significant difference in T cell subset densities when Dworak 3-4 ‘good’ responders were compared to Dworak 1-2 poor/intermediate responders, or when Dworak 4 complete responders were compared to all other groups (data not shown). There was a strong positive correlation between the density of Foxp3+ cells and CD8+ cells within individual samples (Figure 3A). As expected, densities of CD8+ and CD3+ cells, and of Foxp3+ and CD3+ cells were also strongly correlated (Figure 3B and 3C). Ratios of CD8+ to CD3+ T cells and Foxp3+ to CD8+ T cells were also assessed for correlation with tumour regression grade, but no association was found (data not shown).
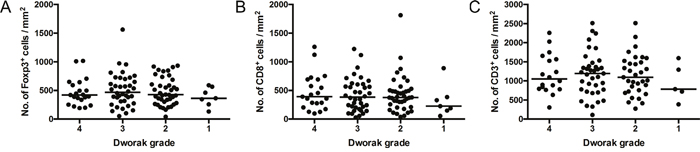
Figure 2: Pre-CRT T cell density does not predict treatment response. Foxp3+ A., CD8+ B. and CD3+ C. cell densities by tumour regression (Dworak) grade. P = NS; general linear model. Dots represent individual patients. Line at median.
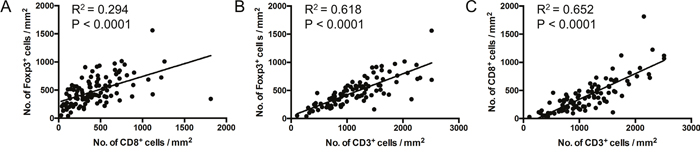
Figure 3: Correlation between T cell subset densities. Linear regression analyses. Dots represent individual patients. P < 0.05 indicates significant correlation.
We next investigated the relationship between T cell subset densities and pre-treatment clinical and demographic factors (Table 2). Gender was the only variable significantly associated with infiltrating T cells, with a higher density of Foxp3+, and CD8+ cells in biopsies from female compared to male patients.
Table 2: T cell subset densities according to pre-treatment clinical and demographic factors
Foxp3+ cell density |
CD8+ cell density |
CD3+ cell density |
||||||||
|---|---|---|---|---|---|---|---|---|---|---|
Low |
High |
P |
Low |
High |
P |
Low |
High |
P |
||
Age |
≥ 65 |
24 (47) |
27 (53) |
0.560 |
24 (47) |
27 (53) |
0.560 |
20 (45) |
24 (55) |
0.353 |
< 65 |
29 (53) |
26 (47) |
29 (53) |
26 (47) |
27 (55) |
22 (45) |
||||
Gender |
Male |
44 (57) |
33 (43) |
0.017 |
44 (57) |
33 (43) |
0.017 |
36 (55) |
30 (45) |
0.227 |
Female |
9 (31) |
20 (69) |
9 (31) |
20 (69) |
11 (41) |
16 (59) |
||||
Distance from anal verge |
≥ 7cm |
28 (49) |
29 (51) |
0.846 |
28 (49) |
29 (51) |
0.846 |
25 (50) |
25 (50) |
0.911 |
< 7cm |
25 (51) |
24 (49) |
25 (51) |
24 (49) |
22 (51) |
21 (49) |
||||
Clinical T stage |
T2 |
4 (57) |
3 (43) |
0.246 |
2 (29) |
5 (71) |
0.395 |
1 (17) |
5 (83) |
0.207 |
T3 |
40 (47) |
46 (53) |
43 (50) |
43 (50) |
39(52) |
36(48) |
||||
T4 |
8 (73) |
3 (27) |
7 (64) |
4 (36) |
6(60) |
4(40) |
||||
Clinical N stage |
N0 |
14 (64) |
8 (36) |
0.150 |
12 (55) |
10(45) |
0.631 |
10 (48) |
11 (52) |
0.759 |
N1-2 |
38 (45) |
44 (54) |
40 (49) |
42 (51) |
36 (51) |
34 (49) |
||||
Clinical M stage |
M0 |
47 (49) |
48 (51) |
0.742 |
47 (49) |
48 (51) |
0.975 |
41 (49) |
43 (51) |
0.714 |
M1-2 |
6 (60) |
4 (40) |
5 (50) |
5 (50) |
5 (63) |
3 (37) |
||||
Bold text denotes significant associations (P < 0.05)
Visual inspection of IHC images suggested that Foxp3+ T cells were located primarily in the stroma, rarely infiltrating the epithelial tissue (Figure 4A). Linear regression analysis confirmed an inversely proportional relationship between Foxp3+ T cell density and estimated epithelial content (Figure 4C). However, adjusting for epithelial content did not reveal any association between Foxp3+ T cell density and Dworak grade (data not shown).
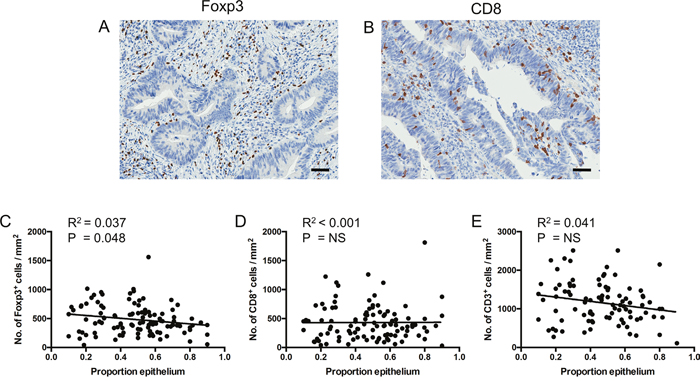
Figure 4: Foxp3+ cell density is inversely proportional to epithelial content. A and B. Representative images (from different patients) demonstrating Foxp3+ cells located in the stroma (A) and CD8+ cells infiltrating the epithelium (B). Scale bar, 50μm. C to E. Linear regression analyses of T cell subset density by estimated epithelial tissue content across fragments. Dots represent individual patients. Data represent totals across all fragments analysed. NS = not significant.
Median follow up duration from surgery for this patient group was 78 months, with 5-year cancer-specific survival (CSS) and recurrence-free survival (RFS) of 87% and 83% respectively. Kaplan-Meier survival analysis demonstrated that pre-treatment T cell density had no prognostic value in this patient group (Figure 5).
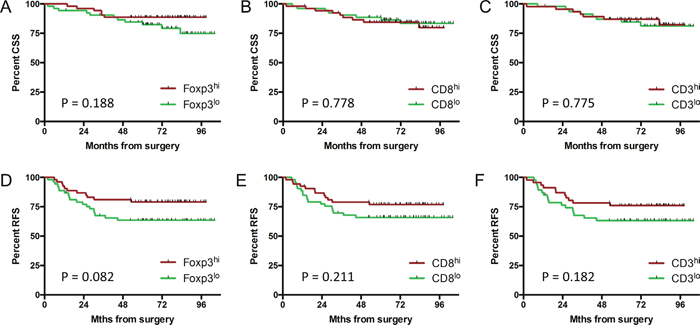
Figure 5: Pre-CRT T cell density is not associated with long-term survival. Kaplan-Meier estimates for cancer-specific A-C. and recurrence-free survival D-F. by T cell subset density. Groups were split at the median value. P = NS; log-rank test.
These data, together with our previous finding that a low stromal Foxp3+ Treg density post-CRT was associated with greater tumour regression in this cohort [29], suggest that the impact of CRT on anti-tumour immunity may be more important than the state of the pre-existing local immune response. We divided the cohort into four groups according to Treg density in the pre-treatment biopsy samples and in the post-treatment stroma (high/high, low/high, high/low, and low/low). While only 10% of patients who achieved a Dworak 4 pCR had a stromal Treg density higher than the median value post-CRT, patients in this group were equally likely to have a high or low Treg density pre-CRT (Figure 6). Similarly, while only 14% of Dworak 1 poor responders had a low stromal Treg density post CRT, the percentage of patients in this group with a high vs low pre-CRT Treg density was 43% vs 57% respectively.
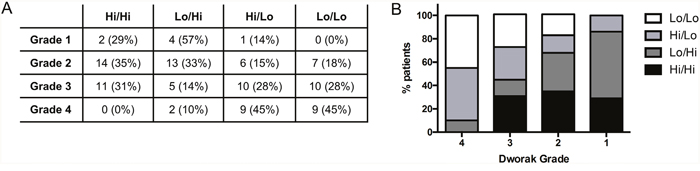
Figure 6: Foxp3+ cell density pre and post-CRT. Patients with available data at both biopsy and resection (n = 103) were divided into four groups based on the density of Foxp3+ cells in the pre-treatment biopsy sample and in the stroma at resection (high versus low, split at the median value). The frequency A. and percentage (A) and B. of patients in each group by Dworak grade.
DISCUSSION
In this study, we investigated the relationship between T cell subset density in pre-treatment diagnostic biopsies and response to neoadjuvant CRT in 106 patients with locally advanced rectal cancer. We hypothesised that an existing local anti-tumour immune response dominated by CD8+ cells rather than Tregs would ‘set the scene’ for effective CRT-induced anti-tumour immunity, and therefore better treatment response. Despite considerable inter-patient variation in T cell subset densities, we found no association between Foxp3+, CD8+ or CD3+ cell density (or ratios of T cell subsets) in pre-treatment biopsies and tumour regression grade or long-term survival.
T cell subset densities did not differ according to clinical tumour or nodal stage, or the presence / absence of distant metastases as determined by pre-treatment imaging. The only clinical or demographic variable significantly associated with T cell subset density was gender, with females having a more pronounced infiltrate of Foxp3+and CD8+ cells. While an interesting observation, this finding is unlikely to be clinically important since there was no gender-specific difference in CRT response or survival in this, or in previously studied cohorts [18, 19, 29, 31] (data not shown).
We were not able to replicate the finding from previous similar studies that a high density of CD8+ T cells prior to neoadjuvant treatment is associated with good response [17–19]. A key difference between these studies and ours is that we assessed T cell subset densities objectively across entire tissue fragments using image analysis software (Supplementary Figure 2), whereas the studies by Teng et al and Yasuda et al determined T cell subset densities by visual scoring of randomly selected high power fields [18, 19]. Anitei et al used image analysis software, but calculated cell density based on the average of the three most infiltrated areas [17]. Also, over 99% of our patients received concurrent chemotherapy, compared to 76% in the study reported by Anitei et al (24% receiving radiotherapy alone) [17]. Another possible reason for discordance with these previous studies could be the different systems used for assessing response to CRT. While Teng et al also used the Dworak system, Anitei et al used a modified three-tier grading system based on tumour-fibrosis ratio [32] and Yasuda et al evaluated response according to the Japanese Classification of Colorectal Carcinoma [33]. Importantly, there is inherent imprecision in current systems used to assess tumour regression following neoadjuvant therapy due to the subjective nature of terms used (such as ‘few tumour cells’, ‘easy to find’ and ‘significant fibrosis’), leaving them open to individual interpretation. This subjectivity could also explain the relatively low proportion of patients classed as Dworak 1 poor responders in our cohort, compared to some previous studies [4–6].
In another recent study, Shinto et al found a high CD8/Foxp3 ratio pre-CRT to be predictive of improved tumour regression [34]. However, patients in that study received short-course CRT (20 Gy given over 5 days with concurrent uracil over 7 days) and surgery 30 days later, rather than long-course CRT (50.4 Gy over 5 weeks with concurrent 5-FU-based chemotherapy) as received by patients in our cohort. Complete response is less common after short-course CRT and tumour regression can continue for up to 12 weeks following long-course CRT [35], thus these reported results may not be relevant to long-course CRT.
In the context of long-course CRT, the impact of chemotherapy and/or radiotherapy on anti-tumour immunity may be more important than the state of the pre-existing local immune response. In this same patient cohort, we recently demonstrated that a low density of Foxp3+ Tregs within the tumour stroma following neoadjuvant CRT was strongly associated with pCR [29]. Indeed, when both pre- and post-treatment Treg density was taken into account in the current study, while 90% of the Dworak 4 complete responders had a post-CRT stromal Treg density below the median value, the number of patients with a high versus low pre-CRT Treg density in this group was equal.
Tregs undergo rapid turnover relative to other T cell subsets and are selectively depleted by several chemotherapy drugs, including 5-FU [28, 36, 37]. It is possible that selective depletion of Tregs during CRT in some patients may create a ‘window of opportunity’ for enhanced anti-tumour immunity, contributing to tumour regression. However, we cannot rule out that an increased presence of Tregs surrounding poor responding tumours post-CRT simply reflects an immune response to residual tumour. The anti-tumour immune response is also inherently complex. It may be that the functional status of T cells within the tumour microenvironment prior to CRT, and/or their interaction with other cell types, is more important than simply the density of the major T cell subsets. We plan to address this in a second similar cohort.
Although tumour-infiltrating Foxp3+ cells are associated with poor prognosis in most solid cancers [20–23], their presence in colorectal cancer has proven to be a good prognostic factor in several independent studies [38–40]. Treg expansion in this context may simply represent an indirect measure of anti-tumour immunity (in response to CD8+ T cell activation); the densities of these subsets do often correlate [39, 41, 42]. It has also been proposed that Tregs limit the pro-tumour effects of Th17-mediated inflammation, driven by the presence of gut bacteria [43, 44]. Alternatively, the positive impact of Foxp3+ T cells in the gut may be due to a subset of non-suppressive effector/memory T cells that express Foxp3 at lower levels. These are found in higher numbers in colorectal tumours than in other cancers, but cannot be distinguished from suppressive Tregs using standard immunohistochemical methods [45]. A weakness of the current study is that, as we too were using standard IHC, our staining could not differentiate Tregs from other Foxp3-expressing cell subsets.
The study was powered to detect a 15% change in response rate on the continuum between lowest and highest cell subset density with 90% power at a 5% significance level (100 observations required). We cannot exclude the possibility that more subtle associations with response could be revealed with a larger cohort.
In conclusion, we show that Foxp3+ cell density in the tumour microenvironment prior to CRT did not predict tumour regression in locally advanced rectal cancer. Further work in this area is required to investigate the potential role of the immune system in mediating response to CRT.
MATERIALS AND METHODS
Patients
Consecutive patients with rectal adenocarcinoma treated between 2006 and 2010 with long-course neoadjuvant 5-fluorouracil (5-FU)-based CRT and surgery were identified from our prospectively maintained institutional database. Clinical data collection, treatment and follow up have been described previously [29]. Dworak tumour regression grade [30] was assigned by the gastrointestinal pathologists at the time of routine pathology reporting, and subsequently verified by a single pathologist.
Grade 4: no tumour cells, only fibrotic mass (pCR)
Grade 3: very few (difficult to find microscopically) tumour cells in fibrotic tissue
Grade 2: dominantly fibrotic changes with few tumour cells or groups (easy to find)
Grade 1: dominant tumour mass with obvious fibrosis and/or vasculopathy
Grade 0: no regression
Immunohistochemistry
Archived pre-treatment diagnostic biopsy material (formalin-fixed paraffin-embedded (FFPE) tissue) was obtained. Where there was sufficient material remaining, 4μm sections were cut and stained for Foxp3, CD8 and CD3 by standard immunohistochemistry (IHC), as previously described [29]. Slides were scanned at 40x magnification using a high-resolution digital scanner (Aperio Scanscope XT; Leica Biosystems, North Ryde, NSW, Australia). A specialist gastrointestinal histopathologist (CH) reviewed corresponding H&E slides for all cases and selected up to three fragments containing invasive cancer for digital image analysis (Supplementary Figure 2A). For each fragment, the proportion of epithelial tissue was also estimated to the nearest 10% (or 5% if <10%).
Digital image analysis
Evaluation of Foxp3+, CD8+ and CD3+ T cell density (cells / mm2 tissue) was performed using StrataQuest version 5 (TissueGnostics, Taborstraße, Vienna, Austria), as shown in Supplementary Figure 2B-2D. All images were evaluated for staining quality before digital analysis. Data represent the total density across all fragments (total number of positive cells / total area).
To assess possible differences in automated compared to visual cell counts, ten small regions of interest (ROI; mean area 0.88 mm2) were selected on the digital images of Foxp3-stained biopsies for comparison of counting methods. Three independent observers assessed Foxp3+ cell count and the regions were then subjected to automated image analysis. A high level of correlation was observed between the visual and automated methods, as well as between independent observers (Supplementary Figure 3).
Statistical analysis
Differences in T cell density between response groups, and associations between clinical/demographic variables and T cell density, were assessed using general linear models. Survival analyses were performed using the Kaplan-Meier method with curves compared using the log-rank test. Associations between clinical variables and T cell densities were assessed using the chi-square test, or Fisher’s exact test where there were fewer than 5 observations in any group. To compare high vs low T cell subset densities, the group was split at the median value. Differences and associations were considered statistically significant where P < 0.05. Median follow up time was calculated using the reverse Kaplan-Meier method. Analyses were performed using SAS version 9.4 (SAS Institute Inc, Cary, NC, USA) and GraphPad Prism version 6.0 (GraphPad software Inc, San Diego, CA, USA).
Ethical statement
The study was approved by the St John of God Health Care Human Research Ethics Committee and conducted in accordance with the Declaration of Helsinki. All patients gave written informed consent for their biospecimens and health information to be used for research purposes.
Abbreviations
5-FU: 5-fluorouracil; CRT: chemoradiotherapy; FFPE: formalin-fixed paraffin-embedded; IHC: immunohistochemistry; NS: not significant; pCR: pathological complete response; TILs: tumour-infiltrating lymphocytes; Tregs: regulatory T cells
ACKNOWLEDGMENTS
We would like to thank David Raven, Kathryn Louwen and Kyla Ransted of St John of God Pathology for their help with sample preparation and staining; Dr Tim Threlfall of the Western Australian Cancer Registry and Cheryl Penter of St John of God Subiaco Hospital for assistance with the data collection; and TissueGnostics for their assistance with the image analysis.
CONFLICTS OF INTEREST
The authors have no conflicts of interest to declare.
GRANT SUPPORT
This work was supported by the Cancer Council Western Australia (Grant ID 1048279), the Raine Medical Research Foundation, the St John of God Foundation, the Colorectal Surgical Society of Australia and New Zealand (CSSANZ) and the Tonkinson Foundation for Colorectal Cancer Research.
REFERENCES
1. Ferlay J, Soerjomataram I, Dikshit R, Eser S, Mathers C, Rebelo M, Parkin DM, Forman D, Bray F. Cancer incidence and mortality worldwide: sources, methods and major patterns in GLOBOCAN 2012. Int J Cancer. 2015; 136: E359-386.
2. Gerard JP, Conroy T, Bonnetain F, Bouche O, Chapet O, Closon-Dejardin MT, Untereiner M, Leduc B, Francois E, Maurel J, Seitz JF, Buecher B, Mackiewicz R, et al. Preoperative radiotherapy with or without concurrent fluorouracil and leucovorin in T3-4 rectal cancers: results of FFCD 9203. J Clin Oncol. 2006; 24: 4620-4625.
3. Sauer R, Liersch T, Merkel S, Fietkau R, Hohenberger W, Hess C, Becker H, Raab HR, Villanueva MT, Witzigmann H, Wittekind C, Beissbarth T, Rodel C. Preoperative versus postoperative chemoradiotherapy for locally advanced rectal cancer: results of the German CAO/ARO/AIO-94 randomized phase III trial after a median follow-up of 11 years. J Clin Oncol. 2012; 30: 1926-1933.
4. Agarwal A, Chang GJ, Hu CY, Taggart M, Rashid A, Park IJ, You YN, Das P, Krishnan S, Crane CH, Rodriguez-Bigas M, Skibber J, Ellis L, et al. Quantified pathologic response assessed as residual tumor burden is a predictor of recurrence-free survival in patients with rectal cancer who undergo resection after neoadjuvant chemoradiotherapy. Cancer. 2013; 119: 4231-4241.
5. Fokas E, Liersch T, Fietkau R, Hohenberger W, Beissbarth T, Hess C, Becker H, Ghadimi M, Mrak K, Merkel S, Raab HR, Sauer R, Wittekind C, et al. Tumor regression grading after preoperative chemoradiotherapy for locally advanced rectal carcinoma revisited: updated results of the CAO/ARO/AIO-94 trial. J Clin Oncol. 2014; 32: 1554-1562.
6. Huebner M, Wolff BG, Smyrk TC, Aakre J, Larson DW. Partial pathologic response and nodal status as most significant prognostic factors for advanced rectal cancer treated with preoperative chemoradiotherapy. World J Surg. 2012; 36: 675-683.
7. Lee YC, Hsieh CC, Chuang JP. Prognostic significance of partial tumor regression after preoperative chemoradiotherapy for rectal cancer: a meta-analysis. Dis Colon Rectum. 2013; 56: 1093-1101.
8. Martin ST, Heneghan HM, Winter DC. Systematic review and meta-analysis of outcomes following pathological complete response to neoadjuvant chemoradiotherapy for rectal cancer. Br J Surg. 2012; 99: 918-928.
9. McCoy MJ, Hemmings C, Hillery S, Penter C, Bulsara MK, Zeps N, Platell CF. Neoadjuvant chemoradiotherapy for rectal cancer: how important is tumour regression? ANZ J Surg. 2015.
10. McDonnell AM, Nowak AK, Lake RA. Contribution of the immune system to the chemotherapeutic response. Semin Immunopathol. 2011; 33: 353-367.
11. Zitvogel L, Galluzzi L, Smyth MJ, Kroemer G. Mechanism of action of conventional and targeted anticancer therapies: reinstating immunosurveillance. Immunity. 2013; 39: 74-88.
12. Cho Y, Miyamoto M, Kato K, Fukunaga A, Shichinohe T, Kawarada Y, Hida Y, Oshikiri T, Kurokawa T, Suzuoki M, Nakakubo Y, Hiraoka K, Murakami S, et al. CD4+ and CD8+ T cells cooperate to improve prognosis of patients with esophageal squamous cell carcinoma. Cancer Res. 2003; 63: 1555-1559.
13. Hiraoka K, Miyamoto M, Cho Y, Suzuoki M, Oshikiri T, Nakakubo Y, Itoh T, Ohbuchi T, Kondo S, Katoh H. Concurrent infiltration by CD8+ T cells and CD4+ T cells is a favourable prognostic factor in non-small-cell lung carcinoma. Br J Cancer. 2006; 94: 275-280.
14. Loi S, Sirtaine N, Piette F, Salgado R, Viale G, Van Eenoo F, Rouas G, Francis P, Crown JP, Hitre E, de Azambuja E, Quinaux E, Di Leo A, et al. Prognostic and predictive value of tumor-infiltrating lymphocytes in a phase III randomized adjuvant breast cancer trial in node-positive breast cancer comparing the addition of docetaxel to doxorubicin with doxorubicin-based chemotherapy: BIG 02-98. J Clin Oncol. 2013; 31: 860-867.
15. Zhang L, Conejo-Garcia JR, Katsaros D, Gimotty PA, Massobrio M, Regnani G, Makrigiannakis A, Gray H, Schlienger K, Liebman MN, Rubin SC, Coukos G. Intratumoral T cells, recurrence, and survival in epithelial ovarian cancer. N Engl J Med. 2003; 348: 203-213.
16. Mlecnik B, Tosolini M, Kirilovsky A, Berger A, Bindea G, Meatchi T, Bruneval P, Trajanoski Z, Fridman WH, Pages F, Galon J. Histopathologic-based prognostic factors of colorectal cancers are associated with the state of the local immune reaction. J Clin Oncol. 2011; 29: 610-618.
17. Anitei MG, Zeitoun G, Mlecnik B, Marliot F, Haicheur N, Todosi AM, Kirilovsky A, Lagorce C, Bindea G, Ferariu D, Danciu M, Bruneval P, Scripcariu V, et al. Prognostic and predictive values of the immunoscore in patients with rectal cancer. Clin Cancer Res. 2014; 20: 1891-1899.
18. Teng F, Meng X, Kong L, Mu D, Zhu H, Liu S, Zhang J, Yu J. Tumor-infiltrating lymphocytes, forkhead box P3, programmed death ligand-1, and cytotoxic T lymphocyte-associated antigen-4 expressions before and after neoadjuvant chemoradiation in rectal cancer. Transl Res. 2015; 166: 721-732 e721.
19. Yasuda K, Nirei T, Sunami E, Nagawa H, Kitayama J. Density of CD4(+) and CD8(+) T lymphocytes in biopsy samples can be a predictor of pathological response to chemoradiotherapy (CRT) for rectal cancer. Radiat Oncol. 2011; 6.
20. Bates GJ, Fox SB, Han C, Leek RD, Garcia JF, Harris AL, Banham AH. Quantification of regulatory T cells enables the identification of high-risk breast cancer patients and those at risk of late relapse. J Clin Oncol. 2006; 24: 5373-5380.
21. Curiel TJ, Coukos G, Zou L, Alvarez X, Cheng P, Mottram P, Evdemon-Hogan M, Conejo-Garcia JR, Zhang L, Burow M, Zhu Y, Wei S, Kryczek I, et al. Specific recruitment of regulatory T cells in ovarian carcinoma fosters immune privilege and predicts reduced survival. Nat Med. 2004; 10: 942-949.
22. Mougiakakos D, Johansson CC, Trocme E, All-Ericsson C, Economou MA, Larsson O, Seregard S, Kiessling R. Intratumoral forkhead box P3-positive regulatory T cells predict poor survival in cyclooxygenase-2-positive uveal melanoma. Cancer. 2010; 116: 2224-2233.
23. Shimizu K, Nakata M, Hirami Y, Yukawa T, Maeda A, Tanemoto K. Tumor-infiltrating Foxp3+ regulatory T cells are correlated with cyclooxygenase-2 expression and are associated with recurrence in resected non-small cell lung cancer. J Thorac Oncol. 2010; 5: 585-590.
24. Burnette BC, Liang H, Lee Y, Chlewicki L, Khodarev NN, Weichselbaum RR, Fu YX, Auh SL. The efficacy of radiotherapy relies upon induction of type i interferon-dependent innate and adaptive immunity. Cancer Res. 2011; 71: 2488-2496.
25. Frey B, Stache C, Rubner Y, Werthmoller N, Schulz K, Sieber R, Semrau S, Rodel F, Fietkau R, Gaipl US. Combined treatment of human colorectal tumor cell lines with chemotherapeutic agents and ionizing irradiation can in vitro induce tumor cell death forms with immunogenic potential. J Immunotoxicol. 2012; 9: 301-313.
26. Ghiringhelli F, Menard C, Puig PE, Ladoire S, Roux S, Martin F, Solary E, Le Cesne A, Zitvogel L, Chauffert B. Metronomic cyclophosphamide regimen selectively depletes CD4+CD25+ regulatory T cells and restores T and NK effector functions in end stage cancer patients. Cancer Immunol Immunother. 2007; 56: 641-648.
27. Gupta A, Probst HC, Vuong V, Landshammer A, Muth S, Yagita H, Schwendener R, Pruschy M, Knuth A, van den Broek M. Radiotherapy promotes tumor-specific effector CD8+ T cells via dendritic cell activation. J Immunol. 2012; 189: 558-566.
28. Rettig L, Seidenberg S, Parvanova I, Samaras P, Curioni A, Knuth A, Pascolo S. Gemcitabine depletes regulatory T-cells in human and mice and enhances triggering of vaccine-specific cytotoxic T-cells. Int J Cancer. 2011; 129: 832-838.
29. McCoy MJ, Hemmings C, Miller TJ, Austin SJ, Bulsara MK, Zeps N, Nowak AK, Lake RA, Platell CF. Low stromal Foxp3+ regulatory T-cell density is associated with complete response to neoadjuvant chemoradiotherapy in rectal cancer. Br J Cancer. 2015; 113: 1677-1686.
30. Dworak O, Keilholz L, Hoffmann A. Pathological features of rectal cancer after preoperative radiochemotherapy. Int J Colorectal Dis. 1997; 12: 19-23.
31. Garland ML, Vather R, Bunkley N, Pearse M, Bissett IP. Clinical tumour size and nodal status predict pathologic complete response following neoadjuvant chemoradiotherapy for rectal cancer. Int J Colorectal Dis. 2014; 29: 301-307.
32. Ryan R, Gibbons D, Hyland JM, Treanor D, White A, Mulcahy HE, O'Donoghue DP, Moriarty M, Fennelly D, Sheahan K. Pathological response following long-course neoadjuvant chemoradiotherapy for locally advanced rectal cancer. Histopathology. 2005; 47: 141-146.
33. Japanese Classification of Colorectal Carcinoma. 2009: Tokyo: Kanehara.
34. Shinto E, Hase K, Hashiguchi Y, Sekizawa A, Ueno H, Shikina A, Kajiwara Y, Kobayashi H, Ishiguro M, Yamamoto J. CD8+ and FOXP3+ tumor-infiltrating T cells before and after chemoradiotherapy for rectal cancer. Ann Surg Oncol. 2014; 21: S414-421.
35. Glimelius B. Optimal Time Intervals between Pre-Operative Radiotherapy or Chemoradiotherapy and Surgery in Rectal Cancer? Front Oncol. 2014; 4.
36. Maeda K, Hazama S, Tokuno K, Kan S, Maeda Y, Watanabe Y, Kamei R, Shindo Y, Maeda N, Yoshimura K, Yoshino S, Oka M. Impact of chemotherapy for colorectal cancer on regulatory T-cells and tumor immunity. Anticancer Res. 2011; 31: 4569-4574.
37. van der Most RG, Currie AJ, Mahendran S, Prosser A, Darabi A, Robinson BW, Nowak AK, Lake RA. Tumor eradication after cyclophosphamide depends on concurrent depletion of regulatory T cells: a role for cycling TNFR2-expressing effector-suppressor T cells in limiting effective chemotherapy. Cancer Immunol Immunother. 2009; 58: 1219-1228.
38. Correale P, Rotundo MS, Del Vecchio MT, Remondo C, Migali C, Ginanneschi C, Tsang KY, Licchetta A, Mannucci S, Loiacono L, Tassone P, Francini G, Tagliaferri P. Regulatory (FoxP3+) T-cell tumor infiltration is a favorable prognostic factor in advanced colon cancer patients undergoing chemo or chemoimmunotherapy. J Immunother. 2010; 33: 435-441.
39. Frey DM, Droeser RA, Viehl CT, Zlobec I, Lugli A, Zingg U, Oertli D, Kettelhack C, Terracciano L, Tornillo L. High frequency of tumor-infiltrating FOXP3(+) regulatory T cells predicts improved survival in mismatch repair-proficient colorectal cancer patients. Int J Cancer. 2010; 126: 2635-2643.
40. Salama P, Phillips M, Grieu F, Morris M, Zeps N, Joseph D, Platell C, Iacopetta B. Tumor-infiltrating FOXP3+ T regulatory cells show strong prognostic significance in colorectal cancer. J Clin Oncol. 2009; 27: 186-192.
41. Michel S, Benner A, Tariverdian M, Wentzensen N, Hoefler P, Pommerencke T, Grabe N, von Knebel Doeberitz M, Kloor M. High density of FOXP3-positive T cells infiltrating colorectal cancers with microsatellite instability. Br J Cancer. 2008; 99: 1867-1873.
42. Yoon HH, Orrock JM, Foster NR, Sargent DJ, Smyrk TC, Sinicrope FA. Prognostic impact of FoxP3+ regulatory T cells in relation to CD8+ T lymphocyte density in human colon carcinomas. PLoS One. 2012; 7: e42274.
43. Liu J, Duan Y, Cheng X, Chen X, Xie W, Long H, Lin Z, Zhu B. IL-17 is associated with poor prognosis and promotes angiogenesis via stimulating VEGF production of cancer cells in colorectal carcinoma. Biochem Biophys Res Commun. 2011; 407: 348-354.
44. Tosolini M, Kirilovsky A, Mlecnik B, Fredriksen T, Mauger S, Bindea G, Berger A, Bruneval P, Fridman WH, Pages F, Galon J. Clinical impact of different classes of infiltrating T cytotoxic and helper cells (Th1, th2, treg, th17) in patients with colorectal cancer. Cancer Res. 2011; 71: 1263-1271.
45. Saito T, Nishikawa H, Wada H, Nagano Y, Sugiyama D, Atarashi K, Maeda Y, Hamaguchi M, Ohkura N, Sato E, Nagase H, Nishimura J, Yamamoto H, et al. Two FOXP3(+)CD4(+) T cell subpopulations distinctly control the prognosis of colorectal cancers. Nat Med. 2016; 22: 679-684.