
INTRODUCTION
The anion exchanger (AE) is a transmembrane protein that exchanges chloride (Cl-) for bicarbonate (HCO3-) via the cell membrane, and is involved in the regulation of transepithelial ion transport and maintenance of intracellular pH [1, 2, 3]. Three isoforms of the AE have been identified to date: AE1, AE2, and AE3. Although these isoforms differ in their cytoplasmic (N-terminal) and membrane-spanning domains (C-terminal), their roles in anion transport are similar [1, 4, 5]. The expression of AE2 is reportedly ubiquitous, whereas that of AE1 is restricted to the erythrocyte cell membrane and basolateral surface of alpha-intercalated cells in the collecting duct of the kidney. AE3 is expressed in the brain, retina, and heart [3, 6].
Several recent studies described important roles for AE in tumorigenesis, differentiation, survival, and invasion [7–11]. AE1 was unexpectedly found to be expressed and important for cell cycle progression in gastric and colonic cancers, and high AE1 levels have been associated with a poor prognosis [3, 5]. The small interfering RNA (siRNA)-mediated suppression of AE1 has inhibited the growth of gastric carcinoma in in vitro [3, 5, 8, 9] and in vivo studies [12], indicating its potential as a target for cancer therapy. However, the roles of AE1 in the carcinogenesis, development, and progression of esophageal squamous cell carcinoma (ESCC) remain unclear. Moreover, the clinical significance of AE1 expressing in human ESCC has not yet been examined.
The aims of this research were to determine the roles of AE1 in the control of tumorigenesis related genes and its clinical meaning in esophageal cancer. By analyzing the AE1 expression in human ESCC tissues, relationships with the clinicopathological features and prognosis of ESCC patients were investigated. In addition, microarray data revealed that the knocking down with AE1 siRNA affected a lot of genes related to mitogen-activated protein kinase (MAPK) and Hedgehog signaling.
RESULTS
Immunohistochemical analysis of AE1 expression in ESCC tumors
An immunohistochemistry for the AE1 protein revealed that AE1 expression was mainly observed in the lower and middle layer of the non-cancerous esophageal epithelia, and not detected in the basal and para-basal cell layers (Figure 1A). In ESCC tissues, the AE1 protein was chiefly expressed in the cell membranes or cytoplasm of cancer cells (Figure 1B). The median AE1 score was 1.8 (range=0-2.2; mean±standard deviation (SD) = 1.54±0.60), and patients were categorized into low (scores <1.8, n=28) and high expression groups (scores≥1.8, n=33) (Figure 1C–1D, Supplementary Figure 1A–1B). In the analysis of their clinicopathological features, the AE1 expression correlated with tumor length (Table 1).
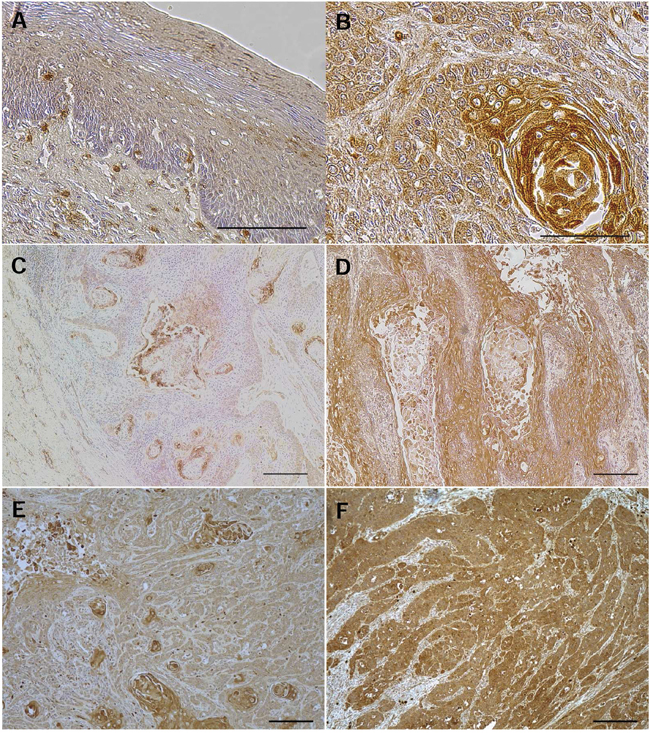
Figure 1: AE1 protein expression in human ESCCs. A. Immunohistochemical staining of human esophageal epithelia with an AE1 antibody. Cells expressing AE1 were primarily confined to the lower and middle layers of the squamous epithelium, with the exception of the basal and parabasal cell layers. Magnification: ×400. Bar 100 μm. B. Immunohistochemical staining of primary human ESCC samples with the AE1 antibody. Magnification: ×400. Bar 100 μm. C. Immunohistochemical staining of primary human ESCC samples with the low grade expression of AE1. Magnification: ×100. Bar 200 μm. D. Immunohistochemical staining of primary human ESCC samples with the high grade expression of AE1. Magnification: ×100. Bar 200 μm. E. Immunohistochemical staining of primary human ESCC samples with focal AE1 expression. Magnification: ×100. Bar 200 μm. F. Immunohistochemical staining of primary human ESCC samples with diffuse AE1 expression. Magnification: ×100. Bar 200 μm.
Table 1: Relationships between clinicopathological features of ESCC and expression of AE1
Variable |
Staining score |
p value |
Distribution |
p value |
||
|---|---|---|---|---|---|---|
Low (n=28) |
High (n=33) |
Focal (n=22) |
Diffuse (n=39) |
|||
Gender |
||||||
Male |
24 |
28 |
0.9243 |
19 |
33 |
0.8533 |
Female |
4 |
5 |
3 |
6 |
||
Age |
||||||
<65 years |
16 |
21 |
0.6049 |
13 |
24 |
0.851 |
≥65 years |
12 |
12 |
9 |
15 |
||
Tumor length |
||||||
<50 mm |
22 |
18 |
0.0491* |
14 |
26 |
0.811 |
≥50 mm |
6 |
15 |
8 |
13 |
||
Histological type |
||||||
Well/moderately differentiated SCC |
19 |
25 |
0.4928 |
20 |
24 |
0.0140* |
Poorly differentiated SCC |
9 |
8 |
2 |
15 |
||
Lymphatic invasion |
||||||
Negative |
12 |
16 |
0.6603 |
9 |
19 |
0.5567 |
Positive |
16 |
17 |
13 |
20 |
||
Venous invasion |
||||||
Negative |
15 |
21 |
0.4257 |
13 |
23 |
0.9929 |
Positive |
13 |
12 |
9 |
16 |
||
pT |
||||||
pT1 |
15 |
12 |
0.1775 |
6 |
21 |
0.0448* |
pT2-3 |
13 |
21 |
16 |
18 |
||
pN |
||||||
pN0 |
11 |
16 |
0.471 |
13 |
14 |
0.0799 |
pN1-3 |
17 |
17 |
9 |
25 |
||
SCC: squamous cell carcinoma; pT: pathological T stage; pN: pathological N stage.
*p<0.05: chi-squared test.
Next, we focused on the pattern of the distribution of AE1-expressing cells. Patients were categorized into 2 groups based on the distribution pattern: focal AE1 expression (n=22) and diffuse AE1 expression (n=39) (Figure 1E–1F, Supplementary Figure 1C–1D). In the analysis of their clinicopathological features, relationships were observed between the distribution pattern of AE1 and the histological degree of the differentiation of SCC or pT category (Table 1). Regarding pN category, frequency of lymph node metastasis tended to be higher in patents with diffuse AE1 expression (64.1%) than those with focal expression (40.9%) without significant difference (Table 1).
We then investigated the prognostic significance of AE1 expression after curative resection. We determined which of the 10 variables (gender, age, tumor length, histological degree of the differentiation of SCC, lymphatic invasion, venous invasion, pT and pN categories, AE1 staining, and AE1 distribution) influenced survival. A univariate analysis showed that venous invasion, the pT and pN categories significantly correlated with prognosis (p=0.033, 0.002, and 0.032, respectively) (Table 2). The AE1 staining score itself did not correlate with prognosis (Figure 2A, Table 2). Regarding the distribution pattern of AE1, the 5-year survival rate of the diffuse AE1 expression group (64.3%) was poorer than that of the focal AE1 expression group (81.3%), but not significantly (p = 0.176) (Figure 2B, Table 2).
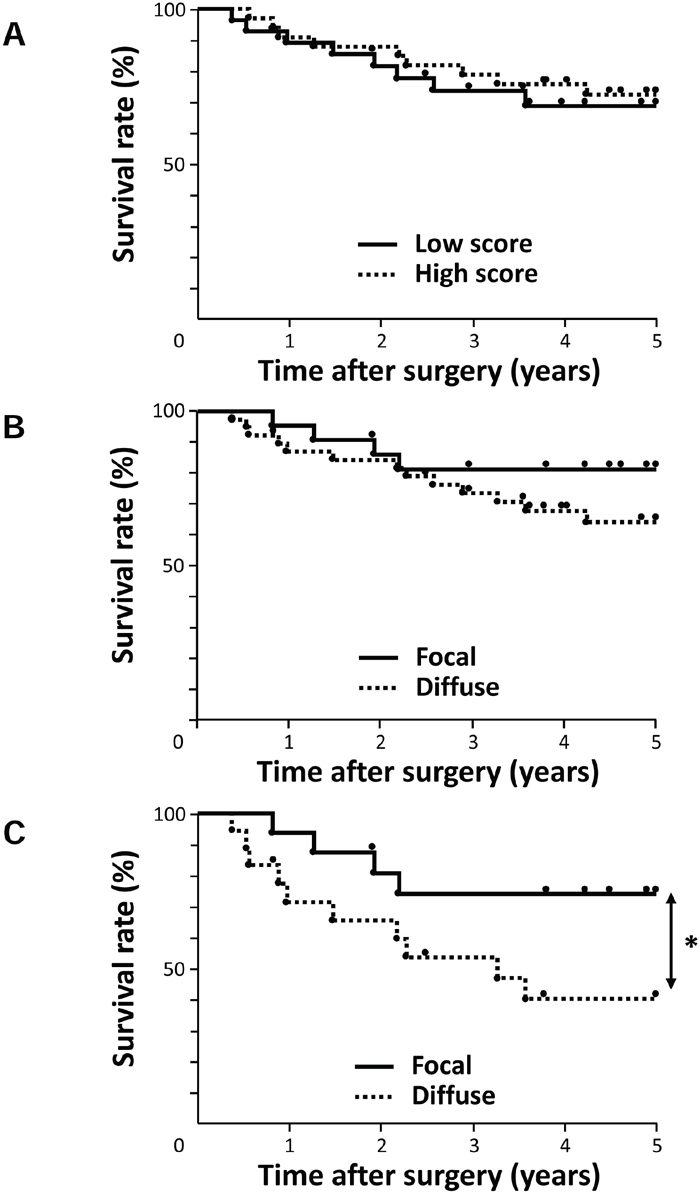
Figure 2: Survival curve of patients after curative resection for ESCC according to the expression of AE1. A. All patients were classified into two groups: the low grade expression of AE1 (n=28) and high grade expression of AE1 (n=33) in the tumor. B. All patients were classified into two groups: focal AE1 expression (n=22) and diffuse AE1 expression (n=39) in the tumor. C. Patients with pT2-3 ESCC were classified into two groups: focal AE1 expression (n=16) and diffuse AE1 expression (n=18). *p<0.05: Log-rank test.
Table 2: Five-year survival rate of patients with ESCC according to various clinicopathological parameters
Variable |
All patients (n=61) |
pT2-3 (n=34) |
||
|---|---|---|---|---|
5-year survival rate (%) |
p value |
5-year survival rate (%) |
p value |
|
Gender |
||||
Male |
69.43 |
0.968 |
51.14 |
0.4023 |
Female |
76.19 |
83.33 |
||
Age |
||||
<65 years |
68.44 |
0.6281 |
59.58 |
0.9227 |
≥65 years |
73.23 |
51.95 |
||
Tumor length |
||||
<50 mm |
70.64 |
0.7859 |
50.42 |
0.6342 |
≥50 mm |
70.83 |
63.73 |
||
Histological type |
||||
Well/moderately differentiated SCC |
73.13 |
0.2334 |
58.01 |
0.4077 |
Poorly differentiated SCC |
63.73 |
53.03 |
||
Lymphatic invasion |
||||
Negative |
80.54 |
0.1361 |
61.9 |
0.4079 |
Positive |
61.66 |
52.63 |
||
Venous invasion |
||||
Negative |
81.59 |
0.0327* |
72.32 |
0.2341 |
Positive |
55.38 |
44.44 |
||
pT |
||||
pT1 |
87.72 |
0.0024* |
||
pT2-3 |
56.72 |
|||
pN |
||||
pN0 |
84.74 |
0.0318* |
64.17 |
0.3589 |
pN1-3 |
59.65 |
51.98 |
||
AE1 staining score |
||||
Low |
68.67 |
0.8276 |
36.26 |
0.1469 |
High |
72.31 |
66.67 |
||
AE1 distribution |
||||
Focal |
81.34 |
0.1761 |
74.04 |
0.0387* |
Diffuse |
64.31 |
40.18 |
||
SCC: squamous cell carcinoma; pT: pathological T stage; pN: pathological N stage.
*p<0.05: Log-rank test.
Further, we investigated the prognostic impact of the AE1 expression in accordance with the pT category because it correlated with the distribution pattern of AE1 in Table 1. In patients with pT1 ESCC, a univariate analysis revealed that only the pN category was a significant prognostic factor (p=0.046) (Supplementary Table 1). Regarding the distribution pattern of AE1 in pT1 cases, the 5-year survival rate of the diffuse AE1 expression group (84.0%) was lower than that of the focal AE1 expression group (100%), but not significantly (p = 0.332) (Supplementary Table 1, Supplementary Figure 2). In patients with pT2-3 ESCC, the distribution pattern of AE1 was the strongest prognostic factor (p=0.039) (Table 2). Among pT2-3 cases, the 5-year survival rate of the diffuse AE1 expression group (40.2%) was significantly poorer than that of the focal AE1 expression group (74.0%) (Figure 2C). Multivariate analysis with factors whose p-values were less than 0.500 in univariate analysis also revealed the distribution pattern of AE1 was the most important prognostic indicator (Supplementary Table 2), suggesting that the diffuse AE1 expression is a valid poor prognostic indicator for advanced esophageal cancer.
In regard to recurrent pattern after curative resection, the number of cases with hematogenous recurrence was significantly larger in the diffuse AE1 expression group than in the focal AE1 expression group, although there was no difference in the percentage of postoperative adjuvant therapy [13] (Supplementary Table 3). We then analyzed 31 patients performed postoperative adjuvant therapy. In the diffuse AE1 expression group, 1 patient (5.3%) had hematogenous recurrence, whereas there were no patients with hematogenous recurrence in the focal AE1 expression group. Further, the number of patients with lymphogenous recurrence was larger in the diffuse AE1 expression group (n=8, 42.1%) than in the focal AE1 expression group (n=2, 16.7%) without significant difference (p=0.14).
Expression of AE1 in ESCC cell lines
In order to elucidate functions of AE1 in ESCCs, we investigated 7 cell lines for AE1 protein expressions. Results of western blot revealed that AE1 was strongly expressed in TE5, TE8, TE9, and KYSE150 cell lines (Figure 3).
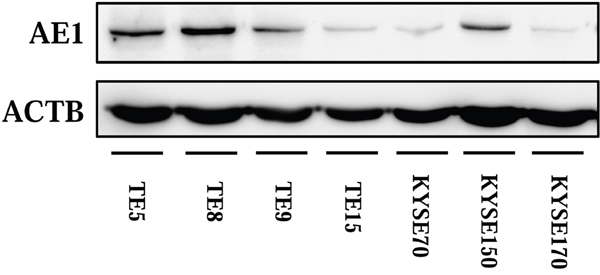
Figure 3: Expression of AE1 in ESCC cells. AE1 protein expression was analyzed in 7 ESCC cell lines. Western blotting showed that AE1 was strongly expressed in TE5, TE8, TE9, and KYSE150 cells.
AE1 regulates cell cycle in ESCC cells
We performed knocking down experimentation with AE1 siRNA in KYSE150 and TE8 cell lines and investigated the influences on cell cycle regulation. AE1 protein and mRNA levels were obviously decreased by AE1 siRNA transfection in both cell lines (Figure 4A–4B). The knocking down of AE1 partially inhibited cell cycle process from the G1 to S phase in both KYSE150 and TE8 cells (Figure 4C). Cell number 72 h after transfection was lower in AE1 siRNA transfected KYSE150 cells than in control cells with significant differences (Figure 4D). In TE8 cells, the cell number of AE1 knockdown cells was significantly lower than those of control cells 48 h and 72 h after transfection (Figure 4D). We also conducted overexpression study. Cells transfected Control-HaloTag® plasmid and AE1-HaloTag® plasmid were stained in red (Supplementary Figure 3A), and AE1-HaloTag® plasmid increased AE1 mRNA levels (Supplementary Figure 3B). AE1 overexpression in KYSE150 cells and TE8 cells increased cell growth (Supplementary Figure 4A) as opposed to knockdown of AE1. These findings indicate that AE1 has a critical function in control of cell cycle and proliferation in esophageal cancer.
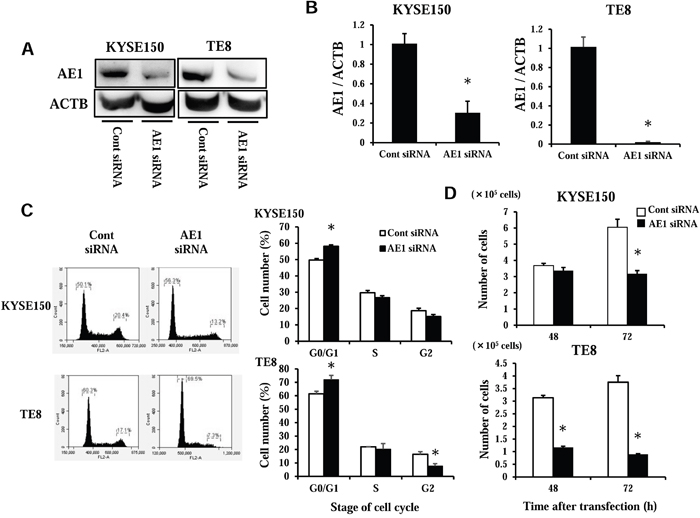
Figure 4: AE1 controls the cell cycle progression of ESCC cells. A. Western blotting revealed that AE1 siRNA effectively reduced AE1 protein levels in KYSE150 and TE8 cells. B. AE1 siRNA effectively reduced AE1 mRNA levels in KYSE150 and TE8 cells. Mean ± SEM. n = 3. *p<0.05 (significantly different from control siRNA). C. The down-regulation of AE1 partially reduced cell cycle progression from the G1 to S phase in KYSE150 and TE8 cells. Cells transfected with control or AE1 siRNA were stained with propidium iodide (PI) and analyzed by flow cytometry. Mean ± SEM. n = 3. *p<0.05 (significantly different from control siRNA). D. The down-regulation of AE1 inhibited the proliferation of KYSE150 and TE8 cells. The number of cells was counted 48 and 72 h after siRNA transfection. Mean ± SEM. n = 4. *p<0.05 (significantly different from control siRNA).
AE1 regulates apoptosis in ESCC cells
Next, we transfected KYSE150 and TE8 cells with AE1 siRNA and examined apoptosis. The AE1depletion increased early apoptosis (annexin V positive/PI negative) in KYSE150 and TE8 cell lines 48 h after siRNA transfection (Figure 5). These findings suggest that the expression of AE1 affects cell survival in ESCC cells.
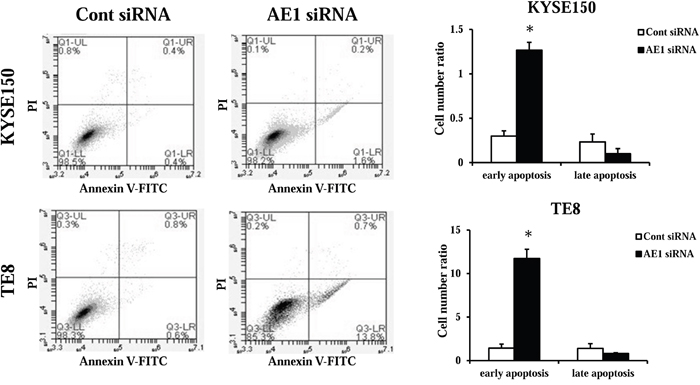
Figure 5: AE1 controls the survival of ESCC cells. The down-regulation of AE1 induced cell death in KYSE150 and TE8 cells. Apoptosis was determined by flow cytometry using PI/annexin V double staining. Mean ± SEM. n = 3. *p<0.05 (significantly different from control siRNA).
AE1 controls cell migration and invasion in ESCC cells
In KYSE150 cells, AE1 siRNA significantly reduced cell migration and invasion (Figure 6). In TE8 cells, the AE1 depletion also reduced cell migration and invasion (Figure 6). AE1 overexpression in TE8 cells increased cell invasion (Supplementary Figure 4B) as opposed to knockdown of AE1. These findings indicate that AE1 has critical functions in the control of cell migration and invasion in esophageal cancer.
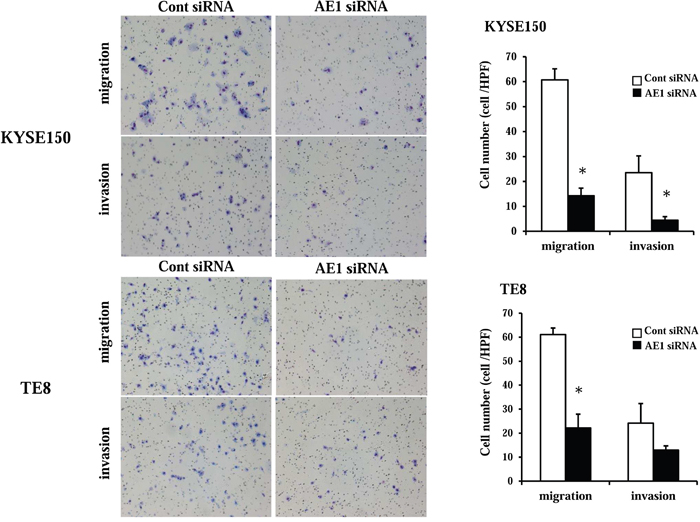
Figure 6: AE1 controlled the migration and invasion of ESCC cells. The down-regulation of AE1 inhibited the migration and invasion of KYSE150 and TE8 cells. Cell migration and invasion were examined using the Boyden chamber assay. Mean ± SEM. n = 3. *p<0.05 (significantly different from control siRNA).
Microarray analysis in AE1 siRNA-transfected ESCC cells
We determined the gene expression profiling of AE1 siRNA-transfected KYSE150 cells in microarray analysis. The results revealed that the expressions of 3345 genes showed fold changes of > 2.0 in KYSE150 cell line upon the knockdown of AE1. Among these, 588 were up-regulated and 2757 were down-regulated in AE1 siRNA-transfected KYSE150 cell line. Supplementary Table 4 showed the list of 20 genes with expression levels strongly up- or down-regulated in AE1 siRNA-transfected KYSE150 cell line. Ingenuity Pathway Analysis (IPA) revealed “Cancer” was one of the top-ranking diseases and that “Cellular Movement”, “Cell Death and Survival”, “Cell Cycle”, “Cellular Growth and Proliferation” were top-ranking biological functions related to AE1 depletion (Supplementary Table 5). A list of the top 50 up- or down-regulated genes exhibiting cell proliferation, cell cycle, apoptosis, migration, and invasion-related functions is shown in Supplementary Table 6, and was consistent with the results obtained in our in vitro studies.
Signal pathways and molecular mechanisms regulated by AE1 in ESCC cells
Pathway analysis using IPA showed that “P38 MAPK” was the center in one of the top-ranking signal networks of AE1 functions (Supplementary Figure 5). Furthermore, in Supplementary Table 5, “Molecular Mechanisms and Cancer” was the top-ranking canonical pathway related to the depletion of AE1. An analysis of the map of this pathway revealed that Hedgehog pathway-related genes were strongly down-regulated by the depletion of AE1 (Supplementary Figure 6A–6B), and also that MAPKs, such as “P38 MAPK”, “JNK”, and “ERK”, were included in this map. Therefore, we focused on MAPK and Hedgehog signaling pathways, and analyzed functions of AE1 in the control of these pathways.
The gene expression profiles of AE1-depleted KYSE150 cells showed that several genes of MAPKs were down-regulated by the knockdown of AE1 (Table 3). A Western blot analysis revealed that the down-regulation of AE1 decreased the phosphorylation levels and/or the total protein levels of JNK, ERK, and p38 in KYSE150 and TE8 cells (Figure 7A, Supplementary Figure 7).
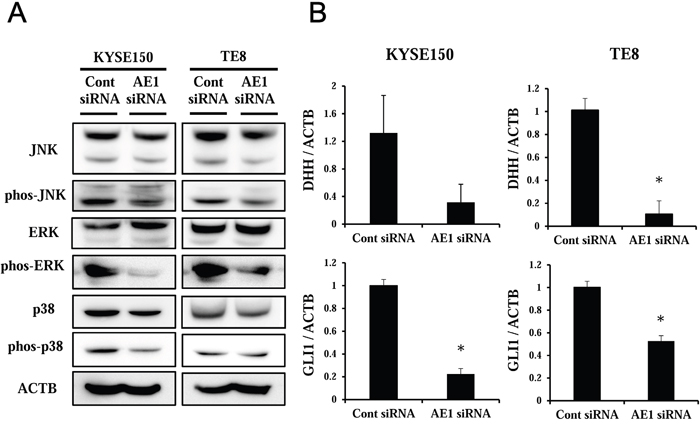
Figure 7: Signal pathways regulated by AE1 in ESCC cells. A. The down-regulation of AE1 decreased the phosphorylation levels and/or the total protein levels of MAPKs, such as JNK, ERK, and p38, in KYSE150 and TE8 cells. B. Verification of gene expression by real-time quantitative RT-PCR. The expression levels of two selected Hedgehog signaling pathway-related genes (DHH and GLI1) in AE1-depleted KYSE170 and TE8 cells were compared to those in control siRNA-transfected cells using real-time quantitative RT-PCR. Mean ± SEM. n = 3. *p<0.05 (significantly different from control siRNA).
Table 3: MAPK and Hedgehog signaling pathway-related genes with expression levels in KYSE150 cells that were changed by the depletion of AE1
MAPK signaling pathway |
|||
Symbol |
Gene Name |
UniGene ID |
Exp Fold Change |
MAPK11 |
mitogen-activated protein kinase 11 (p38-β) |
Hs.57732 |
−4.599 |
MAPK12 |
mitogen-activated protein kinase 12 (p38-γ) |
Hs.432642 |
−3.629 |
MAPK6 |
mitogen-activated protein kinase 6 (ERK3) |
Hs.411847 |
−2.668 |
MAPK3 |
mitogen-activated protein kinase 3 (ERK1) |
Hs.861 |
−2.475 |
MAPK9 |
mitogen-activated protein kinase 9 (JNK2) |
Hs.484371 |
−2.403 |
MAP3K5 |
mitogen-activated protein kinase kinase kinase 5 |
Hs.186486 |
−2.235 |
Hedgehog signaling pathway |
|||
Symbol |
Gene Name |
UniGene ID |
Exp Fold Change |
DHH |
desert hedgehog |
Hs.524382 |
−247.87 |
GLI1 |
GLI family zinc finger 1 |
Hs.632702 |
−8.354 |
PTCH1 |
patched 1 |
Hs.494538 |
−2.597 |
STK36 |
serine/threonine kinase 36 |
Hs.471404 |
−2.234 |
SUFU |
suppressor of fused homolog |
Hs.404089 |
−2.177 |
The results of the microarray analysis showed that several Hedgehog signaling pathway-related genes were down-regulated in AE1-depleted KYSE150 cells (Table 3). In order to verify the data of gene expression profiling, the 2 top-ranking genes (DHH and GLI1) were examined further by quantitative RT-PCR. The expression levels of DHH and GLI1 mRNA were decreased by the AE1 siRNA-transfection in KYSE150 cells (Figure 7B). Similar results were obtained in the TE8 cell line (Figure 7B).
These results were consistent with those of the gene expression profiling and indicate MAPK and Hedgehog signaling pathways are key mechanisms by which AE1 controls cancer cell functions, such as the proliferation, survival, and cellular movement of ESCC cells.
DISCUSSION
Regarding AE1 expression in human carcinoma samples using an immunohistochemical examination, a previous report showed it correlated with tumor length, depth, lymph node metastasis, and prognosis in gastric carcinoma [3]. Here, we analyzed AE1 expression in ESCC and examined relationships with clinical backgrounds and prognoses. We found a correlation between the expression of AE1 and tumor length. Furthermore, a correlation was observed between the distribution pattern of AE1 and histological degree of the differentiation of SCC or pT category. Our results showed the diffuse AE1 expression might become an effective poor prognostic indicator for advanced esophageal cancer. On the other hand, we need to state the limitation of this retrospective study related to small sample size and selection bias because our eligibility criteria was no preoperative chemotherapy. In fact, preoperative therapy has been performed positively for advanced ESCC in Japan [14]. However, as far as we know, this is the first report to investigate the expression of AE1 in human ESCC samples and its gene expression profiling.
Regarding mechanisms by which AE1 plays a role in carcinogenesis, previous studies demonstrated that AE1 binds with p16 and influences cell cycle progression [3, 5, 15]. A recent study showed that the transfection with miR-24 induced the return of p16 to the nucleus, confirming the miR-24-controlled AE1 down-regulation in gastric carcinoma [8]. Furthermore, AE1 expression in gastric carcinoma is associated with cellular alkalization, which plays a role in carcinogenesis [3, 5, 8, 12]. Here, we identified that the distribution pattern of AE1 correlated with the pT factor, which suggested AE1 was diffusely expressed from the initial stage of oncogenesis. The distribution pattern of AE1 also correlated with degree of the differentiation of SCC, and in non-cancerous esophageal epithelia, cells expressing AE1 were mainly observed in the lower and middle layer, and not detected in the basal and para-basal layers. These suggest that cancer cells may require differentiation and/or hypoxia-inducible AE1 distribution. In addition, the present study revealed the diffuse AE1 expression was the most critical poor prognostic indicator in pT2-3 esophageal cancer. Several reports including our previous study demonstrated that the gene expression of hypoxia-inducible factors was elevated with the overexpression of pH regulators, such as carbonic anhydrase (CA), suggesting that they become effective poor prognostic factors in microenvironment where the expression of hypoxia-inducible factors is also increased [16, 17]. However these mechanisms should be determined in more detail in further investigations, the present study indicates the critical and specific functions of AE1 in advanced esophageal cancer. In addition, based on the results of gene expression profiles in this report, we newly discovered that MAPK and Hedgehog signaling pathways are important networks regulated by AE1.
The Hedgehog signaling is the important controlling element during embryonic development, and is involved in cellular functions, such as patterning, proliferation, and differentiation [18]. Mammals have three Hedgehog homologues: Sonic, Indian, and Desert Hedgehog (DHH). Canonical Hedgehog signal activation is caused by the interaction between Hedgehog ligands and the transmembrane protein receptor patched (PTCH). In the presence of Hedgehog ligands, PTCH reduces the suppression on the smoothened (SMO), leading to the activation of GLI transcription factors [18]. GLI increases the expression of various target genes, including controlling elements of fundamental cellular functions, and, thus, the Hedgehog signaling pathway functions in tumor progression. In esophageal carcinoma, previous reports showed that Hedgehog signaling is active and required for tumor growth [19, 20]. The results of the present study indicated the gene expression of these important factors in the Hedgehog signaling pathway, such as DHH, GLI1, and PTCH1, was changed by the knockdown of AE1, suggesting that AE1 regulates the tumor behavior of ESCC via this pathway.
Our results also revealed that the depletion of AE1 inhibited the activity of MAPKs in ESCC. In Barrett’s esophageal adenocarcinoma cells, AE was shown to regulate MAPK-mediated proliferation via intracellular acidification [7]. Furthermore, recent studies identified crosstalk between Hedgehog and MAPK signaling in various types of tumors [18]. In human ESCC samples, the phosphorylation of ERK was detected in samples strongly expressing SHH and GLI1 [21]. In ESCC, Hedgehog signaling-induced ERK activation was previously shown to be repressed by PD98059 and cyclopamine [21]. An activation of Sonic Hedgehog enhanced proliferation, and this phenomenon was inhibited by a pre-incubation with cyclopamine and also by PD98059, suggesting that inactivation of ERK reduced the Hedgehog signaling-induced proliferation of ESCC cells [21]. These findings show that crosstalk between MAPK and Hedgehog signaling pathways exists in ESCC, and our results suggest novel and crucial roles for AE1 in this important cross-signaling.
Latest researches indicated ion transporters have critical functions in various cancer cells, and a cellular physiological factors are expected to become a novel and effective targets for tumor therapies [22, 23]. Our previous researches demonstrated the importance of ion carriers [24, 25], water transporters [26], and pH controlling factors [16] in ESCC. Several reports show the intracellular chloride concentration ([Cl-]i) controlled by Cl- transporters may become the important messenger [27–29]. Our previous reports revealed that the change of the [Cl-]i induced cell cycle arrest at the G0/G1 phase, and that the [Cl-]i controls the proliferation by affecting MAPKs in cancer cells [27, 28]. AE1 is the key molecule regulating the [Cl-]i through the exchange of Cl- with HCO3- across the plasma membrane, suggesting the mechanism by which AE1 plays a role in activation of MAPKs. In addition, regarding pH regulators, we showed that CA XII, which is involved in the acidification of circumstances, was an effective prognostic indicator for advanced esophageal cancer [16]. Suo et al. demonstrated that the in vivo delivery of siRNA resulted in the selective inhibition of AE1 expression, leading to a decreased incidence of gastric cancer in mice [12]. These findings suggest that pH regulatory factors, such as AEs, and CAs, lead the possibility to become effective treatment targets and their regulation may produce novel strategies for futurity therapies [22, 23].
In summary, we herein demonstrated that AE1 played as a regulator of the proliferation, survival, migration, and invasion of ESCC cell lines. The results of an immunohistochemistry indicated that the diffuse AE1 expression was a valid poor prognostic indicator for advanced esophageal cancer. Our microarray analysis also suggests that AE1 markedly influences the gene expressions associated with the crosstalk between MAPK and Hedgehog signaling pathways. More profound investigations about functions of AE1 may increase its potential as one of the key biomarkers and targets of treatment for esophageal cancer.
MATERIALS AND METHODS
Cell lines, antibodies, and other reagents
The human ESCC cell lines TE5, TE8, TE9, and TE15 were obtained from the Riken Cell Bank (Tsukuba, Japan). The human ESCC cell lines KYSE70, KYSE150, and KYSE170 were obtained from the Japanese Collection of Research Bioresources Cell Bank (Osaka, Japan). These cells were grown in RPMI-1640 medium (Nacalai Tesque, Kyoto, Japan) supplemented with 100 U/ml of penicillin, 100 μg/ml of streptomycin, and 10% fetal bovine serum (FBS). Cells were cultured in flasks or dishes in a humidified incubator at 37°C under 5% CO2 in air.
The monoclonal anti-AE1 antibody used in the immunohistochemical analysis and protein assay was obtained from Abcam (Cambridge, MA, UK). The rabbit monoclonal c-Jun N-terminal kinase (JNK), phosphorylated JNK, extracellular signal-regulated kinase (ERK), phosphorylated ERK, p38, and phosphorylated p38 antibodies were purchased from Cell Signaling Technology (Beverly, MA). The mouse monoclonal ACTB antibody was purchased from Sigma-Aldrich (St. Louis, MO). Horseradish peroxidase (HRP)-conjugated anti-rabbit or mouse secondary antibodies were purchased from Cell Signaling Technology (Beverly, MA).
Patients and primary tissue samples
ESCC tumor samples were obtained from 61 patients with histologically confirmed primary ESCC who underwent esophagectomy at Kyoto Prefectural University of Medicine between 1999 and 2009 and were embedded in paraffin after 12 h of formalin fixation. Patient eligibility criteria were as follows: no synchronous or metachronous cancers (in addition to ESCC) and no preoperative chemotherapy or radiation therapy. We excluded patients with non-curative resected tumors or non-consecutive data. All patients provided written informed consent. Relevant clinicopathological and survival data were obtained from the hospital database. Staging was principally based on the International Union Against Cancer (UICC)/TNM Classification of Malignant Tumors (7th edition) [30]. Cancer recurrence occurred in 24 patients (39.3%). Nineteen patients (31.1%) died of cancer recurrence, while no patients died from other diseases. The median follow-up period of all patients was 56.2 months (range, 4.5-157 months). With respect to the histological degree of the differentiation of SCC, patients were divided into 2 groups: well/moderately differentiated SCC and poorly differentiated SCC.
Immunohistochemistry
Paraffin sections (thickness of 4 μm) of tumor tissues were subjected to immunohistochemical staining for the AE1 protein using the avidin-biotin-peroxidase method. Briefly, paraffin sections were dewaxed with xylene and hydrated with a graded series of alcohols. Endogenous peroxidases were quenched by incubating the sections for 30 min in 0.3% H2O2. For blocking of endogenous biotin, biotin receptors, and avidin binding sites, Avidin/Biotin Blocking Kit was used (Vector laboratories, Burlingame, CA). Sections were then treated with a protein blocker and incubated at 4°C overnight with the anti-AE1 antibody. The avidin-biotin-peroxidase complex (Vectastain ABC Elite kit; Vector Laboratories, Burlingame, CA) was visualized with diaminobenzidine tetrahydrochloride. Sections were counterstained with hematoxylin, dehydrated with a graded series of alcohols, cleared in xylene, and mounted.
Immunohistochemical samples stained with AE1 were graded semi-quantitatively by considering both the staining intensity and percentage of positive tumor cells using an immunoreactive score (IRS) [31]. Staining intensity was scored as 0 (no staining), 1 (weak staining), 2 (moderate staining), or 3 (strong staining). The proportion of positive tumor cells was scored from 0 to 1.0. The score of each sample was calculated as the maximum multiplied product of the intensity and proportion scores (0 to 3.0). Regarding the pattern of distribution of AE1-expressing cells, we divided ESCC patients into 2 groups: focal AE1 expression (lesion with mosaic pattern staining ≥50%) and diffuse AE1 expression (lesion with mosaic pattern staining<50%).
Western blotting
Cells were harvested in M-PER lysis buffer (Pierce, Rockford, IL) supplemented with protease inhibitors (Pierce). Protein concentrations were measured with a modified Bradford assay (Bio-Rad, Hercules, CA). Cell lysates containing equal amounts of total protein were separated by SDS-PAGE and then transferred onto PVDF membranes (GE Healthcare, Piscataway, NJ). These membranes were then probed with the indicated antibodies, and proteins were detected using an ECL Plus Western Blotting Detection System (GE Healthcare). Band densities were quantified using the ImageJ software (http://rsb.info.nih.gov/ij/) after being scanned from the film.
siRNA transfection
Cells were transfected with 12 nmol/l AE1 siRNA (Stealth RNAi™ siRNA #HSS185804; Invitrogen, Carlsbad, CA) using the Lipofectamine RNAiMAX reagent (Invitrogen), according to the manufacturer’s instructions. Medium containing siRNA was replaced with fresh medium after 24 h. The control siRNA provided (Stealth RNAi™ siRNA Negative Control; Invitrogen) was used as a negative control.
Overexpression study
Control-HaloTag® plasmid (Promega, G6591) and AE1-HaloTag® plasmid were transfected into KYSE150 cells and TE8 cells using FuGENE HD transfection reagents (Promega, E2311) following the manufacturer's instructions. Transfection of vector was confirmed by fluorescent microscopy for HaloTag® fusion protein stained with the TMR conjugated HaloTag® ligand (Promega, G8252) according to the manufacturer's protocol. Cells were then separated by flow cytometry using a Cell Sorter SH800 (SONY, Tokyo, Japan) based on fluorescence. After passaging cells, AE1-expressing cells were used for proliferation, migration and invasion assays.
Cell cycle analysis
The cell cycle phase was evaluated 48 h after siRNA transfection by fluorescence-activated cell scoring (FACS). Briefly, cells were treated with Triton X-100 and RNase, and nuclei were stained with propidium iodide (PI) prior to the DNA content measurement using Becton-Dickinson Accuri C6 FACS (BD Biosciences, Franklin Lakes, NJ). At least 10,000 cells were analyzed.
Cell proliferation
Cells were seeded on 6-well plates at a density of 1.0 x 10⁵ cells per well and incubated at 37°C with 5% CO2. siRNA was transfected 24 h after the cells had been seeded. Cells were detached from the flasks with trypsin-EDTA 48 h and 72 h after siRNA transfection and were counted using a hemocytometer.
Analysis of apoptotic cells
Cells were harvested 48 h after siRNA transfection and stained with fluorescein isothiocyanate-conjugated annexin V and phosphatidylinositol using the annexin V kit (Beckman Coulter, Brea, CA) according to the manufacturer’s protocol. The proportion of apoptotic cells was analyzed by flow cytometry with BD Accuri C6 (BD Biosciences).
Analysis of cell migration and invasion
The migration assay was conducted using a Cell Culture Insert with a pore size of 8 μm (BD Biosciences). Biocoat Matrigel (BD Biosciences) was used to evaluate cell invasion potential. Briefly, cells (1.0 x 10⁵ cells per well) were seeded in the upper chamber in serum-free medium 24 h after siRNA transfection. The lower chamber contained medium with 10% FBS. The chambers were incubated at 37°C for 48 h in 5% CO2, and non-migrated or non-invaded cells were then removed from the upper side of the membrane by scrubbing with cotton swabs. Migrated or invaded cells were fixed on the membrane and stained with Diff-Quick staining reagents (Sysmex, Kobe, Japan). The migrated or invaded cells on the lower side of the membrane were counted in four independent fields of view at 100x magnification for each insert. Each assay was performed in triplicate.
Real-time reverse transcription-polymerase chain reaction (RT-PCR)
Total RNA was extracted using an RNeasy kit (Qiagen, Valencia, CA). Messenger RNA (mRNA) expression was measured by quantitative real-time PCR (7300 Real-Time PCR System; Applied Biosystems, Foster City, CA) with TaqMan Gene Expression Assays (Applied Biosystems), according to the manufacturer’s instructions. The expression levels of the following genes were measured: AE1 (Hs00978603_m1), DHH (Hs00368306_m1), and GLI1 (Hs00171790_m1) (Applied Biosystems). Expression was normalized for each gene to the housekeeping gene beta-actin (ACTB, Hs01060665_g1; Applied Biosystems). Assays were performed in triplicate.
Microarray sample preparation and hybridization
Total RNA was extracted using an RNeasy kit (Qiagen). RNA quality was monitored with an Agilent 2100 Bioanalyzer (Agilent Technologies, Santa Clara, CA). Cyanine-3 (Cy3)-labeled cRNA was prepared from 0.1 μg of total RNA using a Low Input Quick Amp Labeling Kit (Agilent), according to the manufacturer’s instructions. Samples were purified using RNeasy columns (Qiagen). A total of 0.60 μg of Cy3-labeled cRNA was fragmented and hybridized to an Agilent SurePrint G3 Human Gene Expression 8x60K Microarray for 17 h. Slides were washed and scanned immediately on an Agilent DNA Microarray Scanner (G2565CA) using the one color scan setting for 8x60K array slides.
Processing of microarray data
Scanned images were analyzed with Feature Extraction Software 10.10 (Agilent) using default parameters to obtain background-subtracted and spatially detrended Processed Signal intensities. Signal transduction networks were analyzed using Ingenuity Pathway Analysis (IPA) software (Ingenuity Systems, Inc., Redwood City, CA).
Statistical analysis
The chi-squared test was used to assess the differences between proportions, and Student’s t-tests (for comparisons between two groups) were used to evaluate continuous variables. Survival curves were constructed by the Kaplan-Meier method, and differences in survival were examined using the Log-rank test. A multivariate analysis of the factors influencing survival was performed using the Cox proportional hazard model. Differences were considered significant when the relevant P value was <0.05. These analyses were performed using the statistical software JMP (version 10, SAS Institute Inc., Cary, NC).
ACKNOWLEDGMENTS
This work was supported by a Grant-in-Aid for Scientific Research (C) (26461988) and Grants-in-Aid for Young Scientists (B) (15K19903, 15K19904) from the Japan Society for the Promotion of Science.
CONFLICTS OF INTEREST
None of the authors have any conflicts of interest or financial ties to disclose.
REFERENCES
1. Alper SL, Darman RB, Chernova MN, Dahl NK. The AE gene family of Cl-/HCO3- exchangers. J Nephrol. 2002; 15:S41-53.
2. Kopito RR, Lee BS, Simmons DM, Lindsey AE, Morgans CW, Schneider K. Regulation of intracellular pH by a neuronal homolog of the erythrocyte anion exchanger. Cell. 1989; 59:927-937.
3. Xu WQ, Song LJ, Liu Q, Zhao L, Zheng L, Yan ZW, Fu GH. Expression of anion exchanger 1 is associated with tumor progress in human gastric cancer. J Cancer Res Clin Oncol. 2009; 135:1323-1330.
4. Romero MF. Molecular pathophysiology of SLC4 bicarbonate transporters. Curr Opin Nephrol Hypertens. 2005; 14:495-501.
5. Shen WW, Wu J, Cai L, Liu BY, Gao Y, Chen GQ, Fu GH. Expression of anion exchanger 1 sequestrates p16 in the cytoplasm in gastric and colonic adenocarcinoma. Neoplasia. 2007; 9:812-819.
6. Meier S1, Hubner CA, Groeben H, Peters J, Bingmann D, Wiemann M. Expression of anion exchanger 3 influences respiratory rate in awake and isoflurane anesthetized mice. Physiol Pharmacol. 2007; 58:371-378.
7. Sarosi GA Jr, Jaiswal K, Herndon E, Lopez-Guzman C, Spechler SJ, Souza RF. Acid increases MAPK-mediated proliferation in Barrett's esophageal adenocarcinoma cells via intracellular acidification through a Cl-/HCO3- exchanger. Am J Physiol Gastrointest Liver Physiol. 2005; 289:G991-997.
8. Wu J, Zhang YC, Suo WH, Liu XB, Shen WW, Tian H, Fu GH. Induction of anion exchanger-1 translation and its opposite roles in the carcinogenesis of gastric cancer cells and differentiation of K562 cells. Oncogene. 2010; 29:1987-1996.
9. Tian H, Zhang N, Suo WH, Wang T, Song LJ, Wu J, Liu Q, Shen WW, Fu GH. Gastrin suppresses the interdependent expression of p16 and anion exchanger 1 favoring growth inhibition of gastric cancer cells. Int J Cancer. 2010; 127:1462-1474.
10. Yang Y, Wu PP, Wu J, Shen WW, Wu YL, Fu AF, Zheng L, Jin XL, Fu GH. Expression of anion exchanger 2 in human gastric cancer. Exp Oncol. 2008; 30:81-87.
11. Wang T, Zhao L, Yang Y, Tian H, Suo WH, Yan M, Fu GH. EGR1 is critical for gastrin-dependent upregulation of anion exchanger 2 in gastric cancer cells. FEBS J. 2013; 280:174-183.
12. Suo WH1, Zhang N, Wu PP, Zhao L, Song LJ, Shen WW, Zheng L, Tao J, Long XD, Fu GH. Anti-tumour effects of small interfering RNA targeting anion exchanger 1 in experimental gastric cancer. Br J Pharmacol. 2012; 165:135-147.
13. Shiozaki A, Yamagishi H, Itoi H, Fujiwara H, Kikuchi S, Okamoto K, Ichikawa D, Fuji N, Ochiai T, Sonoyama T, Ueda Y. Long-term administration of low-dose cisplatin plus 5-fluorouracil prolongs the postoperative survival of patients with esophageal cancer. Oncol Rep. 2005; 13:667-672.
14. Ando N, Kato H, Igaki H, Shinoda M, Ozawa S, Shimizu H, Nakamura T, Yabusaki H, Aoyama N, Kurita A, Ikeda K, Kanda T, Tsujinaka T, et al. A randomized trial comparing postoperative adjuvant chemotherapy with cisplatin and 5-fluorouracil versus preoperative chemotherapy for localized advanced squamous cell carcinoma of the thoracic esophagus (JCOG9907). Ann Surg Oncol. 2012; 19:68-74.
15. Fu GH, Wang Y, Xi YH, Shen WW, Pan XY, Shen WZ, Jiang XS, Chen GQ. Direct interaction and cooperative role of tumor suppressor p16 with band 3 (AE1). FEBS Lett. 2005; 579:2105-2110.
16. Ochi F, Shiozaki A, Ichikawa D, Fujiwara H, Nakashima S, Takemoto K, Kosuga T, Konishi H, Komatsu S, Okamoto K, Kishimoto M, Marunaka Y, Otsuji E. Carbonic Anhydrase XII as an Independent Prognostic Factor in Advanced Esophageal Squamous Cell Carcinoma. J Cancer. 2015; 6: 922-929.
17. Harima Y, Togashi A, Horikoshi K, Imamura M, Sougawa M, Sawada S, Tsunoda T, Nakamura Y, Katagiri T. Prediction of outcome of advanced cervical cancer to thermoradiotherapy according to expression profiles of 35 genes selected by cDNA microarray analysis. Int J Radiat Oncol Biol Phys. 2004; 60:237-248.
18. Rovida E, Stecca B. Mitogen-activated protein kinases and Hedgehog-GLI signaling in cancer: A crosstalk providing therapeutic opportunities? Semin Cancer Biol. 2015; 35:154-167.
19. Berman DM, Karhadkar SS, Maitra A, Montes De Oca R, Gerstenblith MR, Briggs K, Parker AR, Shimada Y, Eshleman JR, Watkins DN, Beachy PA. Widespread requirement for Hedgehog ligand stimulation ingrowth of digestive tract tumours. Nature. 2003; 425:846-851.
20. Wang Y, Ding Q, Yen CJ, Xia W, Izzo JG, Lang JY, Li CW, Hsu JL, Miller SA, Wang X, Lee DF, Hsu JM, Huo L, et al. The crosstalk of mTOR/S6K1 and Hedgehog pathways. Cancer Cell. 2012; 21:374-387.
21. Wei L, Xu Z. Cross-signaling among phosphinositide-3 kinase, mitogen-activated protein kinase and sonic hedgehog pathways exists in esophageal cancer. Int J Cancer. 2011; 129:275-284.
22. Shiozaki A, Ichikawa D, Otsuji E, Marunaka Y. Cellular physiological approach for treatment of gastric cancer. World J Gastroenterol. 2014; 20:11560-11566.
23. Shiozaki A, Ichikawa D, Fujiwara H, Otsuji E, Marunaka Y. Progress in Cellular Physiological Researches on Esophageal Cancer. Journal of Tumor. 2014; 2: 241-247.
24. Shiozaki A, Nako Y, Ichikawa D, Konishi H, Komatsu S, Kubota T, Fujiwara H, Okamoto K, Kishimoto M, Marunaka Y, Otsuji E. Role of the Na+/K+/2Cl- cotransporter NKCC1 in cell cycle progression in human esophageal squamous cell carcinoma. World J Gastroenterol. 2014; 20:6844-6859.
25. Shiozaki A, Takemoto K, Ichikawa D, Fujiwara H, Konishi H, Kosuga T, Komatsu S, Okamoto K, Kishimoto M, Marunaka Y, Otsuji E. The K-Cl cotransporter KCC3 as an independent prognostic factor in human esophageal squamous cell carcinoma. Biomed Res Int. 2014; 936401.
26. Shimizu H, Shiozaki A, Ichikawa D, Fujiwara H, Konishi H, Ishii H, Komatsu S, Kubota T, Okamoto K, Kishimoto M, Otsuji E. The expression and role of Aquaporin 5 in esophageal squamous cell carcinoma. J Gastroenterol. 2014; 49:655-666.
27. Miyazaki H, Shiozaki A, Niisato N, Ohsawa R, Itoi H, Ueda Y, Otsuji E, Yamagishi H, Iwasaki Y, Nakano T, Nakahari T, Marunaka Y. Chloride ions control the G1/S cell-cycle checkpoint by regulating the expression of p21 through a p53-independent pathway in human gastric cancer cells. Biochem Biophys Res Commun. 2008; 366:506-512.
28. Ohsawa R, Miyazaki H, Niisato N, Shiozaki A, Iwasaki Y, Otsuji E, Marunaka Y. Intracellular chloride regulates cell proliferation through the activation of stress-activated protein kinases in MKN28 human gastric cancer cells. J Cell Physiol. 2010; 223:764-770.
29. Shiozaki A, Otsuji E, Marunaka Y. Intracellular chloride regulates the G(1)/S cell cycle progression in gastric cancer cells. World J Gastrointest Oncol. 2011; 3:119-122.
30. Sobin L, Gospodarowicz M, Wittekind C, eds. TNM Classification of malignant tumors. 7th ed. Hoboken, NJ: John Wiley & Sons, Inc, 2009.
31. Remmele W, Stegner HE. Recommendation for uniform definition of an immunoreactive score (IRS) for immunohistochemical estrogen receptor detection (ER-ICA) in breast cancer tissue. Pathology. 1987; 8:138-140.