
INTRODUCTION
Ovarian cancer is the most lethal gynaecological cancer and the sixth most common cause of cancer related death among Western women [1]. Although ovarian cancers represent only 30% of cancers of the female genital tract, they are responsible for half of the deaths [1]. The disproportionately high mortality rate is attributed to the late presentation of the disease. Despite advances in surgery and chemotherapies, no substantial improvement in ovarian cancer survival has been observed over the last two decades [2]. A greater understanding of the mechanisms involved in the progression of ovarian cancer will aid in the discovery of novel molecular prognostic indicators as well as new therapeutic targets. To increase our understanding of the molecular mechanisms involved in ovarian cancer progression and to identify novel therapeutic targets we recently studied the interaction of ovarian cancer and peritoneal cells [3–5]. Keratins K5 and K6c were amongst the proteins that were identified in the ovarian cancer peritoneal cell co-culture secretome by MALDI-TOF/TOF mass spectrometry [5].
Keratins are intermediate filament proteins responsible for structural integrity of epithelial cells and play an important role in epithelial cell protection. They also play roles in cell polarization, cell size regulation, protein translation and organelle positioning [6]. Fifty four functional keratin proteins have been identified in human epithelial cells including 28 type I (acidic forms, K9-K28) and 26 type II (basic forms, K1-K8 and K71-K74) proteins [7, 8]. They contain a central rod of ~310 amino acids with a helical conformation flanked by non-helical head and tail domains of variable length [9]. A characteristic feature of keratin proteins is their pairing with other keratin proteins. They form obligate heterodimers between a type I keratin and a type II keratin via their rod domains and the resulting heterodimers and tetramers form the basic building units of the keratin filaments [7, 8].
K5 (encoded by gene KRT5) is a high molecular weight (predicted 62.6 kDa), basic type keratin expressed in the basal, intermediate, and superficial layers of stratified epithelia as well as transitional epithelia and complex epithelium [9]. It is most often complexed with K14 [9]. K5 positive cells have been identified in both luminal and basal epithelium of the normal breast and K5 has been implicated as a stem cell marker [10, 11]. A recent study has highlighted that K5 expressing basal cells in the healthy and regenerating urothelium are self-renewing and unipotent [12].
K6 protein is also a high molecular weight (predicted 60.3 kDa), basic type keratin known to be expressed by proliferating squamous epithelia and usually complexes with K16 [9]. Three isoforms of K6 exist (K6a, K6b, and K6c) which are encoded by three distinct genes: KRT6A, KRT6B, and KRT6C [13, 14]. K6a is the most abundant, representing about 77% of all forms found in epithelia and shares at least 97.6% amino acid identity with other K6 proteins. K6a has been detected in subpopulations of luminal and ductal myoepithelial cells in human mammary glands [15]. A high proliferative population of K6a positive cells has also been described in the prostate gland [16]. There have been only a few studies which have investigated the expression of the K6c isoform in human tissues as until recently there was a lack of isoform-specific gene probes and antibodies.
Monoclonal antibodies to K5 and K5/6 have been used to identify basal-like triple negative breast cancers [17, 18] and high K5/6 expression was found to be associated with an increased risk of breast cancer relapse and death [17, 19, 20]. Focal K5/6 expression has also been described in adenocarcinomas of the endometrium, pancreas and ovary [21, 22]. In addition, K5+ subpopulation of cells have been identified in ER+ PR+ luminal breast cancers [23, 24] and are increased in patients whose luminal breast cancers develop resistance to endocrine treatment and chemotherapy [25, 26].
Whilst other keratins have been shown to have diagnostic or prognostic utility in ovarian cancer [27–30], limited studies to date have examined K5 and K6 expression in this malignancy. We therefore investigated the prognostic significance of KRT5 and KRT6 mRNA expression in publically available serous ovarian cancer data sets [31]. Additionally, monoclonal antibodies which detect both K5/6 or only K5 were used to assess protein expression in ovarian cancer cell lines and cohorts of high grade serous ovarian carcinomas at surgery and after neoadjuvant chemotherapy. Furthermore, KRT5 and KRT6C mRNA expression was assessed in chemotherapy sensitive and chemotherapy resistant primary serous ovarian cancer cells derived from patient ascites. We also evaluated whether K5+ cells are increased in serous ovarian cancer patients following chemotherapy treatment. To our knowledge, this is the first study to investigate the relationships between KRT5 mRNA, KRT6 mRNA, K5/6, and K5 protein expression with serous ovarian cancer patient outcome.
RESULTS
KRT5, KRT6C mRNA and K5/6 protein expression in ovarian cancer cell lines
Using qRT-PCR KRT5 is expressed by metastatic OVCAR-5, OV-90, and SKOV-3 ovarian cancer cells, as well as by poorly metastatic OVCAR-3 cells but not the peritoneal cell line, LP-9 (Figure 1A). KRT6C was expressed by all ovarian cancer cell lines as well as LP-9 cells (Figure 1B). The K5/6 antibody detected bands at ~52 kDa in all cell line extracts and faint bands at ~56 kDa in protein extracts from OVCAR-5, OV-90 and SKOV-3 cells (Figure 1C). Using human ovarian cancer tissue extracts shown to express high and low K5/6 and K5 positivity (see inserts in Figure 1C and 1D) and antibodies to only K5, we confirmed that the 56 kDa and 52 kDa bands were K5 and K6, respectively. Two bands at ~52 kDa and ~56 kDa were observed with the K5/6 antibody in the ovarian cancer tissue extracts (Figure 1C), however the K5 antibody (Abcam) only detected a single band at ~56 kDa in the ovarian cancer tissue (Figure 1D).
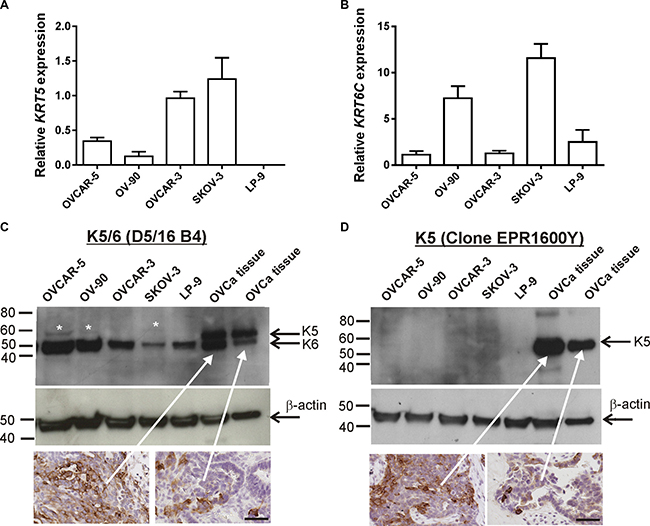
Figure 1: KRT5, KRT6C mRNA, K5/6 and K5 expression in ovarian cancer cell lines. (A) KRT5 mRNA expression in ovarian cancer cell lines and LP-9 cells. (B) KRT6C mRNA expression in ovarian cancer cell lines and LP-9 cells. Relative expression was normalized to the house keeping gene β-actin using the 2-ΔΔCT method with the same calibrator (OVCAR-3). Data is expressed as the mean fold change ± SEM from 4-11 individual RNA samples obtained from 2-4 independent experiments. (C) Equal amounts protein for the cell lines (40 μg) and ovarian cancer tissue extracts (5 μg) were run on a 4-20% SDS-PAGE gel and immunoblotted with mouse monoclonal K5/6 antibody (1/200, clone D5/16 B4, Dako). K5/6 antibody detected K6 bands at ~52 kDa in all cell line extracts and faint K5 bands at ~56 kDa in cell extracts from OVCAR-5, OV-90 and SKOV-3 cells. Both K5 and K6 were detected in ovarian cancer tissue extracts. White asterisks indicate faint K5 bands detected with K5/6 antibody. (D) Western blotting with rabbit monoclonal K5 antibody (1/5000, clone EPR1600Y, Abcam) antibody using the same protein samples from (C) confirmed K5 expression in ovarian cancer tissue extracts. A mouse monoclonal antibody to β-actin (1/10,000, clone AC-15, Sigma Aldrich A3854) was used as a loading control. Ovarian cancer tissues sections with high and low K5/6 (C) or K5 (D) immunostaining were used as positive controls for the western blots (scale bar = 50 μm).
K5/6 and K5 are elevated in serous carcinoma tissues
K5/6 immunostaining was abundant in the skin epidermis (Figure 2A) but little or no staining was observed in the ovarian surface epithelium (OSE) of normal ovaries (8/8, Figure 2B, Table 1A). High K5/6 immunostaining (score 2 or 3) was present in 25% (2/8) of the benign serous cystadenoma (Figure 2C, Table 1A), 60% (6/10) high grade serous borderline tumors (Figure 2D, Table 1A) and 29.9% (35/117) of the serous ovarian cancer cases (Table 1A). Sixteen percent (19/117) of the serous ovarian cancer tissues were negative for K5/6. Examples of low (score = 1) and high (score = 3) K5/6 immunostaining in serous ovarian cancer tissues are shown in Figure 2E and 2F, respectively. K5/6 immunostaining was increased in serous borderline tumors and serous carcinomas compared to normal ovaries (P = 0.006, Chi-Square test, Table 1A). Similar staining patterns were observed with a monoclonal antibody which detects only K5 (Table 1C), (Supplementary Figure 1). However, a higher proportion of serous carcinomas (66%, 70/106) had high K5 immunostaining compared to K5/6 immunostaining. Neither K5/6 nor K5 immunostaining were associated with patient age, FIGO stage, tumor grade or the presence of residual disease (Supplementary Table 1).
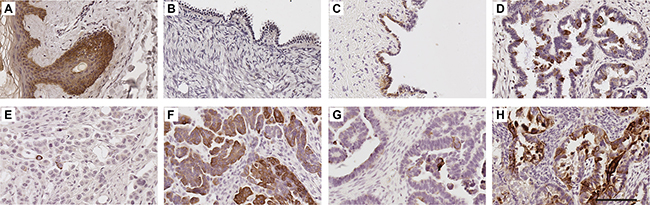
Figure 2: K5/6 expression in human ovarian tissues. K5/6 immunohistochemistry using mouse monoclonal K5/6 antibody (1/50, clone D5/16 B4, DAKO) using Tris buffer (pH 9.0) microwave antigen retrieval. Human skin (A), normal ovary (B), benign serous cystadenoma (C), serous borderline tumor (D), serous carcinoma with low K5/6 immunostaining (E) serous carcinoma with high K5/6 immunostaining (F). K5/6 immunostaining in tissues obtained from the same patient at diagnosis (G) and following treatment carboplatin and paclitaxel (H). Scale bar = 100 μm. All images are same magnification.
Table 1: Comparison of K5/6 and K5 immunostaining in different tissues groups
A. K5/6 immunostaining in normal ovaries, benign serous cystadenomas, serous borderline tumors and serous ovarian carcinomas |
||||
|---|---|---|---|---|
Tissue |
K5/6 immunostaining (positivity groups) |
|||
0 |
1 (1−9%) |
2 (10−50%) |
3 (> 50%) |
|
Normal ovaries |
5/8 |
3/8 |
0/8 |
0/8 |
Serous cystadenomas |
0/8 |
6/8 |
2/8 |
0/8 |
Serous borderline tumors |
0/10 |
4/10 |
3/10 |
3/10 |
Serous ovarian carcinomas (Stage III–IV) |
19/117 |
64/117 |
24/117 |
10/117 |
Chi-squared test |
P = 0.006 |
|||
B. K5/6 immunostaining in chemonaive serous ovarian cancers and post chemotherapy treatment |
|||
|---|---|---|---|
Tissue |
n |
K5/6 immunostaining (positivity groups) |
|
< 10% |
≥ 10% |
||
Serous ovarian carcinomas (chemonaïve) |
117 |
82/117 |
35/117 |
Serous ovarian carcinoma (Post chemotherapy |
21 |
3/21 |
18/21 |
Fisher exact test |
P < 0.0001 |
||
C. K5 immunostaining in chemonaive serous ovarian cancers and post chemotherapy treatment |
|||
|---|---|---|---|
Tissue |
n |
K5 immunostaining (positivity groups) |
|
< 10% |
≥ 10% |
||
Serous ovarian carcinomas (chemonaïve) |
106 |
36/106 |
70/106 |
Serous ovarian carcinoma (Post chemotherapy |
21 |
1/21 |
20/21 |
Fisher exact test |
P = 0.007 |
||
Relationship of KRT5 and KRT6 mRNA and K5/6 protein expression with patient outcome
Using the publically available Kaplan-Meir online plotter tool which incorporates gene expression data from 13 ovarian cancer sets including the TCGA dataset [31], high KRT5 expression was associated with reduced progression-free survival (PFS, HR 1.38; 95% CI 1.16–1.64, P < 0.0001, Figure 3A) and overall survival (OS, HR 1.28 95%; CI 1.05–1.56, P = 0.013, Figure 3B). High KRT6 expression was also associated with reduced PFS (HR 1.26; 95% CI 1.07–1.47, P = 0.005, Figure 3C) but not OS (Figure 3D). No statistical correlation was found between KRT5 or KRT6 expression with patient age at diagnosis, tumor stage, tumor grade, or size of residual tumor after cytoreductive surgery in the TCGA dataset (data not shown).
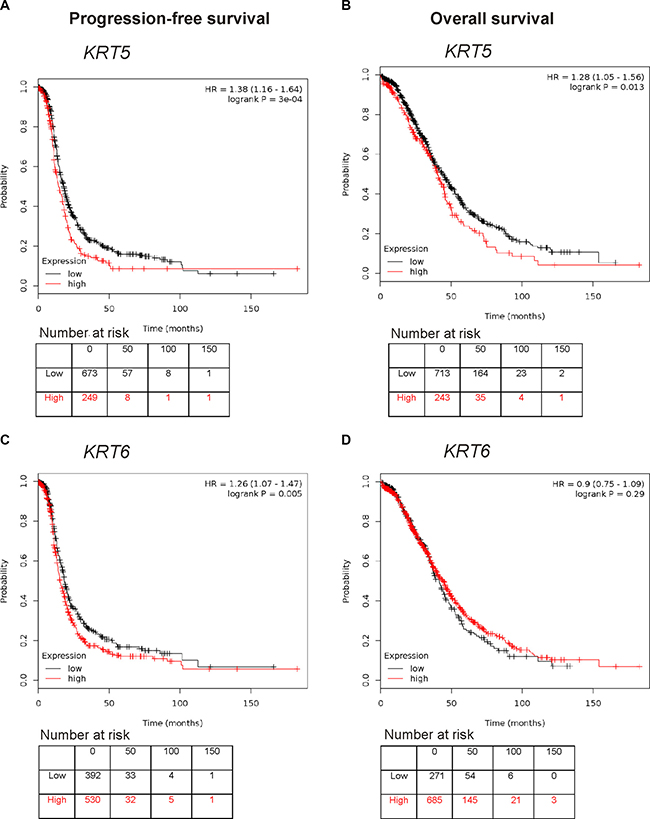
Figure 3: Kaplan Meier survival analysis showing association of KRT5 and KRT6 mRNA expression with patient outcome. (A) Progression-free survival curve in stage III/IV serous ovarian cancers patients with low or high levels of KRT5 (Affymetrix probe set 201820_at). (B) Overall survival curve in stage III/IV serous ovarian cancers patients with low or high levels of KRT5 (Affymetrix probeset 201820_at). (C) Progression-free survival curve in stage III/IV serous ovarian cancers patients with low or high levels of KRT6 (Affymetrix probeset 209126_x_at, which detects all KRT6 isoforms). (D) Overall survival curve in stage III/IV serous ovarian cancers patients with low or high levels of KRT6 (Affymetrix probeset 209126_x_at, which detects all KRT6 isoforms).
We confirmed in a cohort of advanced stage serous ovarian cancers that patients with high K5/6 or high K5 immunostaining (≥ 10.0%) had a significantly reduced PFS compared to patients with low K5/6 or low K5 positivity (< 10.0%, Figure 4A, 4C). The 24 months PFS rate was 34.4% in the group of patients with K5/6 positivity < 10% and only 10.5% in the group of patients with K5/6 positivity ≥ 10%. The 24 months PFS rate was 48.5% in the group of patients with K5 positivity < 10% and only 27.7% in the group of patients with K5 positivity ≥ 10%. Neither K5/6 nor K5 immunostaining was associated with OS (Figure 4B, 4D). Cox regression analysis also indicated that patients with high K5/6 positivity (≥ 10%) had a 1.78 fold increased risk of disease relapse (95% CI; 1.01–2.66, P = 0.017, Table 2). High K5 positivity was associated with a 1.90 fold increased risk of disease relapse (95% CI; 1.12–3.19, P = 0.017, Table 2). Other clinical and pathological parameters including patient age, clinical stage, tumor grade, and the presence of residual disease were not associated with PFS or OS in this advanced stage serous ovarian cancer cohort (Table 2).
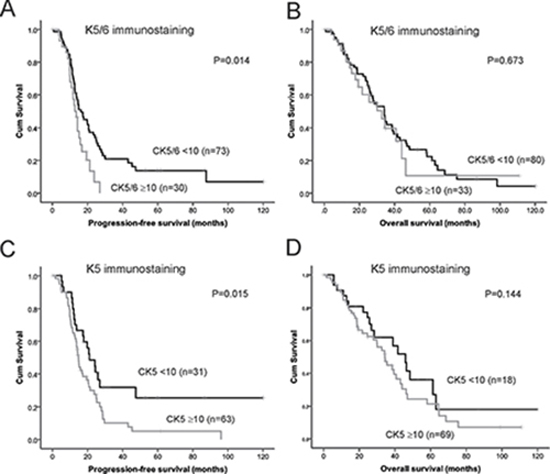
Figure 4: Kaplan Meier survival analysis showing association of expression of K5/6 and K5 alone with patient outcome. (A) Progression-free survival curve in stage III/IV serous ovarian cancers patients with high K5/6 immunostaining (≥ 10%, n = 30) and low K5/6 immunostaining (< 10%, n = 73, P = 0.014, log rank test). (B) Overall survival curve in stage III/IV serous ovarian cancers patients with high K5/6 immunostaining (> 10%, n = 33) and low K5/6 immunostaining (< 10%, n = 80, P = 0.673, log rank test). (C) Progression-free survival curve in stage III/IV serous ovarian cancers patients with high K5 immunostaining (≥ 10%, n = 63) and low K5 immunostaining (< 10%, n = 31, P = 0.015, log rank test). (D) Overall survival curve in stage III/IV serous ovarian cancers patients with high K5 immunostaining (≥ 10%, n = 69) and low K5 immunostaining (< 10%, n = 18, P = 0.144, log rank test).
Table 2: Univariate cox regression analyses for progression-free survival and overall survival
Progression-free survival |
Overall survival |
||||||
|---|---|---|---|---|---|---|---|
Variable |
Relative risk |
95% CI |
P value |
Variable |
Relative risk |
95% CI |
P value |
Agea |
1.23 |
0.80–1.90 |
0.340 |
Age (n = 120) |
1.25 |
0.79−1.97 |
0.342 |
Tumor stageb |
0.24 |
0.19–1.50 |
0.540 |
Tumor stage |
0.52 |
0.26−1.99 |
0.718 |
Tumor gradec |
0.89 |
0.57–1.62 |
0.962 |
Tumor grade (n = 122) |
0.96 |
0.57−1.70 |
0.985 |
Residual diseased |
1.47 |
0.75–2.88 |
0.260 |
Residual disease |
2.20 |
0.99−4.90 |
0.053 |
K5/6e |
1.78 |
1.01–2.66 |
0.017 |
K5/6 (n = 106) |
1.02 |
0.60−1.74 |
0.929 |
K5f |
1.90 |
1.12–3.19 |
0.017 |
K5 |
1.40 |
0.82−2.44 |
0.234 |
NOTE: P values highlighted in bold indicate P < 0.05.
a = Age a dichotomous variable, cut point < 55 vs ≥ 55.
b = Tumor stage (FIGO stage III vs FIGO stage IV).
c = Tumor grade (moderate vs poor).
d = Residual disease status (negative vs positive).
e = K5/6 (% positive cells) as a dichotomous variable, cut point < 10 vs ≥ 10.
f = K5 (% positive cells) as a dichotomous variable, cut point < 10 vs ≥ 10.
KRT5 mRNA and K5 protein levels are elevated following chemotherapy treatment
K5/6 was increased in serous ovarian cancer tissues following chemotherapy compared with chemonaïve tissues (P < 0.0001, Table 1B). Increased K5/6 immunostaining is evident in the images in Figure 2G and 2H that are an example of matching tissues from the same patient before and after chemotherapy treatment, respectively. Similar results were observed with the K5 monoclonal antibody (Table 1C, Supplementary Figure 1G and 1H). These findings are supported by mRNA expression studies in chemosensitive and chemoresistant primary ovarian cancer cells. KRT5 but not KRT6C mRNA expression was increased in primary cells derived from patients’ ascites with recurrent chemoresistant disease (n = 10) compared with primary cells from patients who responded to the chemotherapy treatment (n = 9; Figure 5A and 5B, P = 0.0006, Mann Whitney U test). KRT5 (Figure 5A), KRT6C mRNA (Figure 5B) and K5 protein (Figure 5C and 5D) were increased in OVCAR-5 cells made resistant to carboplatin (OVCAR-5-CBPR) compared with the parental OVCAR-5 cells by immunofluoresence. Furthermore, treatment with an IC50 dose of carboplatin significantly increased the number of K5+ cells in 4 serous ovarian cancer cell lines (OVCAR-5, OVCAR-3, OAW28 and COV362) (Figure 5C and 5D).
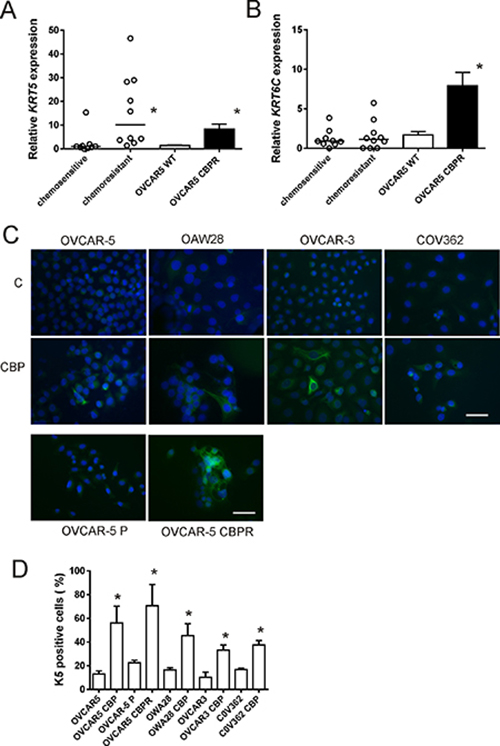
Figure 5: KRT5, KRT6C mRNA and K5 protein expression in serous ovarian cancer cell lines following chemotherapy treatment. KRT5 (A) and KRT6C (B) expression in chemotherapy resistant primary serous ovarian cancer cells (n = 10) compared to chemotherapy sensitive cells (n = 9) and OVCAR5 CBPR made resistant to carboplatin (CBP). KRT5 but not KRT6C was significantly increased in chemotherapy resistant cells (n = 10) compared to chemotherapy sensitive cells (n = 9, *P = 0.0006, Mann Whitney U test). Both KRT5 (*P < 0.0001, Mann Whitney U test) and KRT6C (*P = 0.0004, Mann Whitney U test) were significantly increased in CBP resistant OVCAR-5 CBPR cells compared to parental OVCAR-5 cells. Data for the primary cells is expressed as the mean fold change from 3-6 RNA samples from 2 independent experiments. Data for OVCAR5 cells is expressed as the mean fold change ± SEM from 10 individual RNA samples from 3 independent experiments. (C) K5 immunocytochemistry in serous ovarian cancer cells (OVCAR-5, OAW28, OVCAR-3 & COV362) ± 48 hr treatment with CBP IC50 and in parental OVCAR5 and CBP resistant OVCAR5 cells (OVCAR5 CBPR). (D) K5+ cells are increased following 48 hr treatment with an IC50 dose of CBP and the development of chemoresistance. *P < 0.05 (unpaired student t test), data is expressed as mean % positive cells ± SEM from 3-4 independent experiments.
DISCUSSION
High grade serous ovarian carcinomas account for nearly 70% of ovarian malignancies. They are characterized by high initial chemosensitivity to platinum based therapies, however 75% of patients relapse after treatment and subsequently become chemotherapy resistant [32]. The development of more effective molecularly targeted therapies to improve survival is urgently required. In this study we show that 1) KRT5 and KRT6C are expressed by ovarian cancer cell lines, 2) KRT5 expression levels predict reduced PFS and OS for serous ovarian cancer patients, 3) KRT6 expression levels predict reduced PFS but not OS for serous ovarian cancer patients, 4) Both high K5/6 or high K5 positivity in serous ovarian cancers can predict reduced PFS but not OS, 5) K5/6 and K5 immunostaining is increased in serous ovarian cancers following neoadjuvant chemotherapy, 6) KRT5 expression levels but not KRT6C are increased in serous primary cells derived from patients’ ascites with chemoresistant disease and 7) K5 protein expression is increased in serous ovarian cancer cell lines following carboplatin treatment. Our findings indicate that K5 expression could be used to predict serous ovarian cancer prognosis and may be used to identify cancer cells that are resistant to chemotherapy.
K5 is usually detected using a K5/6 combination monoclonal antibody (clones D5/16B4) as it is closely related to K6. Co-expression of K5 and K6 has been reported in a number of different types of neoplasms including basal cell carcinoma [33], prostate cancer [34, 35], ductal breast carcinoma [36–38], mesothelioma [39, 40], lung carcinomas [41], melanoma, basal cell carcinoma, and salivary gland tumors [22]. K5/6 overexpression is associated with poor prognosis of basal-like breast cancers [17, 18, 42] and was found to be an independent indicator of recurrence-free survival and/or OS in breast cancer [17, 19, 20, 43]. The K5/6 monoclonal antibody has been used for the diagnosis of poorly differentiated squamous carcinomas and undifferentiated nasopharyngeal carcinomas [21, 22]. It can distinguish between small cell lung carcinomas which are K5 negative and malignant mesothelioma which are K5 positive [21, 22]. K5/6 has superior sensitivity and reliability in differentiating between benign and malignant prostate glands when compared with K903 (high molecular weight keratins); and [34] it has been used successfully in a five antibody panel (which also targets TRIM29, CEACAM5, SLC7A5, MUC1) to better classify the subtypes of lung carcinoma [44]. The expression of K5/6 together with p63 has also been used to differentiate between adenosquamous carcinomas and adenocarcinomas in pleural effusion samples [45, 46]. Recently, K5 positive basal cells have also been identified as progenitors of bladder cancers [47].
Several studies have investigated the expression of K5/6 in ovarian cancer but to date K5 or K6 expression has not been linked with ovarian cancer outcome. The incidence of K5/6 positivity (29.9%, Table 1B) in our study was similar to that observed in previous ovarian cancer studies which ranged from 25% to 55.4% [22, 48, 49]. However we observed a higher proportion of serous carcinomas (66%, Table 1C) with high K5 immunostaining which is comparable to a recent study reporting 50% K5 positivity in serous ovarian carcinomas [50]. Our finding is in agreement with the study by Bhargava et al, 2008 who found that a monoclonal antibody to only K5 (clone XM26) was more sensitive than the K5/6 monoclonal antibodies (clones D5/16B4) in identifying basal-like breast carcinomas and reported a sensitivity of 97% for K5 but only 59% for K5/6 [18]. The K5 antibody (clone EPR1600Y) used in our study is raised to a synthetic peptide in the head domain of keratin 5 whilst the K5/6 antibody clones were raised against purified keratin proteins. It has been suggested that the lower sensitivity of the K5/6 antibodies by immunohistochemistry may be caused by an interference between each other’s antigenic binding sites by steric hindrance [18].
Gene expression studies have previously identified only KRT5 mRNA and not KRT6 isoforms in normal breast and basal-like breast cancer in humans [11, 21, 51]. Consequently in normal breast tissues and cancer, the K5/6 antibody is thought to target only K5 [52]. We found LP-9 peritoneal cells to express KRT6C but not KRT5. We confirmed that K6 protein is expressed in ovarian cancer cell lines and LP-9 cells but only faint K5 bands could be detected with K5/6 in OVCAR-5, OV-90 and SKOV-3 cell extracts. The low expression of K5 protein in ovarian cancer cell lines was confirmed by immunofluorescence as only 10–15% of ovarian cancer cells had detectable K5 protein without carboplatin treatment (see Figure 5C and 5D). The observed molecular weights of K5 (56 kDa) and K6 (52 kDa) were close to the predicted molecular weight of K5 (62 kDa) and K6 (60 kDa), respectively, and consistent with previous studies that have observed K5 at 56 kDa in rat liver cancer [53] and K6 at 50 kDa in bladder cancer [54].
K5/K14 form the main keratins in keratinocytes of stratified squamous epithelia of the epidermis as well as mucosal non-keratinizing stratified squamous epithelia [9]. K5 is strongly expressed in the undifferentiated basal cell layer which contains stem cells and is reduced in the differentiating suprabasal cell layers [7]. Our immunostaining in human skin using the K5/6 and K5 antibodies concur with this finding. Recent studies have reported that K5/K14 modulates cell proliferation and cell differentiation in the stratified epithelia via the P13K/Akt pathway and K5/K14 negatively regulates cell differentiation via the Notch 1 signaling pathway [55]. Consequently K5/K14 is thought to play an important role in the maintenance of cell proliferation in the basal layer of stratified epithelia. It is likely that K5 regulates similar pathways in serous ovarian cancer cells.
Greater than 50% of ER+PR+ tumors contain ER-PR-K5+ subpopulations [26] and K5+ cells are increased in ER+ breast tumors following treatment with neoadjuvant endocrine therapy [25]. ER-PR-K5+ luminal breast cancer cell populations, termed ‘luminobasal’ cells exhibiting enhanced progenitor properties can be induced by progestins, glucocorticoids, as well as mineralocorticoids [26, 56–58] and blocked by anti-progestins and prolactin [57]. Interestingly, these K5+ breast cancer cells were found to be less sensitive to 5-fluorouracil and docetaxel in in vitro culture and exhibited reduced apoptosis [25]. A recent study investigated metastasis formation in ovariectomized mice injected with luminal breast cancer cell lines and assessed the metastatic process following treatment with estradiol or estradiol + progestin [59]. The untreated ovariectomized mice were metastasis-free until they were supplemented with estradiol or estradiol + progestin. Unlike the parental cells that were predominately ER+PR+K5- the metastases formed following estradiol or estradiol + progestin contained significantly increased proportions of ER-PR-K5+ cells (6–30%). This finding may have important implications for women on hormonal contraception or replacement therapy who may harbor dormant K5+ micrometastases. It has also been suggested that basal-like breast cancers in BRCA1 deficient women may potentially arise from K5+ luminal progenitors [23]. Compounds that can effectively target these K5+ cells have the potential to improve the outcome of luminal breast cancers and basal-like breast cancers. Targeting K5+ cells may also be effective in reducing recurrence in patients with serous ovarian carcinoma. Indeed many similarities have been observed between basal-like breast cancers and serous ovarian carcinoma [60].
A recent study by Corr et al (2015) demonstrating that K5+ ovarian cancer cells were more resistant to cisplatin-induced apoptosis than K5- cells has suggested that K5 is a marker of a chemoresistant subpopulation of ovarian cancer cells [50]. Their observation that the number of K5+ cells increased following cisplatin treatment agrees with the carboplatin data presented in our study. We additionally showed that K5 and K5/6 immunostaining is significantly increased following neoadjuvant chemotherapy treatment and that KRT5 mRNA is increased in chemoresistant compared to chemosensitive serous primary ovarian cancer. These findings support the notion that K5 plays an important role in the development chemotherapy resistance.
In conclusion, this study found for the first time that serous ovarian carcinomas with increased KRT5 and KRT6 mRNA expression, as well as increased K5 or K5/6 immunostaining have an increased risk of disease relapse. K5/6 and K5 expression may therefore be used for predicting the prognosis of serous ovarian cancer patients and to aid patient management. In addition our findings that K5 is increased following carboplatin treatment and in chemotherapy resistance cells suggest that K5 could also be used to identify cancer cells that are resistant to chemotherapy. Developing strategies to target K5 may prevent recurrence and chemotherapy resistance in serous ovarian cancer patients.
MATERIALS AND METHODS
Cell culture
The human ovarian cancer cell lines OVCAR-3, SKOV-3, and OV-90 were purchased from American Type Culture Collection (ATCC, VA, USA). OVCAR-5 cells were obtained from Dr Thomas Hamilton (Fox Chase Cancer Center, PA, USA) and the peritoneal cells, LP-9 were purchased from Coriell Cell Repositories (NJ, USA). COV362 and OAW28 were purchased from the European Collection of Cell culture (ECCC). OV-90, OVCAR-3, SKOV-3 and OVCAR-5 cell lines were grown in RPMI 1640 media (cat no. R8758, Sigma Adrich, St Louis, USA) whilst COV362 and OAW28 were grown in DMEM media (cat no. 10567-022, Gibco, Life Technologies, Mulgrave, Vic, Australia). All cell lines are cultured with 10% fetal bovine serum (Sigma Aldrich) and maintained at 37°C in an environment of 5% CO2. OVCAR-5 cells were made resistant to carboplatin (OVCAR-5 CBPR) following treatment with 8 cycles of carboplatin (CBP, 50 μM, Hospira Australia Pty, Ltd). The OVCAR-5 CBPR cells exhibited an IC50 (273 μM) to carboplatin that was nearly 3-fold higher than that for the parental OVCAR-5 cells (99 μM) (data not shown)
Primary ovarian cancer cells were derived from ascites collected from serous ovarian cancer patients after informed consent and with approval of the Royal Adelaide Hospital Human Ethics Committee as described previously [61]. All primary cells were grown in Advanced RPMI 1640 medium (cat no 12633-020) supplemented with 4 mM L-glutamine, 10% FBS (Sigma Aldrich, St Louis, MO, USA) and antibiotics (100 U penicillin G, 100 μg/ml streptomycin sulfate and 100 μg/ml amphotericin B, Sigma Aldrich). Methods were carried out in accordance with the approved guidelines. The clinicopathological characteristics of the patients whose ascites was used to isolate the primary cells are shown in Supplementary Table 2.
Quantitative real-time PCR
Cells were plated at 5,000 cells in 96 well plates and cultured until confluence for 72–96 hr. Total RNA was isolated and reverse transcribed using the TaqMan® Gene expression Cells-to-CT™ kit (Applied Biosystems, Mulgrave, Victoria, Australia), as per the manufacturer’s instructions. Briefly, lysis solution with DNAse was added to each well and incubated for 5 min at room temperature. Stop solution was then added to each well and mixed. The lysate (10 μl) was added to a 40 μl reverse transcription master mix and reverse transcribed for 1 hr. Resultant cDNA was stored as 50 μl aliquots at −20°C for qRT-PCR analysis. qRT-PCR reactions were performed on triplicate samples using TaqMan® primer sets for KRT5 (Hs00361185_m1), KRT6C (Hs00752476_s1) using the Quantstudio 12K Flex Real Time PCR System (Applied Biosystems). Briefly, PCR reactions were made up to 10 μl and contained TaqMan® Gene Expression Master Mix (2×), primers for the gene of interest, nuclease free water, and the sample cDNA. PCR cycling conditions were as follows: 50°C for 2 min, 95°C for 10 min (with 40 cycles following of 95°C for 15 sec), and 60°C for 1 min. CT values were normalised to the house keeping gene β-actin (Human ACTB 4333762, Applied Biosystems) and calibrator using the 2−ΔΔCT method.
Western immunoblotting
OVCAR-5, OVCAR-3, OV-90, SKOV-3, and LP-9 cells a were grown to 80% confluence in 75 cm2 flasks (Corning, Sigma Aldrich) and cell extracts were collected. Cells were dislodged using a cell scraper and resuspended in 200 μl of RIPA buffer (1% Nonidet P-40, 1% sodium deoxycholate, 0.1% SDS, 0.15 M sodium chloride, 50 mM Tris- HCL and 1 mM EDTA, pH 8.0 with protease inhibitor) and spun at 7000 rpm (Eppendorf 5424 centrifuge) for 10 min and stored at −20°C. Equal amounts of protein were electrophoresed and transferred to PVDF membranes (GE Healthcare, Little Chalfont, England) as described previously [3]. Proteins bands were detected with mouse monoclonal K5/6 antibody (1/200, clone D5/16 B4, Dako, Glostrup, Denmark) or K5 rabbit monoclonal antibody (1/5000, clone EPR1600Y, Abcam Ab75869, Melbourne, Vic, Australia) with anti-mouse or anti-rabbit IgG peroxidase-conjugated secondary antibodies, enhanced chemiluminescence, and autoradiography as described previously [3]. β-actin mouse monoclonal antibody (1/10,000, clone AC-15, Sigma Aldrich A3854) was used as a loading control. Ovarian cancer tissue extracts prepared in RIPA buffer with high K5/6 and K5 immunostaining used as positive controls for the western blots.
Tissue cohort
Tissue sections were obtained from formalin fixed paraffin embedded blocks from normal ovaries (n = 8), benign serous tumors (n = 8), serous borderline tumors (n = 10), and primary advanced stage (FIGO stage III/IV) serous ovarian cancers (n = 126). The cancer tissues were assembled into tissue microarrays (TMAs, 1 mm triplicate cores) from archived tissue (cancer areas identified by pathologist, AR) obtained from serous ovarian cancer patients diagnosed between 1988 and 2012. An additional 21 tissues were obtained from patients with high grade serous cancer after they had received neoadjuvent chemotherapy. Approval was obtained from the Royal Adelaide Hospital Human Ethics Committee and methods were carried out in accordance with the approved guidelines. Detailed pathological and clinical characteristics of the patient samples are summarized in Supplementary Table 3.
Analysis of public databases
The Kaplan-Meier plotter tool (http://kmplot.com/analysis/) was used to generate survival curves combining KRT5 (Affymetrix probe 201820_at) and KRT6 (Affymetrix probe 209126_x_at detects all KRT6 isoforms) mRNA data from 13 public ovarian cancer datasets [31]. The Kaplan-Meier analysis was performed on the 2015 version database (n = 1648) and patients were split by the best cut-off selected by the online plotter tool [31]. PFS and OS data was available for 922 and 956 stage III/IV serous ovarian cancer patients, respectively. cBioPortal (http://www.cbioportal.org/) was used to assess correlations between KRT5 and KRT6 expression levels with clinicopathological parameters features in the TCGA 2011 dataset [62, 63].
Immunohistochemistry
Immunohistochemistry was performed as previously described [64]. Briefly, tissue sections (5 μm) underwent microwave antigen retrieval for 10 minutes at 100°C in a steam microwave (Sixth Sense, Whirlpool, VIC, Australia) in 10 mM Tris buffer, 1 mM EDTA (pH 9.0). Sections were incubated overnight with mouse monoclonal antibody which detects both K5 and K6 (1/50, clone D5/16 B4, Dako) or K5 rabbit monoclonal antibody (1/400, clone EPR1600Y, Abcam Ab75869), in blocking buffer (5% normal goat serum) at 4°C. Visualization of immunoreactivity was achieved using biotinylated anti-mouse or anti-rabbit immunoglobulins streptavidin-peroxidase conjugate, diaminobenzidine substrate as described previously [3]. Human skin was used as a positive control and negative controls included tissues incubated with no primary antibody or with mouse or rabbit immunoglobulins. Slides were digitally scanned using the NanoZoomer Digital Pathology System (Hamamatsu Photonics, SZK, Japan) and images were collected using NDP view imaging software (NDP scan software v2.2, Hamamatsu Photonics). K5/6 or K5 expression was quantified using a visual grading system based on the extent of staining. Percentage of positive tumor cells was graded on a scale from 0–3; 0 = none, 1 = 1–9 %, 2 = 10–50%, 3 = > 50% by two independent assessors used previously for breast cancer [65, 66]. High K5/6 or K5 immunostaining was defined as ≥ 10% positivity and < 10% was defined as low K5/6 or K5 immunostaining.
Immunocytochemistry
Ovarian cancer cells (2 × 10⁴ cells/well) were plated in 8 well tissue culture chamber slides (Nunclon™ Lab-Tek II Chamber slide, RS Glass Slide, Naperville, IL) in 500 μl 10% FBS RPMI for 24 h and treated for 48 h with IC50 concentration of CBP or control media. CBP IC50 for serous ovarian cancer cell lines were previously determined to be ~100 μM for OVCAR-5, OVCAR-3 and OAW28 cells and 500 μM for COV362 cells. Cells were fixed with cold 100% methanol (5 min) and cold 100% acetone (3 min), washed with PBS and blocked with 5% goat serum and incubated overnight with rabbit monoclonal K5 (1/50, clone EPR1600Y, Abcam Ab75869). K5 was visualized with goat anti-rabbit Alexa Fluor® 488 (1/200, 1hr at RT, catalogue no. A11034, Molecular Probes, Life Technologies) and slides were mounted with Prolong Gold Antifade Mountant with Dapi (catalogue no. P36941, Molecular Probes, Life Technologies). Cells were viewed with an epifluorescence microscope (BX50, Olympus Australia) and imaged using a 40× objective and a Spot RT digital camera (Diagnostic Instruments, Sterling Heights, MI). Negative controls included rabbit immunoglobulin or no primary antibody. The percentage of K5+ cells in controls and following carboplatin treatment were evaluated in 5 high power images (~100–200 cells).
Statistical analyses
All statistical analyses were performed using SPSS for Windows software (Version 21.0, SPSS Inc., Chicago, IL, USA). Chi-squared test was performed to determine the correlation of K5/6 immunostaining in ovarian tumor tissues with clinical and pathological parameters. The Mann Whitney U test was used to assess differences between KRT5 and KRT6C expression in the chemotherapy sensitive and chemotherapy resistant primary serous ovarian cancer cells and the parental OVCAR-5 and carboplatin resistant OVCAR-5 CBPR cells. The one way ANOVA with the Dunnet C Post hoc test was used to assess differences between Z scores for KRT5 and KRT6 expression and clinical parameters as data was normally distributed. Kaplan-Meier and univariate Cox Regression analyses were performed to assess the association of K5/6 expression in the advanced stage ovarian cancer TMA cohort with PFS and OS. Relapse or death due to ovarian cancer was used as the endpoint to determine whether KRT5, or KRT6C expression and K5/6 positivity was associated with PFS or OS. Statistical significance was accepted at P < 0.05.
Abbreviations
CBP, carboplatin CM, conditioned media; HR; hazard ratio, PFS, progression-free survival; OSE, ovarian surface epithelium; OS, overall survival; TMA, tissue microarray.
ACKNOWLEDGMENTS AND FUNDING
We thank Dr. Thomas Hamilton (Fox Chase Cancer Center, Philadelphia, PA) for kindly providing the OVCAR-5 cell line, Mrs Wendy Bonner, Ms Rachel Ho, Ms Hongmei Xie and Ms Zoe Price for their help with the K5/6 and K5 immunostaining. This research has been funded by the Ovarian Cancer Research Foundation (OCRF), Australia and the Cancer Council South Australia’s Beat Cancer Project on behalf of its donors and the State Government of South Australia through the Department of Health. CR is currently supported by the Lin Huddleston Ovarian Cancer Fellowship funded by the Cancer Council South Australia and the School of Medicine, University of Adelaide.
CONFLICTS OF INTEREST
None.
REFERENCES
1. Torre LA, Bray F, Siegel RL, Ferlay J, Lortet-Tieulent J, Jemal A. Global cancer statistics, 2012. CA Cancer J Clin. 2015; 65:87–108.
2. Coleman RL, Monk BJ, Sood AK, Herzog TJ. Latest research and treatment of advanced-stage epithelial ovarian cancer. Nat Rev Clin Oncol. 2013; 10:211–224.
3. Ween MP, Lokman NA, Hoffmann P, Rodgers RJ, Ricciardelli C, Oehler MK. Transforming growth factor-beta-induced protein secreted by peritoneal cells increases the metastatic potential of ovarian cancer cells. Int J Cancer. 2011; 128:1570–1584.
4. Lokman NA, Elder AS, Ween MP, Pyragius CE, Hoffmann P, Oehler MK, Ricciardelli C. Annexin A2 is regulated by ovarian cancer-peritoneal cell interactions and promotes metastasis. Oncotarget. 2013; 4:1199–1211. doi: 10.18632/oncotarget.1122.
5. Ricciardelli C, Lokman NA, Ween MP, Oehler M. Ovarian cancer-peritoneal cell interactions promote extracellular matrix processing. Endocr Relat Cancer. 2016; 23, T155-T168.
6. Pallari HM, Eriksson JE. Intermediate filaments as signaling platforms. Sci STKE. 2006; 2006:pe53.
7. Moll R, Divo M, Langbein L. The human keratins: biology and pathology. Histochem Cell Biol. 2008; 129:705–733.
8. Karantza V. Keratins in health and cancer: more than mere epithelial cell markers. Oncogene. 2011; 30:127–138.
9. Moll R, Franke WW, Schiller DL, Geiger B, Krepler R. The catalog of human cytokeratins: patterns of expression in normal epithelia, tumors and cultured cells. Cell. 1982; 31:11–24.
10. Gusterson BA, Ross DT, Heath VJ, Stein T. Basal cytokeratins and their relationship to the cellular origin and functional classification of breast cancer. Breast Cancer Res. 2005; 7:143–148.
11. Bocker W, Moll R, Poremba C, Holland R, Van Diest PJ, Dervan P, Burger H, Wai D, Ina Diallo R, Brandt B, Herbst H, Schmidt A, Lerch MM, et al. Common adult stem cells in the human breast give rise to glandular and myoepithelial cell lineages: a new cell biological concept. Lab Invest. 2002; 82:737–746.
12. Yamany T, Van Batavia J, Mendelsohn C. Formation and regeneration of the urothelium. Curr Opin Organ Transplant. 2014; 19:323–330.
13. Rogers MA, Edler L, Winter H, Langbein L, Beckmann I, Schweizer J. Characterization of new members of the human type II keratin gene family and a general evaluation of the keratin gene domain on chromosome 12q13.13. J Invest Dermatol. 2005; 124:536–544.
14. Schweizer J, Bowden PE, Coulombe PA, Langbein L, Lane EB, Magin TM, Maltais L, Omary MB, Parry DA, Rogers MA, Wright MW. New consensus nomenclature for mammalian keratins. J Cell Biol. 2006; 174:169–174.
15. Grimm SL, Bu W, Longley MA, Roop DR, Li Y, Rosen JM. Keratin 6 is not essential for mammary gland development. Breast Cancer Res. 2006; 8:R29.
16. Schmelz M, Moll R, Hesse U, Prasad AR, Gandolfi JA, Hasan SR, Bartholdi M, Cress AE. Identification of a stem cell candidate in the normal human prostate gland. Eur J Cell Biol. 2005; 84:341–354.
17. Abd El-Rehim DM, Pinder SE, Paish CE, Bell J, Blamey RW, Robertson JF, Nicholson RI, Ellis IO. Expression of luminal and basal cytokeratins in human breast carcinoma. J Pathol. 2004; 203:661–671.
18. Bhargava R, Beriwal S, McManus K, Dabbs DJ. CK5 is more sensitive than CK5/6 in identifying the “basal-like” phenotype of breast carcinoma. Am J Clin Pathol. 2008; 130:724–730.
19. Nielsen TO, Hsu FD, Jensen K, Cheang M, Karaca G, Hu Z, Hernandez-Boussard T, Livasy C, Cowan D, Dressler L, Akslen LA, Ragaz J, Gown AM, et al. Immunohistochemical and clinical characterization of the basal-like subtype of invasive breast carcinoma. Clin Cancer Res. 2004; 10:5367–5374.
20. Liu H, Fan Q, Zhang Z, Li X, Yu H, Meng F. Basal-HER2 phenotype shows poorer survival than basal-like phenotype in hormone receptor-negative invasive breast cancers. Human Pathol. 2008; 39:167–174.
21. Moll R. Cytokeratins as markers of differentiation in the diagnosis of epithelial tumors. Sub-cellular Biochem. 1998; 31:205–262.
22. Chu PG, Weiss LM. Expression of cytokeratin 5/6 in epithelial neoplasms: an immunohistochemical study of 509 cases. Mod Pathol. 2002; 15:6–10.
23. Lim E, Vaillant F, Wu D, Forrest NC, Pal B, Hart AH, Asselin-Labat ML, Gyorki DE, Ward T, Partanen A, Feleppa F, Huschtscha LI, Thorne HJ, et al. Aberrant luminal progenitors as the candidate target population for basal tumor development in BRCA1 mutation carriers. Nature Med. 2009; 15:907–913.
24. Horwitz KB, Dye WW, Harrell JC, Kabos P, Sartorius CA. Rare steroid receptor-negative basal-like tumorigenic cells in luminal subtype human breast cancer xenografts. Proc Natl Acad Sci U S A. 2008; 105:5774–5779.
25. Kabos P, Haughian JM, Wang X, Dye WW, Finlayson C, Elias A, Horwitz KB, Sartorius CA. Cytokeratin 5 positive cells represent a steroid receptor negative and therapy resistant subpopulation in luminal breast cancers. Breast Cancer Res Treat. 2011; 128:45–55.
26. Haughian JM, Pinto MP, Harrell JC, Bliesner BS, Joensuu KM, Dye WW, Sartorius CA, Tan AC, Heikkila P, Perou CM, Horwitz KB. Maintenance of hormone responsiveness in luminal breast cancers by suppression of Notch. Proc Natl Acad Sci USA. 2012; 109:2742–2747.
27. Wauters CC, Smedts F, Gerrits LG, Bosman FT, Ramaekers FC. Keratins 7 and 20 as diagnostic markers of carcinomas metastatic to the ovary. Hum Pathol. 1995; 26:852–855.
28. Wang YF, Lang HY, Yuan J, Wang J, Wang R, Zhang XH, Zhang J, Zhao T, Li YR, Liu JY, Zeng LH, Guo GZ. Overexpression of keratin 17 is associated with poor prognosis in epithelial ovarian cancer. Tumour Biol. 2013; 34:1685–1689.
29. Tempfer C, Hefler L, Heinzl H, Loesch A, Gitsch G, Rumpold H, Kainz C. CYFRA 21-1 serum levels in women with adnexal masses and inflammatory diseases. Brit J Cancer. 1998; 78:1108–1112.
30. Liu M, Mor G, Cheng H, Xiang X, Hui P, Rutherford T, Yin G, Rimm DL, Holmberg J, Alvero A, Silasi DA. High frequency of putative ovarian cancer stem cells with CD44/CK19 coexpression is associated with decreased progression-free intervals in patients with recurrent epithelial ovarian cancer. Reprod Sci. 2013; 20:605–615.
31. Gyorffy B, Lanczky A, Szallasi Z. Implementing an online tool for genome-wide validation of survival-associated biomarkers in ovarian-cancer using microarray data from 1287 patients. Endocr Relat Cancer. 2012; 19:197–208.
32. Colombo PE, Fabbro M, Theillet C, Bibeau F, Rouanet P, Ray-Coquard I. Sensitivity and resistance to treatment in the primary management of epithelial ovarian cancer. Crit Rev Oncol Hematol. 2014; 89:207–16.
33. Markey AC, Lane EB, Macdonald DM, Leigh IM. Keratin expression in basal cell carcinomas. British J Dermatol. 1992; 126:154–160.
34. Abrahams NA, Ormsby AH, Brainard J. Validation of cytokeratin 5/6 as an effective substitute for keratin 903 in the differentiation of benign from malignant glands in prostate needle biopsies. Histopathol. 2002; 41:35–41.
35. Wang W, Bergh A, Damber JE. Morphological transition of proliferative inflammatory atrophy to high-grade intraepithelial neoplasia and cancer in human prostate. Prostate. 2009; 69:1378–1386.
36. Ribeiro-Silva A, Ramalho LN, Garcia SB, Brandao DF, Chahud F, Zucoloto S. p63 correlates with both BRCA1 and cytokeratin 5 in invasive breast carcinomas: further evidence for the pathogenesis of the basal phenotype of breast cancer. Histopathol. 2005; 47:458–466.
37. Mohammadizadeh F, Naimi A, Rajabi P, Ghasemibasir H, Eftekhari A. Expression of basal and luminal cytokeratins in breast cancer and their correlation with clinicopathological prognostic variables. Indian J Med Sci. 2009; 63:152–162.
38. Kuo WH, Chang YY, Lai LC, Tsai MH, Hsiao CK, Chang KJ, Chuang EY. Molecular characteristics and metastasis predictor genes of triple-negative breast cancer: a clinical study of triple-negative breast carcinomas. PloS one. 2012; 7:e45831.
39. Moran CA, Albores-Saavedra J, Suster S. Primary peritoneal mesotheliomas in children: a clinicopathological and immunohistochemical study of eight cases. Histopathol. 2008; 52:824–830.
40. Ismail HM, Nouh MA, Abulkheir IL, Abd El-Rahman Ael R, Tawfik HN. Pleural mesothelioma: diagnostic problems and evaluation of prognostic factors. J Egypt Natl Canc Inst. 2006; 18:303–310.
41. Miettinen M, Sarlomo-Rikala M. Expression of calretinin, thrombomodulin, keratin 5, and mesothelin in lung carcinomas of different types: an immunohistochemical analysis of 596 tumors in comparison with epithelioid mesotheliomas of the pleura. Am J Surg Pathol. 2003; 27:150–158.
42. Bhalla A, Manjari M, Kahlon SK, Kumar P, Kalra N. Cytokeratin 5/6 expression in benign and malignant breast lesions. Indian J Pathol Microbiol. 2010; 53:676–680.
43. Inanc M, Ozkan M, Karaca H, Berk V, Bozkurt O, Duran AO, Ozaslan E, Akgun H, Tekelioglu F, Elmali F. Cytokeratin 5/6, c-Met expressions, and PTEN loss prognostic indicators in triple-negative breast cancer. Med Oncol. 2014; 31:801.
44. Ring BZ, Seitz RS, Beck RA, Shasteen WJ, Soltermann A, Arbogast S, Robert F, Schreeder MT, Ross DT. A novel five-antibody immunohistochemical test for subclassification of lung carcinoma. Mod Pathol. 2009; 22:1032–1043.
45. Ko CJ, Leffell DJ, McNiff JM. Adenosquamous carcinoma: a report of nine cases with p63 and cytokeratin 5/6 staining. J Cutan Pathol. 2009; 36:448–452.
46. Khayyata S, Yun S, Pasha T, Jian B, McGrath C, Yu G, Gupta P, Baloch Z. Value of P63 and CK5/6 in distinguishing squamous cell carcinoma from adenocarcinoma in lung fine-needle aspiration specimens. Diagn Cytopathol. 2009; 37:178–183.
47. Van Batavia J, Yamany T, Molotkov A, Dan H, Mansukhani M, Batourina E, Schneider K, Oyon D, Dunlop M, Wu XR, Cordon-Cardo C, Mendelsohn C. Bladder cancers arise from distinct urothelial sub-populations. Nat Cell Biol. 2014; 16:982–991, 981–985.
48. Ordonez NG. The diagnostic utility of immunohistochemistry and electron microscopy in distinguishing between peritoneal mesotheliomas and serous carcinomas: a comparative study. Mod Pathol. 2006; 19:34–48.
49. Nofech-Mozes S, Khalifa MA, Ismiil N, Saad RS, Hanna WM, Covens A, Ghorab Z. Immunophenotyping of serous carcinoma of the female genital tract. Mod Pathol. 2008; 21:1147–1155.
50. Corr BR, Finlay-Schultz J, Rosen RB, Qamar L, Post MD, Behbakht K, Spillman MA, Sartorius CA. Cytokeratin 5-Positive Cells Represent a Therapy Resistant subpopulation in Epithelial Ovarian Cancer. Int J Gynecol Cancer. 2015; 25:1565–1573.
51. Perou CM, Sorlie T, Eisen MB, van de Rijn M, Jeffrey SS, Rees CA, Pollack JR, Ross DT, Johnsen H, Akslen LA, Fluge O, Pergamenschikov A, Williams C, et al. Molecular portraits of human breast tumours. Nature. 2000; 406:747–752.
52. Rakha EA, El-Sayed ME, Reis-Filho J, Ellis IO. Patho-biological aspects of basal-like breast cancer. Breast Cancer Res Treat. 2009; 113:411–422.
53. Barboro P, D’Arrigo C, Repaci E, Bagnasco L, Orecchia P, Carnemolla B, Patrone E, Balbi C. Proteomic analysis of the nuclear matrix in the early stages of rat liver carcinogenesis: identification of differentially expressed and MAR-binding proteins. Exp Cell Res. 2009; 315:226–239.
54. Ostergaard M, Rasmussen HH, Nielsen HV, Vorum H, Orntoft TF, Wolf H, Celis JE. Proteome profiling of bladder squamous cell carcinomas: identification of markers that define their degree of differentiation. Cancer Res. 1997; 57:4111–4117.
55. Alam H, Sehgal L, Kundu ST, Dalal SN, Vaidya MM. Novel function of keratins 5 and 14 in proliferation and differentiation of stratified epithelial cells. Mol Biol Cell. 2011; 22:4068–4078.
56. Axlund SD, Yoo BH, Rosen RB, Schaack J, Kabos P, Labarbera DV, Sartorius CA. Progesterone-inducible cytokeratin 5-positive cells in luminal breast cancer exhibit progenitor properties. Horm Cancer. 2013; 4:36–49.
57. Sato T, Tran TH, Peck AR, Girondo MA, Liu C, Goodman CR, Neilson LM, Freydin B, Chervoneva I, Hyslop T, Kovatich AJ, Hooke JA, Shriver CD, et al. Prolactin suppresses a progestin-induced CK5-positive cell population in luminal breast cancer through inhibition of progestin-driven BCL6 expression. Oncogene. 2014; 33:2215–2224.
58. Goodman CR, Sato T, Peck AR, Girondo MA, Yang N, Liu C, Yanac AF, Kovatich AJ, Hooke JA, Shriver CD, Mitchell EP, Hyslop T, Rui H. Steroid induction of therapy-resistant cytokeratin-5-positive cells in estrogen receptor-positive breast cancer through a BCL6-dependent mechanism. Oncogene. 2016; 35:1373–1385.
59. Ogba N, Manning NG, Bliesner BS, Ambler S, Haughian JM, Pinto MP, Jedlicka P, Joensuu K, Heikkila P, Horwitz KB. Luminal breast cancer metastases and tumor arousal from dormancy are promoted by direct actions of estradiol and progesterone on the malignant cells. Breast Cancer Res. 2014; 16:489.
60. Jonsson JM, Johansson I, Dominguez-Valentin M, Kimbung S, Jonsson M, Bonde JH, Kannisto P, Masback A, Malander S, Nilbert M, Hedenfalk I. Molecular subtyping of serous ovarian tumors reveals multiple connections to intrinsic breast cancer subtypes. PloS one. 2014; 9:e107643.
61. Ricciardelli C, Lokman NA, Cheruvu S, Tan IA, Ween MP, Pyragius CE, Ruszkiewicz A, Hoffmann P, Oehler MK. Transketolase is upregulated in metastatic peritoneal implants and promotes ovarian cancer cell proliferation. Clin Exp Metastasis. 2015; 32:441–455.
62. Gao J, Aksoy BA, Dogrusoz U, Dresdner G, Gross B, Sumer SO, Sun Y, Jacobsen A, Sinha R, Larsson E, Cerami E, Sander C, Schultz N. Integrative analysis of complex cancer genomics and clinical profiles using the cBioPortal. Sci Signal. 2013; 6:pl1.
63. Cerami E, Gao J, Dogrusoz U, Gross BE, Sumer SO, Aksoy BA, Jacobsen A, Byrne CJ, Heuer ML, Larsson E, Antipin Y, Reva B, Goldberg AP, et al. The cBio cancer genomics portal: an open platform for exploring multidimensional cancer genomics data. Cancer Discov. 2012; 2:401–404.
64. Lokman NA, Elder AS, Ricciardelli C, Oehler MK. Chick Chorioallantoic Membrane (CAM) Assay as an In Vivo Model to Study the Effect of Newly Identified Molecules on Ovarian Cancer Invasion and Metastasis. Int J Mol Sci. 2012; 13:9959–9970.
65. Otterbach F, Bankfalvi A, Bergner S, Decker T, Krech R, Boecker W. Cytokeratin 5/6 immunohistochemistry assists the differential diagnosis of atypical proliferations of the breast. Histopathol. 2000; 37:232–240.
66. Martin-Castillo B, Lopez-Bonet E, Buxo M, Dorca J, Tuca-Rodriguez F, Ruano MA, Colomer R, Menendez JA. Cytokeratin 5/6 fingerprinting in HER2-positive tumors identifies a poor prognosis and trastuzumab-resistant basal-HER2 subtype of breast cancer. Oncotarget. 2015; 6:7104–7122. doi: 10.18632/oncotarget.3106.