
INTRODUCTION
There is a close relationship between metabolism and cancer. Cancer cell metabolism undergoes a profound rearrangement featured by changes in metabolic networks mostly involved in bioenergetic and biosynthetic processes [1]. This metabolic switch represents an adaption to support cell survival, tumor growth, tissue remodeling, and cancer metastasis. But whereas available evidence suggest that this metabolic adaption is regulated by a genomic program and influenced by the tumor microenvironment, in some circumstances altered metabolism can play a primary role in oncogenesis [1, 2]. Furthermore, metabolism can also determine the course of the cancerous process or even lead to an adverse drug response.
Breast cancer is the most common malignancy and cause of cancer death in women [3, 4]. Common methods for diagnosis and surveillance include mammography, histopathology and blood tests (such as antigens and protein patterns). Since the success for curative intervention and significantly increase long-term survival rates in breast cancer is in early stage disease, more sensitive biomarkers for early detection and molecular targets for better treating breast cancer are needed.
In this setting new profiling tools provide a global picture of tumor biology including development and progression. The comprehensive analysis of metabolites (‘metabolomics’), by high-resolution 1H nuclear magnetic resonance (NMR) spectroscopy and mass spectrometry (MS), are being currently used to identify and define the metabolic phenotype of subcellular organelles, cell types, or tissues. These metabolomics approaches are providing key information about oncogenesis, uncovering potential new therapeutic targets and will be a key tool in cancer diagnosis [1, 5, 6].
The human plasma metabolome is composed of around 4,229 confirmed compounds that can be grouped into more than 50 chemical classes [7]. Plasma metabolome profile is the result of a homeostatic system that expresses, in a bidirectional interaction, cellular needs and specific physiological cell-tissue states. Consequently, cell-tissue cancer could modify the chemical composition of blood plasma/serum, analogously to the association of specific metabolomics signatures with complex biological processes such as aging and diseases such as Alzheimer’s disease, cardiovascular disease and metabolic disorders [8–11]. So, a potential strength of plasma metabolomic analysis is that this approach can provides a composite metabolomic snapshot of both the tumor and the host.
Since breast cancer displays a high heterogeneity from histology to prognosis, metastatic evolution and treatment responses, and in view of the need for more refined diagnosis estimation in breast cancer, we designed this study to explore whether metabolomics can add diagnosis information in individuals with breast cancer. We assessed plasma metabolomic profiles in newly diagnosed breast cancer patients using a liquid chromatography-mass spectrometry (LC-ESI-QTOF MS/MS) platform-based metabolomics approach, with the hypothesis that in breast cancer a metabolomics signature of cancer exists and can be detected in patient plasma irrespectively of the breast cancer type.
RESULTS
Metabolomics profiling in plasma by LC-ESI-QTOF MS/MS in breast cancer and healthy groups
The first aim of this work was to analyze global metabolomic differences between breast cancer and healthy samples. To do this, we applied a non-targeted metabolomics approach focusing on the profiles of low molecular weight (m/z < 1500) ionizable molecules which were present in at least 50% of the samples of each group (2356). To determine whether the metabolite fingerprints in fasting plasma differed between breast cancer and healthy control subjects in our metabolomics approach, we first evaluated separation between experimental groups using unsupervised principal component analyses (PCA) (Figure 1A). Strong group separation was achieved in plasma between all two groups, suggesting the existence of a specific metabolomic signature for each condition. Further analysis using partial least square discriminant analysis (PLS-DA) models demonstrated robust group separation between both groups (Figure 1B) obtaining good cross validation results (Max components= 5; C-V method= 10-fold CV; Performance measure= Q2) (Supplementary Table 1).
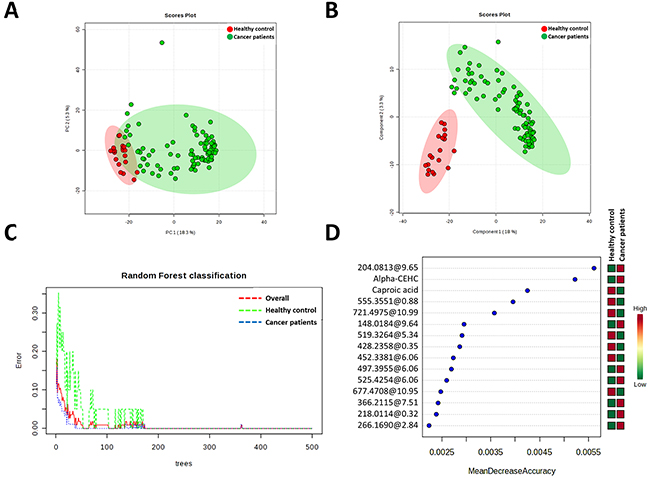
Figure 1: Multivariate analyses reveals specific metabolomic signature of cancer patients plasma samples. A. Principal Component Analyses revealed a good clusteritzation of samples from cancer group. B. Partial Least Discriminating analysis define a perfect metabolic signature for both groups. C. Random Forest classification shows and overall classification error of 0 (0 for healthy and cancer patient groups). D. Metabolites which much contribute to Random Forest classification. Unknown identities are represented as exact mass@retention time.
Multivariate classification analyses were comple-mented applying Random Forest (RF) analyses, a supervised class prediction model, in order to a) determine the capacity for global metabolomes to accurately classify patients into their respective groups and b) to identify metabolites most important to the class prediction and hence which possessed the strongest correlation to the respective disease. In the RF supervised class prediction analysis comparing breast cancer and healthy control groups, RF accurately classified 100% both samples of the breast cancer patients and healthy controls (Figure 1C). So, the class error for both group in and the out-of-bag error were 0. The metabolites which major contribute to classification were shown in Figure 1D.
Altered metabolites and canonical pathways in plasma of breast cancer patients and healthy control subjects
After multivariate statistics analyses we applied a Student’s T Test (p<0.05, Benjamini-Hochberg False Discovery Rate) to define which metabolites were statistically altered in breast cancer patients. We found 1269 metabolites with different concentration in plasma from healthy controls and cancer patients (Supplementary DataSet). Basing on exact mass, retention time and isotopic distribution we could identify 35 metabolites (Table 1) belonging to aminoacyl-tRNA biosynthesis, arginine and proline metabolism and primary bile acid biosynthesis pathways (Table 2), among others.
Table 1: Metabolites statistically significant (p<0.05, Benjamini-Hoghberg False Discovery Rate) with a potential identity
Compound |
p (Corr) |
Regulation (cancer patients vs healthy control) |
FC |
Mass |
Retention Time |
|---|---|---|---|---|---|
2-Hydroxy-3-methylbutyric acid |
3.3E-04 |
up |
36.6 |
100.0522 |
1.5816069 |
2-Hydroxy-3-methylpentanoic acid |
2.3E-02 |
up |
3.3 |
114.0682 |
3.2419913 |
2-Methylhippuric acid |
1.8E-03 |
down |
-92.0 |
175.0639 |
3.6565607 |
2-Octenoic acid |
5.3E-03 |
down |
-39.3 |
372.268 |
9.767441 |
3-Hydroxyanthranilic acid |
8.8E-06 |
down |
-341.8 |
135.0336 |
1.5612222 |
3-Methylglutaric acid |
5.5E-03 |
up |
37.6 |
128.0489 |
1.5807501 |
4-acetamidobutanoate |
2.0E-03 |
down |
-53.3 |
127.064 |
0.70647365 |
5-b-Cholestane-3a, 7a, 12a-triol |
3.6E-02 |
down |
-13.2 |
402.3519 |
12.439621 |
5α-androstane-3,17-dione |
1.2E-10 |
down |
-148.8 |
305.2386 |
10.385417 |
7-ketocholesterol |
4.3E-04 |
up |
117.0 |
400.3335 |
12.138314 |
7α-hydroxy-cholesterol |
8.9E-03 |
down |
-31.4 |
384.329 |
12.368574 |
Caproic acid |
8.4E-17 |
down |
-1.7 |
348.2573 |
5.769 |
Chenodeoxycholic Acid |
6.1E-04 |
up |
161.8 |
392.2908 |
11.337122 |
Cortisol |
3.1E-05 |
down |
-1.7 |
362.2124 |
7.031 |
Cortisone |
3.0E-02 |
down |
-5.8 |
360.1945 |
6.9761095 |
Creatine |
3.9E-04 |
down |
-339.6 |
113.0561 |
0.42863637 |
Cytidine |
3.5E-02 |
up |
21.9 |
225.0778 |
0.7119473 |
DL-pipecolic acid |
1.5E-06 |
up |
270.4 |
129.0792 |
0.33790255 |
Dopamine |
7.8E-04 |
up |
1.5 |
135.0675 |
0.575 |
Glutamine |
2.0E-06 |
down |
-1060.4 |
146.0684 |
0.5461304 |
Hippuric acid |
3.8E-02 |
down |
-8.8 |
179.0599 |
2.1277783 |
Homocystine |
2.9E-04 |
up |
62.3 |
306.0068 |
0.33542165 |
Inosine diphosphate (IDP) |
1.8E-03 |
up |
52.7 |
410.0028 |
0.34574685 |
L-Arginine |
1.5E-05 |
down |
-397.2 |
174.1067 |
0.4356315 |
Linoleic acid |
4.1E-17 |
up |
42496.8 |
280.2411 |
11.370296 |
L-Lysine |
1.7E-04 |
down |
-61.4 |
146.1059 |
0.34584 |
L-Valine |
1.7E-02 |
down |
-64.5 |
117.0775 |
0.44549397 |
Myristic acid |
2.7E-04 |
up |
78.9 |
250.1932 |
12.096725 |
N-Oleoyl-D-erythro-Sphingosine (C18:1 Ceramide) |
7.2E-07 |
down |
-645.7 |
571.51 |
13.315624 |
Oleamide |
3.8E-05 |
up |
2.0 |
281.2726 |
11.383955 |
Retinoic acid |
1.3E-08 |
down |
-128.9 |
863.6179 |
11.356807 |
Stearic acid |
2.0E-06 |
up |
673.6 |
284.2717 |
12.056651 |
Taurine |
6.4E-09 |
up |
198.1 |
125.0153 |
0.32860422 |
Threonate |
3.9E-02 |
up |
3.9 |
136.0378 |
0.88052344 |
Uric acid |
2.8E-02 |
up |
2.3 |
168.0292 |
0.6809543 |
Table 2: Pathways modulated by breast cancer condition
Pathway name |
Total |
Expected |
Hits |
p |
|---|---|---|---|---|
Aminoacyl-tRNA biosynthesis |
75 |
0.87246 |
4 |
0.010095 |
Arginine and proline metabolism |
77 |
0.89572 |
4 |
0.011061 |
Primary bile acid biosynthesis |
47 |
0.54674 |
3 |
0.01624 |
Nitrogen metabolism |
39 |
0.45368 |
2 |
0.074242 |
Purine metabolism |
92 |
1.0702 |
3 |
0.088937 |
D-Arginine and D-ornithine metabolism |
8 |
0.093062 |
1 |
0.089485 |
Lysine degradation |
47 |
0.54674 |
2 |
0.10237 |
Fatty acid biosynthesis |
49 |
0.57 |
2 |
0.10982 |
Biotin metabolism |
11 |
0.12796 |
1 |
0.12101 |
D-Glutamine and D-glutamate metabolism |
11 |
0.12796 |
1 |
0.12101 |
Pyrimidine metabolism |
60 |
0.69796 |
2 |
0.15306 |
Linoleic acid metabolism |
15 |
0.17449 |
1 |
0.16141 |
Taurine and hypotaurine metabolism |
20 |
0.23265 |
1 |
0.20939 |
Retinol metabolism |
22 |
0.25592 |
1 |
0.22783 |
Alanine, aspartate and glutamate metabolism |
24 |
0.27919 |
1 |
0.24586 |
Pantothenate and CoA biosynthesis |
27 |
0.31408 |
1 |
0.27215 |
Valine, leucine and isoleucine biosynthesis |
27 |
0.31408 |
1 |
0.27215 |
Lysine biosynthesis |
32 |
0.37225 |
1 |
0.314 |
Steroid hormone biosynthesis |
99 |
1.1516 |
2 |
0.32119 |
Propanoate metabolism |
35 |
0.40715 |
1 |
0.33799 |
Valine, leucine and isoleucine degradation |
40 |
0.46531 |
1 |
0.37618 |
Ascorbate and aldarate metabolism |
45 |
0.52347 |
1 |
0.41224 |
Phenylalanine metabolism |
45 |
0.52347 |
1 |
0.41224 |
Fructose and mannose metabolism |
48 |
0.55837 |
1 |
0.43291 |
Glycine, serine and threonine metabolism |
48 |
0.55837 |
1 |
0.43291 |
Cysteine and methionine metabolism |
56 |
0.65143 |
1 |
0.48465 |
Tyrosine metabolism |
76 |
0.88409 |
1 |
0.59485 |
Tryptophan metabolism |
79 |
0.91899 |
1 |
0.60928 |
To further analyze whether these molecules could define the metabolic status of cancer patients we performed a multivariate statistics using only these molecules which present a statistically significant difference between groups and have a potential identity (based on exact mass, retention time and isotopic distribution) (Figure 2). First of all, we applied hierarchical analyses were we could see relative concentration of each metabolite (Figure 2A). This analysis also shows a good clusteritzation of samples from cancer patients. In the same line, both PCA and PLS-DA analyses showed that, although the separation is better using all molecules detected, we could define a signature using only 35 metabolites (Figure 2B and 2C). Both permutation test (Supplementary Figure 2) and cross-validation results (Max components= 5; C-V method= 10-fold CV; Performance measure= Q2) (Supplementary Table 2) validate PLS-DA model. Finally, in order to control overfitting we used an alternative technique for multivariate analyses, the RF analyses obtaining an out-of-bag error of 0.027 (Supplementary Figure 2). Overall, these results supports an specific metabolomic signature using only 35 molecules.
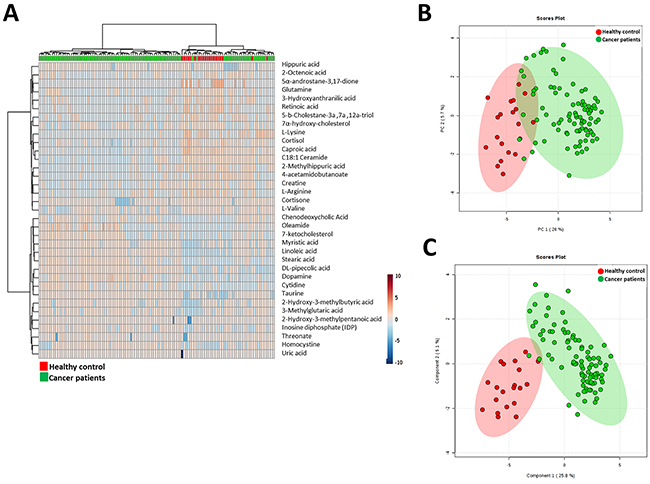
Figure 2: A. Hierarchical clustering analyses using the statistical significant metabolites which has a potential identity (based on exact mass, retention time and isotopic distribution. B. Principal Component Analyses performed with the statistical significant metabolites which has a potential identity (based on exact mass, retention time and isotopic distribution. C. Partial Least Square Discriminant Analysis performed with the statistical significant metabolites which has a potential identity (based on exact mass, retention time and isotopic distribution.
Receiver operator characteristic (ROC) curve analysis
The collective results of RF, significance testing, and false discovery rate analysis identified several metabolites that were strongly associated with breast cancer. To further characterize the predictive value of these metabolites to discriminate breast cancer, we performed ROC analysis using MS peak areas (Table 3). We found 3 metabolites (metabolite 1: [email protected] (p=3.2109E-18), metabolite 2: [email protected] (p=2.6216E-14), metabolite 3: [email protected] (p=5.7445E-38)) with an area under the curve (AUC) = 1, a specificity= 1 and a sensibility = 1. Among the metabolites with a putative identity we found with highest significant the caproic acid (AUC = 0.995, specificity= 1 and a sensibility = 1), the taurine (AUC = 0.952, specificity= 0.9 and a sensibility = 1), staramide (AUC = 0.959, specificity= 0.9 and a sensibility = 0.9) and the linoleic acid (AUC = 0.935, specificity= 0.9 and a sensibility = 1) (Figure 3).
Table 3: Receiver operator characteristic (ROC) analysis of metabolites significantly associated with the presence of breast cancer
Metabolite |
Accurate mass@ retention time |
Sensitivity |
Specificity |
AUC |
p |
Fold difference in breast cancer vs. healthy controls |
|---|---|---|---|---|---|---|
C26H43ClN4S3 |
100 |
100 |
1.00 |
3.21e-18 |
0.98 |
|
C26H51N5O4 |
100 |
100 |
1.00 |
2.62e-14 |
1.32 |
|
C9H16O3S |
100 |
100 |
1.00 |
5.74e-38 |
1.08 |
|
C23H30N2S |
100 |
100 |
0.999 |
4.76e-17 |
2.08 |
|
100 |
100 |
0.999 |
6.15e-36 |
1.06 |
||
Caproic acid |
100 |
100 |
0.995 |
4.12e-23 |
0.99 |
|
Taurine |
100 |
90 |
0.952 |
3.048e-14 |
0.66 |
|
Stearamide |
90 |
90 |
0.959 |
2.3782e-12 |
0.85 |
|
Linoleic Acid |
100 |
90 |
0.935 |
8.7246e-8 |
6.29 |
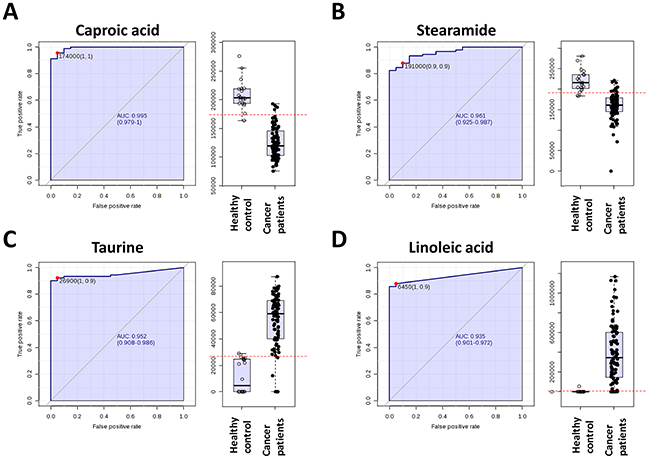
Figure 3: Receiver operating characteristic curve of caproic acid, stearamide, taurine and linoleic acid.
DISCUSSION
Breast cancer has been associated with marked metabolic shifts [2] [12–19] [20–34]. Since now, metabolomics has been mainly used to refine molecular subtyping of breast cancer, cancer progression, cancer metastasis, and prediction of treatment sensitivity. Only a few metabolomics breast cancer studies have been conducted in plasma/serum mostly focused to discriminate breast cancer subtypes [35], metastatic breast cancer [36–41], recurrence [42, 43] and response to neoadjuvant chemotherapy [44].
The present study demonstrate for the first time that a metabolic signature of breast cancer exists and can be detected in patient plasma. Thus, we found 1269 metabolites with different concentration in plasma from healthy controls and cancer patients. Among them, 354 could be identified (based on exact mass, retention time and isotopic distribution) and different functions could be attributed. Specifically, some of the metabolites could be involved in cell growth by providing building stones for the synthesis of essential cellular components, and substrates for bioenergetics. So, the lower plasma concentrations of the amino acids valine, arginine, tryptophan and lysine in breast cancer patients could express the higher uptake of these amino acids by the tumor, but also a preferential utilization of them. In addition, the elevated content in taurine and homocysteine is also suggestive of increased utilization of the amino acid methionine, essential for the synthesis of methyl group donor compounds, the amino acid cysteine, and the antioxidant glutathione [45]. In this line, the higher content of linoleic acid and stearic acid, as well as cytidine (also used for phosphatidylcholine and phosphatidylethanolamine biosynthesis) [46], suggest a higher rate of structural lipids biosynthesis. Furthermore, the higher plasma concentration of cytidine (pyrimidine nucleoside), inosine diphosphate (purine nucleoside) and uric acid suggest increased need of substrates for nucleic acid biosynthesis by the tumor. In parallel, the elevated content in short- and medium-chain fatty acids (caproic acid, and myristic acid), the lower content in glutamine and creatine, and higher content of taurine, suggest increased bioenergetics of tumor cells.
In this context it is also particularly interesting the detection of increased levels in breast cancer patients of three metabolites belonging to the branched chain amino acid (BCAA) metabolism (2-hydroxy-3-methylbutiric acid, 2-hydroxy-3-methylpentanoic acid, and 3-methylglutaric acid) suggesting that BCAA are preferentially used by breast cancer cells likely to provide carbon for gluconeogenesis. Because i) BCAAs have a central role in the maintenance of lean body mass and regulation of skeletal muscle protein metabolism [47] and ii) cancer cachexia is characterized by increased oxidation of BCAAs, and net catabolism of skeletal muscle through a reduction in protein synthesis and activation of proteolysis, it is postulated that breast cancer activates metabolic pathways which induce cachexia.
Other metabolites which show antioxidant activity (taurine and uric acid) were increased in plasma from cancer subjects could be involved in protecting cancer cells from excessive damage by oxidative stress. Reinforcing this fact, a lower concentration of the oxidative stress-derived compounds 7alpha-hydroxy-cholesterol and 3-hydroxyanthranilic acid (oxidation product of tryptophan) were detected in the breast cancer group.
Finally, among differential metabolites endogenous signaling lipids were found. Thus, we detected a decreased content of retinoic acid, C18:1 ceramide and two N-acyl amino acids (2-methylhippuric acid and hippuric acid), while the endocannabinoid oleamide is increased in breast cancer group. Globally, all these changes seem to be designed to enhance cell proliferation and tumor cell survival.
In summary, the changes described in the metabolomic profile in breast cancer patients may affect disease biology in different ways. Specifically, these metabolites may promote tumorigenesis by changing the differentiation status of tumors, induce metastatic phenotype, or make tumors more viable in oxidative stress conditions. But in any case, metabolomics studies in human plasma from breast cancer patients could be useful to describe diagnostic and/or prognosis biomarkers, as well as for monitoring treatment.
MATERIALS AND METHODS
Participants and ethics
A total of 91 breast cancer patients and 20 healthy control subjects were recruited at the Breast Cancer Medicine Service at Hospital of Jaén (Jaén, Spain). The study was approved by the institutional review board of the Clinical Research Ethics Committee of the Hospital of Jaén, and every patient provided written informed consent for participation. The criteria for selection included: at last 18 years old with histological confirmation of breast cancer; no detectable macrometastatic disease, and no prior anticancer treatment. Demographic characteristics and clinical diagnosis of studied subjects are summarized in Table 4. In order to avoid the effect of potential cofounders (such as age, BMI, menopause, diabetes, cholesterol and drug treatment) in metabolomics analyses the homogeneity of both groups was checked. We applied Student T-test for continuous variables (age, BM and cholesterol) and Fisher’s exact Test for two way categorical data (menopause, diabetes and drug treatment). Among cofounders analyzed only BMI presents statistically significance (p=0.0057) between groups. To further analyze the effect of BMI in plasma metabolomics profile we performed multivariate statistics which showed that BMI, contrary to pathology, did not have any effect in determining plasma metabolomic profile (Supplementary Figure 1). Further, one-way ANOVA on BMI (Normal Weight (BMI: 18.5-24.9); Overweight (BMI: 25-29.9); Obese (BMI>30)) showed no statistically significant metabolites between groups.
Table 4: Demographic and clinical pathological characteristics of study population
Breast cancer patients |
Healthy control subjects |
|
|---|---|---|
Biospecimen |
Plasma |
Plasma |
Number of participants |
91 |
20 |
Age (median, range) |
62 (34-91) |
48 (22-64) |
TNM stage-I |
2 (2.1%) |
n.a. |
TNM stage-IIa |
40 (43.4%) |
n.a. |
TNM stage-IIb |
30 (32.6%) |
|
TNM stage-IIIa |
13 (14.1%) |
n.a. |
TNM stage-IIIb |
7 (7.6%) |
|
TNM stage-IV |
0 |
n.a. |
Luminal A |
25 (27.1%) |
n.a. |
Luminal B |
38 (41.3%) |
n.a. |
HER-2 |
25 (27.1) |
n.a. |
Triple Negative |
12 (13.0%) |
n.a. |
Abbreviations: n.a., not applicable.
Samples were collected in EDTA tubes at 08:00 hours in the morning after at least 8h of fasting using standard venipuncture procedures. Blood was processed by centrifugation within 2 h of collection using a gradient of histopaque in order to separate plasma, erythrocytes and PBMC. Plasma samples were isolated, aliquoted and stored at -80°C until further use.
Sample processing
Metabolites from plasma were extracted as previously described [9]. Samples were thawed on ice at 4ºC, and 300 µl of cold methanol (containing 1 µM of hutylhydroxytoluene as antioxidant and 1 µg/ml of 13C-phenylalanine as internal standard) were added to 100 µl of plasma for deproteinization, followed by incubation at -20ºC for 1h and then, centrifuged at 12000g for 3 min. The supernatants were recovered, evaporated using a Speed Vac (Thermo Fisher Scientific, Barcelona, Spain) and re-suspended in water 0.4% acetic acid/methanol (50/50).
Metabolomic analyses
For the metabolomic study, an Agilent 1290 LC system coupled to an ESI-Q-TOF MS/MS 6520 instrument (Agilent Technologies) was used. In all cases, 2 µL of extracted sample was applied onto a reversed-phase column (Zorbax SB-Aq 1.8 µm 2.1 x 50 mm; Agilent Technologies) equipped with a precolumn (Zorba-SB-C8 Rapid Resolution Cartridge 2.1 x 30 mm 3.5 µm; Agilent Technologies) with a column temperature of 60°C. The flow rate was 0.6 mL/min. Solvent A was composed of water containing 0.2% acetic acid and solvent B was composed of methanol 0.2% acetic acid. The gradient started at 2% B and increased to 98% B in 13 min and held at 98% B for 6 min. Post-time was established in 5 min.
Data were collected in positive electrospray mode time of flight operated in full-scan mode at 100–3000 m/z in an extended dynamic range (2 GHz), using N2 as the nebulizer gas (5 L/min, 350°C). The capillary voltage was 3500 V with a scan rate of 1 scan/s. The ESI source used a separate nebulizer for the continuous, low-level (10 L/min) introduction of reference mass compounds: 121.050873, 922.009798 (positive ion mode) and 119.036320, 966.000725 (negative ion mode), which were used for continuous, online mass calibration. MassHunter Data Analysis Software (Agilent Technologies, Barcelona, Spain) was used to collect the results, and MassHunter Qualitative Analysis Software (Agilent Technologies, Barcelona, Spain) to obtain the molecular features of the samples, representing different, co-migrating ionic species of a given molecular entity using the Molecular Feature Extractor algorithm (Agilent Technologies, Barcelona, Spain), as described [9, 48]. Finally, MassHunter Mass Profiler Professional Software (Agilent Technologies, Barcelona, Spain) and Metaboanalyst platform [49] were used to perform a non-targeted metabolomic analysis of the extracted features. We selected samples with a minimum of 2 ions. Multiple charge states were not considered. Compounds from different samples were aligned using a retention time window of 0.1% ± 0.25 minutes and a mass window of 10.0 ppm ±2.0 mDa. Only common features (found in at least 50% of the samples of any group) were analyzed, correcting for individual bias. PCA, PLS-DA, RF analyses, Hierarchical analyses and ROC curves were done using Metboanalyst platform [49]. Then, we applied univariate statistics (Student’s T test, p<0.05, Benjamini-Hochberg false discovery rate) evaluate significant differences induced by carcinogenic process. The resulting differential metabolites were searched against PCDL database from Agilent (Agilent Technologies, Barcelona, Spain), which uses retention times in a standardized chromatographic system as an orthogonal searchable parameter to complement accurate mass data (accurate mass retention time approach) according to previously published works [48]. Pathway analysis was performed using Metaboanalyst platform [49].
Abbreviations
AUC, area under the curve; BCAA, branched chain amino acids; MS, mass spectrometry; RF, random forest; ROC, receiver operating curves; PCA, principal component analyses; PLS-DA, partial least square discriminant analysis
CONFLICTs OF INTEREST
The authors declare that they have no competing interests.
FUNDING
This research was funded by the Spanish Ministry of Economy and Competitiveness, Institute Carlos III (FIS grant PI14/00328), and the Autonomous Government of Catalonia (2014SGR168) to R.P. This study has been co-financed by FEDER funds from the European Union (‘Una manera de hacer Europa’).
Author contributions
P.S.R. and R.P. designed the experiments. M.J., and R.P. analyzed the data. M.J., R.C., J.L.Q., M.C.R, J.S., A.J., M.F., C.T., and C.R. performed the experiments. R.P. supervised the design and data interpretation. The manuscript was written by M.J., R.C., P.S.R. and R.P. and edited by R.P. All authors discussed the results and commented on the manuscript.
REFERENCES
1. Hirschey MD, DeBerardinis RJ, Diehl AME, Drew JE, Frezza C, Green MF, Jones LW, Ko YH, Le A, Lea MA, Locasale JW, Longo VD, Lyssiotis CA, et al. Dysregulated metabolism contributes to oncogenesis. Semin Cancer Biol. 2015; 35: S129–50. doi: 10.1016/j.semcancer.2015.10.002.
2. Mishra P, Ambs S. Metabolic Signatures of Human Breast Cancer. Mol Cell Oncol. 2015; 2. doi: 10.4161/23723556.2014.992217.
3. Torre LA, Bray F, Siegel RL, Ferlay J, Lortet-Tieulent J, Jemal A. Global cancer statistics, 2012. CA Cancer J Clin. 2015; 65: 87–108. doi: 10.3322/caac.21262.
4. Siegel R, Naishadham D, Jemal A. Cancer statistics, 2012. CA Cancer J Clin. 2012; 62: 10–29. doi: 10.3322/caac.20138.
5. Griffin JL, Shockcor JP. Metabolic profiles of cancer cells. Nat Rev Cancer. 2004; 4: 551–61. doi: 10.1038/nrc1390.
6. Nicholson JK. Global systems biology, personalized medicine and molecular epidemiology. Mol Syst Biol. 2006; 2: 52. doi: 10.1038/msb4100095.
7. Wishart DS, Knox C, Guo AC, Eisner R, Young N, Gautam B, Hau DD, Psychogios N, Dong E, Bouatra S, Mandal R, Sinelnikov I, Xia J, et al. HMDB: a knowledgebase for the human metabolome. Nucleic Acids Res. 2009; 37: D603–10. doi: 10.1093/nar/gkn810.
8. Ansoleaga B, Jové M, Schlüter A, Garcia-Esparcia P, Moreno J, Pujol A, Pamplona R, Portero-Otín M, Ferrer I. Deregulation of purine metabolism in Alzheimer’s disease. Neurobiol Aging. 2015; 36: 68–80. doi: 10.1016/j.neurobiolaging.2014.08.004.
9. Jové M, Mauri-Capdevila G, Suárez I, Cambray S, Sanahuja J, Quílez A, Farré J, Benabdelhak I, Pamplona R, Portero-Otín M, Purroy F. Metabolomics predicts stroke recurrence after transient ischemic attack. Neurology. 2015; 84: 36–45. doi: 10.1212/WNL.0000000000001093.
10. Jové M, Naudí A, Portero-Otin M, Cabré R, Rovira-Llopis S, Bañuls C, Rocha M, Hernández-Mijares A, Victor VM, Pamplona R. Plasma lipidomics discloses metabolic syndrome with a specific HDL phenotype. FASEB J. 2014; 28: 5163–71. doi: 10.1096/fj.14-253187.
11. Jové M, Portero-Otín M, Naudí A, Ferrer I, Pamplona R. Metabolomics of human brain aging and age-related neurodegenerative diseases. J Neuropathol Exp Neurol. 2014; 73: 640–57. doi: 10.1097/NEN.0000000000000091.
12. Aboagye EO, Bhujwalla ZM. Malignant transformation alters membrane choline phospholipid metabolism of human mammary epithelial cells. Cancer Res. 1999; 59: 80–4.
13. Katz-Brull R, Seger D, Rivenson-Segal D, Rushkin E, Degani H. Metabolic markers of breast cancer: enhanced choline metabolism and reduced choline-ether-phospholipid synthesis. Cancer Res. 2002; 62: 1966–70.
14. Kennedy KM, Scarbrough PM, Ribeiro A, Richardson R, Yuan H, Sonveaux P, Landon CD, Chi J-T, Pizzo S, Schroeder T, Dewhirst MW. Catabolism of exogenous lactate reveals it as a legitimate metabolic substrate in breast cancer. PLoS One. 2013; 8: e75154. doi: 10.1371/journal.pone.0075154.
15. Locasale JW, Grassian AR, Melman T, Lyssiotis CA, Mattaini KR, Bass AJ, Heffron G, Metallo CM, Muranen T, Sharfi H, Sasaki AT, Anastasiou D, Mullarky E, et al. Phosphoglycerate dehydrogenase diverts glycolytic flux and contributes to oncogenesis. Nat Genet. 2011; 43: 869–74. doi: 10.1038/ng.890.
16. Shaw PG, Chaerkady R, Wang T, Vasilatos S, Huang Y, Van Houten B, Pandey A, Davidson NE. Integrated proteomic and metabolic analysis of breast cancer progression. PLoS One. 2013; 8: e76220. doi: 10.1371/journal.pone.0076220.
17. Simpson NE, Tryndyak VP, Beland FA, Pogribny IP. An in vitro investigation of metabolically sensitive biomarkers in breast cancer progression. Breast Cancer Res Treat. 2012; 133: 959–68. doi: 10.1007/s10549-011-1871-x.
18. Singer S, Souza K, Thilly WG. Pyruvate utilization, phosphocholine and adenosine triphosphate (ATP) are markers of human breast tumor progression: a 31P- and 13C-nuclear magnetic resonance (NMR) spectroscopy study. Cancer Res. 1995; 55: 5140–5.
19. Weljie AM, Bondareva A, Zang P, Jirik FR. (1)H NMR metabolomics identification of markers of hypoxia-induced metabolic shifts in a breast cancer model system. J Biomol NMR. 2011; 49: 185–93. doi: 10.1007/s10858-011-9486-4.
20. Balluff B, Frese CK, Maier SK, Schöne C, Kuster B, Schmitt M, Aubele M, Höfler H, Deelder AM, Heck A, Hogendoorn PCW, Morreau J, Maarten Altelaar AF, et al. De novo discovery of phenotypic intratumour heterogeneity using imaging mass spectrometry. J Pathol. 2015; 235: 3–13. doi: 10.1002/path.4436.
21. Borgan E, Sitter B, Lingjærde OC, Johnsen H, Lundgren S, Bathen TF, Sørlie T, Børresen-Dale A-L, Gribbestad IS. Merging transcriptomics and metabolomics--advances in breast cancer profiling. BMC Cancer. 2010; 10: 628. doi: 10.1186/1471-2407-10-628.
22. Brockmöller SF, Bucher E, Müller BM, Budczies J, Hilvo M, Griffin JL, Orešič M, Kallioniemi O, Iljin K, Loibl S, Darb-Esfahani S, Sinn B V, Klauschen F, et al. Integration of metabolomics and expression of glycerol-3-phosphate acyltransferase (GPAM) in breast cancer-link to patient survival, hormone receptor status, and metabolic profiling. J Proteome Res. 2012; 11: 850–60. doi: 10.1021/pr200685r.
23. Budczies J, Denkert C, Müller BM, Brockmöller SF, Klauschen F, Györffy B, Dietel M, Richter-Ehrenstein C, Marten U, Salek RM, Griffin JL, Hilvo M, Orešič M, et al. Remodeling of central metabolism in invasive breast cancer compared to normal breast tissue - a GC-TOFMS based metabolomics study. BMC Genomics. 2012; 13: 334. doi: 10.1186/1471-2164-13-334.
24. Budczies J, Brockmöller SF, Müller BM, Barupal DK, Richter-Ehrenstein C, Kleine-Tebbe A, Griffin JL, Orešič M, Dietel M, Denkert C, Fiehn O. Comparative metabolomics of estrogen receptor positive and estrogen receptor negative breast cancer: alterations in glutamine and beta-alanine metabolism. J Proteomics. 2013; 94: 279–88. doi: 10.1016/j.jprot.2013.10.002.
25. Budczies J, Pfitzner BM, Györffy B, Winzer K-J, Radke C, Dietel M, Fiehn O, Denkert C. Glutamate enrichment as new diagnostic opportunity in breast cancer. Int J cancer. 2015; 136: 1619–28. doi: 10.1002/ijc.29152.
26. Cao MD, Lamichhane S, Lundgren S, Bofin A, Fjøsne H, Giskeødegård GF, Bathen TF, Kaplan H, Malmgren J, Hirshfield K, Ganesan S, Xu H, Eirew P, et al. Metabolic characterization of triple negative breast cancer. BMC Cancer. 2014; 14: 941. doi: 10.1186/1471-2407-14-941.
27. Grinde MT, Skrbo N, Moestue SA, Rødland EA, Borgan E, Kristian A, Sitter B, Bathen TF, Børresen-Dale A-L, Mælandsmo GM, Engebraaten O, Sørlie T, Marangoni E, et al. Interplay of choline metabolites and genes in patient-derived breast cancer xenografts. Breast Cancer Res. BioMed Central; 2014; 16: R5. doi: 10.1186/bcr3597.
28. Hines KM, Ballard BR, Marshall DR, McLean JA. Structural mass spectrometry of tissue extracts to distinguish cancerous and non-cancerous breast diseases. Mol Biosyst. 2014; 10: 2827–37. doi: 10.1039/c4mb00250d.
29. Kanaan YM, Sampey BP, Beyene D, Esnakula AK, Naab TJ, Ricks-Santi LJ, Dasi S, Day A, Blackman KW, Frederick W, Copeland RL, Gabrielson E, Dewitty RL. Metabolic profile of triple-negative breast cancer in African-American women reveals potential biomarkers of aggressive disease. Cancer Genomics Proteomics. 2014; 11: 279–94.
30. Li M, Song Y, Cho N, Chang JM, Koo HR, Yi A, Kim H, Park S, Moon WK. An HR-MAS MR Metabolomics Study on Breast Tissues Obtained with Core Needle Biopsy. Monleon D, editor. PLoS One. 2011; 6: e25563. doi: 10.1371/journal.pone.0025563.
31. Mackinnon WB, Barry PA, Malycha PL, Gillett DJ, Russell P, Lean CL, Doran ST, Barraclough BH, Bilous M, Mountford CE. Fine-needle biopsy specimens of benign breast lesions distinguished from invasive cancer ex vivo with proton MR spectroscopy. Radiology. 1997; 204: 661–6. doi: 10.1148/radiology.204.3.9280241.
32. Mimmi MC, Finato N, Pizzolato G, Beltrami CA, Fogolari F, Corazza A, Esposito G. Absolute quantification of choline-related biomarkers in breast cancer biopsies by liquid chromatography electrospray ionization mass spectrometry. Anal Cell Pathol (Amst). 2013; 36: 71–83. doi: 10.3233/ACP-130082.
33. Mountford CE, Somorjai RL, Malycha P, Gluch L, Lean C, Russell P, Barraclough B, Gillett D, Himmelreich U, Dolenko B, Nikulin AE, Smith IC. Diagnosis and prognosis of breast cancer by magnetic resonance spectroscopy of fine-needle aspirates analysed using a statistical classification strategy. Br J Surg. 2001; 88: 1234–40. doi: 10.1046/j.0007-1323.2001.01864.x.
34. Tang X, Lin CC, Spasojevic I, Iversen ES, Chi JT, Marks JR. A joint analysis of metabolomics and genetics of breast cancer. Breast Cancer Res. 2014; 16: 415. doi: 10.1186/s13058-014-0415-9.
35. Fan Y, Zhou X, Xia TS, Chen Z, Li J, Liu Q, Alolga RN, Chen Y, Lai M De, Li P, Zhu W, Qi LW. Human plasma metabolomics for identifying differential metabolites and predicting molecular subtypes of breast cancer. Oncotarget. 2016; 7: 9925–38. doi: 10.18632/oncotarget.7155.
36. Cui M, Wang Q, Chen G. Serum metabolomics analysis reveals changes in signaling lipids in breast cancer patients. Biomed Chromatogr. 2016; 30: 42–7. doi: 10.1002/bmc.3556.
37. Gu H, Pan Z, Xi B, Asiago V, Musselman B, Raftery D. Principal component directed partial least squares analysis for combining nuclear magnetic resonance and mass spectrometry data in metabolomics: Application to the detection of breast cancer. Anal Chim Acta. 2011; 686: 57–63. doi: 10.1016/j.aca.2010.11.040.
38. Jobard E, Pontoizeau C, Blaise BJ, Bachelot T, Elena-Herrmann B, Trédan O. A serum nuclear magnetic resonance-based metabolomic signature of advanced metastatic human breast cancer. Cancer Lett. 2014; 343: 33–41. doi: 10.1016/j.canlet.2013.09.011.
39. Oakman C, Tenori L, Claudino WM, Cappadona S, Nepi S, Battaglia A, Bernini P, Zafarana E, Saccenti E, Fornier M, Morris PG, Biganzoli L, Luchinat C, et al. Identification of a serum-detectable metabolomic fingerprint potentially correlated with the presence of micrometastatic disease in early breast cancer patients at varying risks of disease relapse by traditional prognostic methods. Ann Oncol. 2011; 22: 1295–301. doi: 10.1093/annonc/mdq606.
40. Shen J, Yan L, Liu S, Ambrosone CB, Zhao H. Plasma metabolomic profiles in breast cancer patients and healthy controls: by race and tumor receptor subtypes. Transl Oncol. 2013; 6: 757–65.
41. Tenori L, Oakman C, Claudino WM, Bernini P, Cappadona S, Nepi S, Biganzoli L, Arbushites MC, Luchinat C, Bertini I, Di Leo A. Exploration of serum metabolomic profiles and outcomes in women with metastatic breast cancer: A pilot study. Mol Oncol. 2012; 6: 437–44. doi: 10.1016/j.molonc.2012.05.003.
42. Asiago VM, Alvarado LZ, Shanaiah N, Gowda GAN, Owusu-Sarfo K, Ballas RA, Raftery D. Early detection of recurrent breast cancer using metabolite profiling. Cancer Res. 2010; 70: 8309–18. doi: 10.1158/0008-5472.CAN-10-1319.
43. Tenori L, Oakman C, Morris PG, Gralka E, Turner N, Cappadona S, Fornier M, Hudis C, Norton L, Luchinat C, Di Leo A. Serum metabolomic profiles evaluated after surgery may identify patients with oestrogen receptor negative early breast cancer at increased risk of disease recurrence. Results from a retrospective study. Mol Oncol. 2015; 9: 128–39. doi: 10.1016/j.molonc.2014.07.012.
44. Wei S, Liu L, Zhang J, Bowers J, Gowda GAN, Seeger H, Fehm T, Neubauer HJ, Vogel U, Clare SE, Raftery D. Metabolomics approach for predicting response to neoadjuvant chemotherapy for breast cancer. Mol Oncol. 2013; 7: 297–307. doi: 10.1016/j.molonc.2012.10.003.
45. Stipanuk MH, Ueki I. Dealing with methionine/homocysteine sulfur: cysteine metabolism to taurine and inorganic sulfur. J Inherit Metab Dis. 2011; 34: 17–32. doi: 10.1007/s10545-009-9006-9.
46. Gibellini F, Smith TK. The Kennedy pathway--De novo synthesis of phosphatidylethanolamine and phosphatidylcholine. IUBMB Life. 2010; 62: 414-28. doi: 10.1002/iub.337.
47. Baracos VE, Mackenzie ML. Investigations of branched-chain amino acids and their metabolites in animal models of cancer. J Nutr. 2006; 136: 237S–42S.
48. Sana TR, Roark JC, Li X, Waddell K, Fischer SM. Molecular formula and METLIN Personal Metabolite Database matching applied to the identification of compounds generated by LC/TOF-MS. J Biomol Tech. 2008; 19: 258–66.
49. Xia J, Mandal R, Sinelnikov I V, Broadhurst D, Wishart DS. MetaboAnalyst 2.0--a comprehensive server for metabolomic data analysis. Nucleic Acids Res. 2012; 40: W127–33. doi: 10.1093/nar/gks374.