
INTRODUCTION
Colorectal cancer (CRC) is the second leading cause of cancer-related deaths in North America. In 2015, it was estimated that ~160,000 Americans and Canadians were newly diagnosed with CRC, with an additional ~60,000 individuals ultimately succumbing to the disease [1, 2]. Based on these statistics it is evident that new therapeutic strategies are urgently needed to minimize the morbidity and mortality rates associated with the disease. Synthetic lethality is one such strategy and is defined as a rare and lethal combination of two independently viable mutations [3]. In a CRC context, a synthetic lethal (SL) approach aims to exploit a pre-existing gene deletion or mutation (e.g. RAD54B) in a cancer cell by down regulating a SL interactor (i.e. drug target). Since SL approaches are designed to exploit the aberrant genetics driving tumorigenesis, they are expected to better restrict their therapeutic effects to cancer cells than traditional approaches. Thus, identifying SL interactors of genes somatically altered in CRC will identify candidate drug targets with the potential to exploit and target cancer using a precision medicine strategy.
Recent gene re-sequencing efforts have identified numerous somatic mutations and deletions in genes encoding functions within the DNA damage response (DDR) [4] that are ideal targets to exploit via a SL paradigm. Disruption of the DDR correlates with genome instability [5], which accelerates the acquisition of subsequent mutations and/or gene copy number changes, and is a hallmark of virtually all cancer types [6, 7]. For example, RAD54B is somatically mutated or deleted in numerous cancer types, including CRC (~3.3%) [8], breast (~3.4%) [9], lung (~2.6%) [10], which represents ~20,500 North Americans each year who are newly diagnosed with these three cancers alone [1, 2]. RAD54B encodes a protein that functions in DDR, specifically within the DNA double strand break (DSB) repair pathway. In particular, RAD54B functions in homologous recombination repair (HRR) [11–14], which is commonly referred to as an ‘error-free’ repair pathway [11]. RAD54B is a member of the SWI/SNF2 helicase superfamily, and hydrolyses ATP to remodel protein-duplex DNA complexes to enhance the accessibility of chromatin to repair factors [15, 16]. RAD54B is also proposed to be an accessory factor for RAD51, that assists in HRR specifically during strand invasion into the undamaged sister chromatid [13, 17, 18]. Beyond HRR, RAD54B is also a chromosome instability (CIN) gene, as diminished expression induces CIN, or aberrant chromosome numbers [19]. Collectively, these data suggest diminished RAD54B expression and/or function are pathogenic events in the development and progression of cancer [20]. Importantly, these data suggest RAD54B may harbor tumor suppressor-like properties [19] rendering it an attractive target to exploit via a SL approach.
Although the clinical applicability of SL approaches is still in its infancy, numerous research groups have begun to uncover SL interactors (i.e. drug targets) for a myriad of genes somatically altered in cancer [21–23]. In fact, three SL interactors for RAD54B have already been identified and include Flap Endonuclease-1 (FEN1) [19], Superoxide Dismutase 1 (SOD1) [24], and DNA Ligase IV (LIG4) [25]. Collectively, these SL interactions rely on the synergistic killing of RAD54B-deficient CRC cells following the silencing or inhibition of a SL interactor that functions within the DDR (e.g. FEN1, SOD1, LIG4). These observations suggest that additional members of the DDR family may also be SL with RAD54B, including poly (ADP-ribose) polymerase 1 (PARP1). In 2005, two seminal studies identified PARP as novel drug target and SL interactor of BRCA1 and BRCA2, which are commonly mutated in breast and ovarian cancers [19, 20]. Since then, subsequent studies have uncovered a number of additional SL interactions involving PARP1 [19, 24, 26]. In particular, two high-throughput screens demonstrated that PARP1 was SL with a large number of DDR genes including CDK12, DDB1, XAB2, however RAD54B was never identified [27, 28]. Due to the involvement of RAD54B within the DDR, we predicted PARP1 would also be SL with RAD54B.
In this study, we couple siRNA-based silencing and small molecule inhibitors with semi-quantitative imaging microscopy, real time cell analyses (RTCA), and biochemical assays, and show that RAD54B and PARP1 are SL. We show that RAD54B-deficient CRC cells are preferentially killed following PARP1 silencing and inhibition with BMN673 and Olaparib. More specifically, we demonstrate that BMN673 and Olaparib treatments induce increases in γ-H2AX (a surrogate marker for DNA DSBs) preferentially within RAD54B-deficient cells and induce cytotoxicity via apoptosis. To enhance the therapeutic effects observed following PARP inhibition, we explored combinatorial treatments involving BMN673 with either 5-fluorouracil (5-FU), an established non-specific chemotherapeutic, or, LCS-1, an inhibitor of SOD1, a previously established SL interactor of RAD54B [29]. Although the combination involving 5-FU showed little enhanced effect beyond simple additivity, the combination involving LCS-1 induced synergistic killing within RAD54B-deficient cells. Collectively, our data show that RAD54B and PARP1 are SL, and add RAD54B to the growing list of genes that can be therapeutically exploited with PARP inhibitors. Finally, our data also show that combinatorial approaches involving multiple SL targets can provide synergistic killing within CRC cells, and further suggest this combinatorial strategy may hold potential in other cancer contexts.
RESULTS
RAD54B and PARP1 are synthetic lethal interactors
Previous genetic studies have shown that a number of genes encoding functions within the DDR, particularly HRR, are SL with PARP1 [27, 30–34]. Since a large number of genetic studies show that members of the same biological pathway frequently share SL interactors [19, 24, 26], we postulated PARP1 would also be SL with RAD54B, as it also encodes functions within HRR [9, 35–37]. However, we first began by confirming RAD54B expression within the RAD54B-proficient (control) and RAD54B-deficient isogenic cell model (Figure 1A), and subsequently assessed four individual PARP1 siRNA duplexes to identify the two most efficient silencers, siPARP1-1 and siPARP1-2 (Figure 1B). Next, we queried whether PARP1 silencing induced preferential killing within the RAD54B-deficient cells relative to controls. The RAD54B isogenic model has been employed previously in similar siRNA-based SL studies [19, 24], and following silencing of a candidate interactor (e.g. PARP1) a decrease in the number of RAD54B-deficient cells relative to controls is suggestive of a SL interaction. Accordingly, cells were transfected with siRNAs, permitted to grow for ~3.5 days, whereupon cells were fixed, imaged and analyzed. Following silencing, the relative percentage of RAD54B-deficient cells remaining was significantly reduced relative to controls (Figure 1C). In fact, the siRNA-Pool and both individual siRNAs induced statistically significant decreases in RAD54B-deficient cells (Table S1), suggesting RAD54B and PARP1 are SL. Indeed, further scrutiny of the images revealed a subset of RAD54B-deficient cells exhibiting cytological hallmarks of cytotoxicity that are typical of apoptosis, including chromatin condensation and nuclear blebbing.
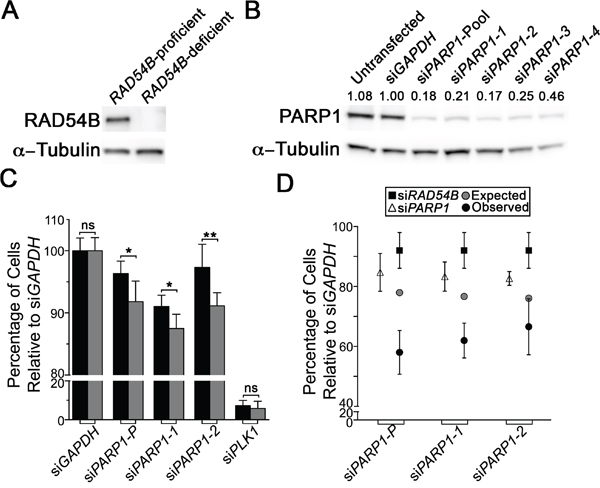
Figure 1: RAD54B and PARP1 are synthetic lethal interactors in HCT116 cells. A. Western blot confirming RAD54B expression levels within the RAD54B-proficient and RAD54B-deficient cells; α-Tubulin serves as the loading control. Experiment was repeated two additional times. B. Western blot depicting diminished PARP1 expression in RAD54B-proficient HCT116 cells following silencing with either individual (siPARP1-1, -2, -3 and -4) or pooled PARP1 (siPARP1-Pool) siRNAs or controls (Untransfected and siGAPDH); α-Tubulin serves as the loading control. Semi-quantitative analysis was performed and the normalized PARP1 expression levels relative to siGAPDH (1.00) are shown. Experiment was repeated twice. C. Bar graph depicting the mean normalized percentage of cells relative to siGAPDH (± SD) for RAD54B-proficient (black) and RAD54B-deficient (grey) cells following silencing with the indicated siRNAs (x-axis). Statistical significance is indicated (ns, not significant; *, P-value <0.05; **, P-value <0.01). Experiment was conducted in sextuplet and two additional times. D. Graphical depiction of the mean normalized percentage of cells relative to siGAPDH (± SD) for the individual silencing of either RAD54B (black squares) or PARP1 (white triangles), and the expected combined value (grey circles) calculated using a multiplicative model. Black circles identify the observed values following the simultaneous silencing of RAD54B and PARP1, and reveal enhanced/synergistic effects beyond the expected values. Experiment was conducted in sextuplet and repeated two additional times.
Although the above data imply RAD54B and PARP1 are SL, it remains possible that the interaction results from a de novo background mutation that arose while generating the RAD54B-deficient cells. Since HCT116 cells are MLH1-deficient (i.e. mis-match repair defective) and mutations can accrue, the possibility remained that an additional mutation became clonally fixed within the RAD54B-deficient cells that accounts for putative RAD54B PARP1 SL interaction. To alleviate this possibility, dual silencing experiments were performed in which both RAD54B and PARP1 were either individually or simultaneously silenced within the parental RAD54B-proficient (control) cells. However, we first confirmed our ability to silence RAD54B [24] (Figure S1). Next, single (siRAD54B or siPARP1) and dual (siRAD54B plus siPARP1) siRNA experiments were performed and as predicted, the simultaneous silencing of RAD54B and PARP1 induced a synergistic decrease in cell numbers compared to silencing either gene alone (Figure 1D), or that predicted using a multiplicative model (Table S2). Collectively, the above data show that RAD54B and PARP1 are SL within HCT116 cells, and further identify PARP1 as a candidate drug target in a RAD54B-deficient CRC context.
RAD54B-deficient HCT116 cells are hypersensitive to BMN673 and Olaparib
Next, we wished to determine whether two PARP inhibitors, BMN673 and Olaparib, could functionally substitute for PARP1 silencing and induce preferential killing within the RAD54B-deficient cells. To begin, standard dose response curves were generated and revealed the RAD54B-deficient cells are hypersensitive to both inhibitors relative to controls. More specifically, the EC50 for BMN673 was 1.9-fold lower within the RAD54B-deficient cells (9.0 nM) than the control (17.5 nM), while for Olaparib it was 1.25-fold lower within the RAD54B-deficient cells (2.82 μM) relative to controls (3.53 μM). Subsequent Student’s t-tests revealed statistically significant decreases in RAD54B-deficient cells following both BMN673 (Figure 2A; Table S3) and Olaparib (Figure 2B; Table S4) treatments. Thus, these data support those of the previous section, and further suggest BMN673 and Olaparib are chemogenetic (i.e. SL) interactors of RAD54B.
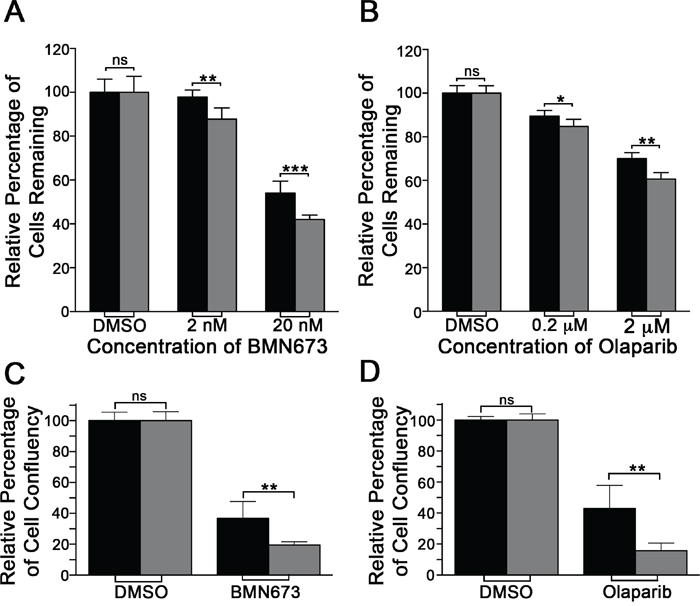
Figure 2: RAD54B-deficient cells are hypersensitive to BMN673 and Olaparib. A. Bar graph depicting the mean (± SD) percentage of RAD54B-proficient (black bars) and RAD54B-deficient (grey bars) cells following DMSO or BMN673 treatment. Statistical significance is indicated (ns, not significant; **, P-value <0.01; ***, P-value <0.001). B. Bar graph presenting the mean (± SD) percentage of RAD54B-proficient (black) and RAD54B-deficient (grey) cells following DMSO or Olaparib treatment. Statistical significance is indicated (ns, not significant; **, P-value <0.01; ***, P-value <0.001). C. Bar graph depicting the mean (± SD) relative percentage of cell confluency for RAD54B-proficient (black) and RAD54B-deficient (grey) cells following DMSO (control) or BMN673 treatment. Data are presented normalized to the respective DMSO treated controls, and statistical significance is as indicated (ns, not significant; **, P-value <0.01). D. Bar graph of the mean (± SD) relative percentage of cell confluency for RAD54B-proficient (black) and RAD54B-deficient (grey) cells following DMSO (control) or Olaparib treatment. Data are presented normalized to the respective DMSO treated controls, and statistical significance is as indicated (ns, not significant; **, P-value <0.01). All experiments were conducted in sextuplet and repeated two additional times.
To confirm the above observations and validate BMN673 and Olaparib as chemogenetic interactors of RAD54B, mCFAs were performed. To best restrict the therapeutic effect to the RAD54B-deficient cells, the EC50 values calculated for BMN673 (9.0 nM) and Olaparib (2.8 μM) were employed in all subsequent work. Briefly, RAD54B-deficient and control cells were treated with compounds for 7 days and cellular confluency was quantitatively assessed. In agreement with the dose response curves, BMN673 and Olaparib treatments induced statistically significant decreases in confluency within the RAD54B-deficient cells relative to controls (Figure 2C and 2D). More specifically, BMN673 and Olaparib induced 1.9- and 2.7-fold decreases, respectively, within the RAD54B-deficient cells (Tables S5 & S6). These data confirm RAD54B and PARP1 are SL and further identify BMN673 and Olaparib as lead therapeutic candidates warranting further pre-clinical investigation.
BMN673 and Olaparib treatments induce proliferation defects in RAD54B-deficient cells
Having established RAD54B-deficient cells are hypersensitive to both PARP inhibitors, we next sought to determine the underlying mechanism accounting for the decrease in cell numbers. Accordingly, RTCA was performed to distinguish whether cell cycle arrests (identified by a cell index plateau) or cellular cytotoxicity (identified as by either a change in slope [decrease] or rapid decline in cell index) were induced following treatments. RTCA employs electrical impedance as a measure of cellular proliferation and can easily discern cell cycle arrests (stationary phase identified by a plateau) from cell cytotoxicity [24, 38]. Figure 3 shows that the proliferation curves generated for the control cells are largely overlapping and virtually indistinguishable irrespective of treatment (DMSO, BMN673 or Olaparib). In contrast however, the proliferation curves are strikingly different within the RAD54B-deficient cells treated with BMN673 or Olaparib relative to vehicle control (DMSO), and are also suggestive of proliferation defects (PDs) rather than cell cycle arrests. For example, BMN673 treatment (Figure 3A) induces a rapid decline in cell index ~40 h post-treatment within the RAD54B-deficient cells, while Olaparib treatment (Figure 3B) decreases proliferation as evidenced by a flattening of the slope during the exponential growth phase. The calculated PDs (Table S7) revealed a 94.2-fold and a 10.4-fold increase in mean PD within the RAD54B-deficient cells treated with BMN673 (Figure 3C) or Olaparib (Figure 3D), respectively. These data are in agreement with the previous section, and show BMN673 and Olaparib treatments induce PDs rather than cell cycle arrests.
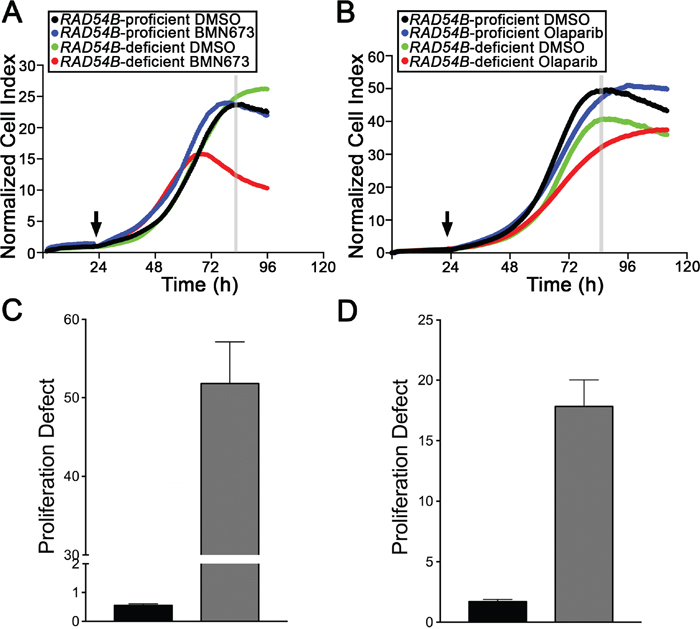
Figure 3: BMN673 and Olaparib treatments induce proliferation defects in RAD54B-deficient cells. A. RTCA proliferation curves for control and RAD54B-deficient cells treated with either DMSO (vehicle control) or BMN673. The arrow identifies the time-point of compound addition, while the grey vertical line identifies the time-point employed to calculate the proliferation defect (~84 h post-seeding). Experiments were performed in quadruplicate and repeated two additional times. B. RTCA proliferation curves for control and RAD54B-deficient cells treated with either DMSO (vehicle control) or Olaparib, with the arrow identifying the time-point of addition, and the grey vertical line identifying the time-point used to calculate the proliferation defect (~88 h post-seeding). Experiments were performed in quadruplicate and repeated two additional times. C. Bar graph presenting the mean proliferation defect (± SD) calculated for the RAD54B-deficient (grey bars) cells treated with BMN673 relative to controls (black bars). D. Bar graph depicting the mean proliferation defect (± SD) observed within the RAD54B-deficient (grey) cells treated with Olaparib relative to controls (black).
BMN673 and Olaparib treatments underlie increases in γ-H2AX and apoptosis in RAD54B-deficient cells
Several research groups have shown that PARP inhibition induces DNA single strand breaks that are converted into DNA DSBs within HRR compromised cells to induce cell death [39, 40], while others have shown excessive DSBs can induce apoptosis [41]. To determine whether DSBs and apoptosis contribute to the PDs described above, we employed semi-quantitative, immunofluorescent microscopy [24] and quantified the global abundance of key indicators of DSBs (γ-H2AX [42]) and apoptosis (cleaved Caspase-3 [43]). We first established our ability to detect changes in γ-H2AX signal intensities (Figure 4A) using ionizing radiation (IR) as a positive control, and as expected, similar increases in γ-H2AX signal intensities occurred within both cell lines (Figure 4B). Interestingly however, although increases in the mean γ-H2AX signal intensities occurred in both lines following BMN673 and Olaparib treatments, the mean γ-H2AX signal intensities were consistently higher within the RAD54B-deficient cells (Figure 4B) suggesting increases in DNA DSBs occur preferentially within RAD54B-deficient cells. In fact, Student’s t-tests revealed significant increases in mean γ-H2AX signal intensities within the RAD54B-deficient cells treated with either BMN673 (1.2-fold) or Olaparib (1.3-fold) relative to controls (Table S8).
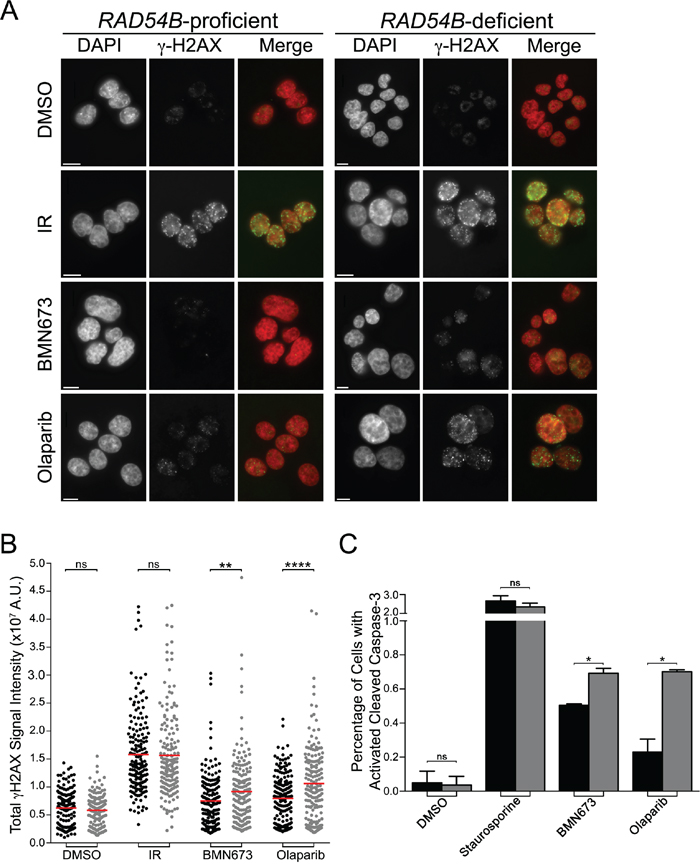
Figure 4: BMN673 and Olaparib induce preferential increases in γ-H2AX and cleaved Caspase-3 signal intensities in RAD54B-deficient cells. A. Representative low resolution images depicting the abundance of γ-H2AX in cells treated with DMSO, IR, BMN673 or Olaparib. All images were acquired 48 h post treatments using the identical exposure times and thus changes in fluorescence intensities reflect changes in the global abundance of γ-H2AX (i.e. DNA DSBs). Nuclei and γ-H2AX are pseudocolored red and green, respectively, within the merge. Scale bar represents 10 μm. B. Scatter plots presenting the total γ-H2AX signal intensities from individual RAD54B-proficient (black circles) and RAD54B-deficient (grey circles) cells treated with DMSO (negative control), IR (positive control), BMN673 or Olaparib as determined by semi-quantitative IIF microscopy. A minimum of 175 cells were imaged per condition and the red bars identify the mean γ-H2AX signal intensity. Student’s t-tests reveal statistically significant increases in γ-H2AX signal intensities in the RAD54B-deficient cells treated with BMN673 and Olaparib relative to corresponding RAD54B-proficient controls. (ns, not significant; **, P-value <0.01; ****, P-value <0.0001). Experiments were repeated two additional times. C. Bar graph presenting the mean (±SD) percentage of RAD54B-proficient (black) and RAD54B-deficient (grey) cells labeled with cleaved Caspase-3 following treatment with DMSO, Staurosporine (positive control), BMN673 or Olaparib. Student’s t-tests reveal statistically significant increases in the percentage of RAD54B-deficient cells labeled with cleaved Caspase-3 following BMN673 and Olaparib treatments relative to corresponding RAD54B-proficient controls. (ns, not significant; *, P-value <0.05). Experiments were repeated two additional times.
Having established that BMN673 and Olaparib treatments preferentially induce increases in a surrogate marker for DNA DSBs in RAD54B-deficient cells, we now wished to determine whether it was associated with increases in apoptosis, as identified by cleaved Caspase-3 signal intensity. Accordingly, quantitative microscopy was performed and the percentage of cells labeled with cleaved Caspase-3 was determined, with Staurosporine serving as the positive control. As shown in Figure 4C, there is a small albeit statistically significant increase in the proportion of RAD54B-deficient cells labeled with cleaved Caspase-3 following BMN673 (1.4-fold) and Olaparib (3.0-fold) treatments relative to controls (Table S9). Collectively, these data show there is an increase in both DNA DSBs and apoptosis following PARP inhibition in RAD54B-deficient cells, that likely accounts for the decrease in cells numbers remaining following treatments.
BMN673 and LCS-1 synergize to enhance RAD54B-deficient cell killing
Recognizing the limited therapeutic potential of targeting PARP1 alone in RAD54B-deficient cells, we wished to identify drug combinations that would exacerbate the SL effect observed with BMN673. We hypothesized that combinations involving inhibitors of known SL interactors, like SOD1 [24], would produce synergistic killing within RAD54B-deficient cells. Accordingly, we performed both single and dual agent dose response experiments involving BMN673 and LCS-1, a recently identified SOD1 inhibitor [44]. As a control, we included 5-FU, a classical frontline drug frequently employed in combinatorial approaches in CRC [45] that does not induce SL killing in RAD54B-deficient cells. Based on Combenefit analyses, the BMN673 plus 5-FU combination showed no synergy and was merely additive (Figure 5A). In stark contrast however, the BMN673 plus LCS-1 combination induced synergistic killing (Figure 5B) that was readily apparent at concentrations ranging from 2.25-36.0 nM (BMN673) and 0.75 μM (LCS-1).
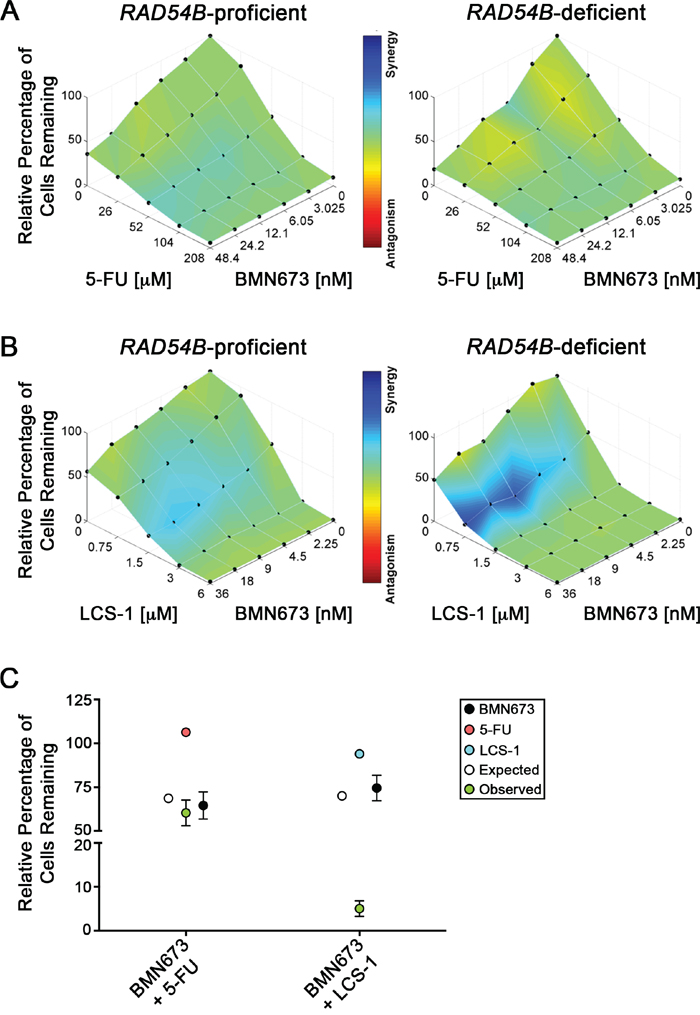
Figure 5: BMN673 synergizes with LCS-1 for enhanced killing of CRC cells. Combenefit mapped surface output for the drug combinations involving BMN673 with A. 5-FU, or B. LCS-1, in RAD54B-proficient (left) and RAD54B-deficient (right) cells. The concentrations of each drug are plotted along the horizontal axes, while the percentage of cells remaining relative to DMSO-treated controls is plotted on the vertical axis. A heat map is used to represent the level of synergy (blue color) at each concentration. All experiments were conducted at least three times. C. Graphical depiction of the mean normalized percentage of RAD54B-deficient cells relative to DMSO (±SD), following single agent treatment with BMN673 (black circles) and either 5-FU (orange circles) or LCS-1 (blue circles), as well as the expected combined value calculated using a multiplicative model (white circles). Green circles identify observed values following combinatorial treatments with either BMN673 plus 5-FU, or BMN673 plus LCS-1. Note that the observed value for BMN673 plus LCS-1 indicates synergistic killing.
Next, we performed modified colony formation assays (mCFAs) to extend the above findings and confirm the simultaneous administration of BMN673 and LCS-1 induces synergistic killing within the RAD54B-deficient cells. As shown in Figure 5C, the combination involving BMN673 plus 5-FU induced growth defects within RAD54B-deficient cells (60.3% confluent relative to DMSO treatment), but to approximately the extent predicted using a multiplicative model (68.7%). This represents a relatively small ~12.2% difference between expected and observed values (Table S10), and supports the Combenefit findings above, suggesting an additive interaction. Interestingly however, the combination involving BMN673 and LCS-1 produced a large decrease in relative cell confluency beyond that predicted using the multiplicative model (Figure 5C). More specifically, the predicted (70.0%) and observed (5.0%) confluency for RAD54B-deficient cells represents a 92.8% difference (Table S11) and strongly indicates the BMN673 and LCS-1 combination is synergistic within RAD54B-deficient cells.
DISCUSSION
To expand the number of drug targets of RAD54B and simultaneously assess the broad-spectrum applicability of PARP1 as a candidate drug target, we evaluated the ability of PARP1 silencing and inhibition to induce SL killing in RAD54B-deficient CRC cells. Using an isogenic RAD54B model, we show that PARP1 silencing preferentially reduces the number of RAD54B-deficient cells relative to controls. We further show that two PARP inhibitors, BMN673 and Olaparib, can functionally substitute for PARP1 silencing by inducing a decrease in RAD54B-deficient cells relative to controls in both short (<4 days) and longer-term assays (<7 days). We further show that BMN673 and Olaparib treatments induce PDs in RAD54B-deficient cells that are accompanied by increases in γ-H2AX and cleaved Caspase-3, which are suggestive of increases in DNA DSBs and apoptosis, respectively. Collectively, these data confirm that RAD54B and PARP1 are SL. Finally, to enhance the potential therapeutic utility and effect of PARP inhibitors, we explored combinatorial approaches involving BMN673 and either 5-FU or LCS-1. Here, we show that combining LCS-1, but not 5-FU, with BMN673 induced synergistic killing within RAD54B-deficient cells. Thus, this study identifies and validates PARP1 as a candidate drug target in RAD54B-deficient CRC cells, and identifies BMN673 and Olaparib as novel candidate chemotherapeutic agents in a RAD54B-specific CRC context. The results also support further preclinical studies evaluating the efficacy of combinatorial approaches involving BMN673 and LCS-1.
Since the original description of a SL interaction between PARP and BRCA1/2 in 2005 [39, 40], PARP inhibitors have garnered substantial attention as novel compounds for precision medicine based approaches in the fight against cancer. In 2014, Olaparib was approved as a mono-therapy for maintenance in women with BRCA1/2 mutant, platinum-responsive, high-grade serous ovarian cancer [46]. Moreover, since the original discovery significant research efforts have focused on expanding the number of chemogenetic interactions involving Olaparib and other PARP inhibitors. In 2014 for example, Bajrami et al [27] performed a genome-wide, shRNA drop-out screen to identify novel chemogenetic interactors of Olaparib. Although this screen confirmed several established PARP1 interactors (BRCA1, RAD51, and FANCC) and identified many novel interactions, it did not confirm several established interactors (e.g. BRCA2 and DSS1) nor did it identify RAD54B as a SL interactor. The authors suggested that they were unable to confirm the established interactions due to inadequate silencing, which may also account for why RAD54B was not previously identified. Independent of this work, many research laboratories have sought to expand the number of chemogenetic interactors of PARP inhibitors. Influenced heavily by the initial observations involving BRCA1/ 2, a number of studies focused on HRR (or DDR) genes as putative interactors. Indeed, many of the identified interactors encode functions within HRR (or DDR) including RAD54L [27], NBS [27, 30], RAD51 [27, 30], RAD51C [27, 31], RAD51D [27, 32], MRE11A [33], XRCC1 [34], XRCC2 [27], ATR [30], ATM [30], DSS1 [30], FANCC [30] and CHEK2 [30], and were identified through a combination of high-throughput screens [27, 28] and direct tests [30–33]. Thus, through direct tests, we have expanded this list to include RAD54B.
Although the clinical applicability of PARP inhibitors is still in its infancy, mechanisms of PARP inhibitor resistance have been identified. For instance, Olaparib resistance was conferred in BRCA2-deficient cancers harboring frame-shift mutations through subsequent mutations that restored the BRCA2 reading frame to effectively/partially rescue the HRR defect [47]. Thus, a major avenue of scientific inquiry now focuses on identifying and predicting the mechanisms of drug resistance in the hopes of identifying additional drug targets that will prevent the resistance mechanism. A major limitation of many current cancer therapies is the risk of developing resistant disease following multiple courses with a particular drug resulting from the selection of a pre-existing resistant clone or the development of a resistant clone within the tumor. It has been suggested that disease recurrence and resistance may be minimized or avoided through the use of combinatorial chemotherapeutic approaches rather than sequential application of single agents [48, 49]. Conceptually, combinatorial approaches may target more cells within the tumor, thus reducing the potential for selection and/or development of resistant clones. In oncogenic addiction for example, drug resistance can occur as a result of redundant biological pathways or the compensatory activity of a secondary pathway that circumnavigates the inhibitory activity of a drug to ultimately activate the downstream components of the oncogenic pathway. Consequently, combinatorial approaches that simultaneously target multiple biological pathways may negate or minimize this possibility and/or induce toxicity in more cells to prevent resistance from developing.
Combinatorial drug strategies beyond preventing drug resistance may also improve the overall treatment efficacy relative to single agents by producing more extensive and robust killing of cancer cells within a tumor. For example, identifying synergistic drug combinations that produce therapeutic effects that are greater than the sum of the two individual agents alone would be highly beneficial. In the current study, we determined BMN673 in combination with LCS-1 induces synergistic killing within RAD54B-deficient cells, whereas BMN673 with 5-FU was only additive. Thus, these findings suggest that generalized DNA damage may be insufficient to synergize with PARP1 inhibition, but rather, synergy may depend on the particular mechanism of DNA damage induction and the particular proteins or factors involved. Importantly, these results demonstrate how chemotherapeutic agents targeting different SL pathways may be strategically combined to enhance the overall SL effect. The same theoretical strategy could be applied to other SL targets and in CRC and other cancer types to more efficiently target and kill cancer cells.
As we approach the era of precision medicine, identifying SL interactors and synergistic drug combinations may represent superior therapeutic strategies to traditional approaches that tend to indiscriminately target all replicating cells, including cancer and normal. Thus, a major goal of the current study was to determine whether PARP1 was a SL interactor of an additional gene involved in HRR. Indeed, we showed that PARP1 is SL with RAD54B, and further determined that BMN673 and Olaparib are capable of exploiting a RAD54B-deficiency in a CRC context. We further evaluated the efficacy of BMN673 in combination with other chemotherapeutic agents, and identified a drug combination (BMN673 plus LCS-1) that induces synergistic killing in 2D cell culture models. Thus, these initial studies may serve as the underpinning for subsequent preclinical work aimed at evaluating the efficacy of these agents within more complex systems, such as animal models. Additionally, these findings serve as a proof of concept in support of combinatorial chemotherapies involving multiple SL targets for a single gene altered in cancer. Thus, expanding SL networks in general and extending these strategies to include additional cancer types may hold clinical potential within the broader context of anti-cancer therapies.
MATERIALS AND METHODS
Cell culture
HCT116 (RAD54B-proficient) cells were purchased from American Type Culture Collection. RAD54B-deficient HCT116 cells were generously provided by K. Miyagawa (Hiroshima University, Japan) and were generated by targeted integration and disruption of the RAD54B locus [11]. All HCT116 cells were grown in McCoy’s 5A medium (HyClone) supplemented with 10% FBS, and RAD54B expression was confirmed by Western blot (Figure 1A). Cell lines were authenticated on the basis of recovery, viability, growth and morphology, and spectral karyotyping. All cells were grown in a 37°C humidified incubator containing 5% CO2.
Gene silencing
Cells were transiently transfected with siRNA duplexes using RNAiMax (Invitrogen) as detailed elsewhere [19, 24]. ON-TARGETplus (Dharmacon) siRNA duplexes targeting RAD54B, PARP1, GAPDH and PLK1 were employed as either individual duplexes or pools (four distinct duplexes targeting the gene of interest), as detailed previously [19, 24]. Gene silencing was confirmed by Western blot.
Western blotting
Western blots were performed as detailed elsewhere [19] and blotted with RAD54B (1:1000; provided by Dr. K. Miyagawa), PARP1 (Abcam ab6079; 1:7500), and α-tubulin (Abcam ab7291; 1:20,000) antibodies. Semi-quantitative analyses were employed to evaluate silencing efficiencies using the Gel Analyzer Tool in ImageJ. All data were normalized to the corresponding loading control (α-tubulin) and are presented relative to the negative control (siGAPDH).
Direct SL tests
High-content microscopy was used to evaluate the SL interaction as detailed elsewhere [19, 24]. Briefly, 4000 RAD54B-proficient or RAD54B-deficient HCT116 cells were seeded into 96-well optical plates. Cells were transfected in sextuplet (i.e. 6 wells per plate) with either individual or pooled siRNAs targeting RAD54B, PARP1, and controls (GAPDH and PLK1). GAPDH serves as a negative control [19], while PLK1 is a positive control for cell death independent of any SL interaction [50] and also serves as a transfection efficiency indicator. Wells were supplemented with 100 μL of media 24 hour (h) post-transfection, and permitted to grow for an additional 3.5 days, following which cells were fixed (4% paraformaldehyde), and counterstained with Hoechst 33342 (300 ng/mL; Thermo Scientific). Images were acquired using a Cytation 3 (BioTek) equipped with a 10x objective (0.3 numerical aperture), a 16-bit gray scale charged couple device camera and Gen5 software. Nine central, non-overlapping images were acquired per well (i.e. condition), and the total number of cells remaining in each well was determined. All data were imported into Prism v6.0 (GraphPad), normalized to GAPDH silenced controls, and basic statistical analyses (e.g. mean, standard deviation, Student t-tests) were performed as described [24]. To address reproducibility all experiments were conducted a minimum of three times.
Dose response curves
Standard dose response curves were generated using a 10-fold serial dilution of BMN673 (200 fM to 20 μM), Olaparib (2 pM to 200 μM), a 5-fold serial dilution of 5-FU (1.28 nM to 100 μM), or a 2-fold serial dilution of LCS-1 (46.9 nM to 12 μM). Briefly, 4000 RAD54B-proficient or -deficient cells were seeded into 96-well optical plates, permitted to attach and treated 24 h post-seeding with DMSO (vehicle control), BMN673, Olaparib, 5-FU, or LCS-1. Cells were permitted to grow for an additional 3.5 days, at which point they were fixed, counterstained (Hoechst), imaged, and analyzed as above. Imaging data (i.e. nuclear counts) were imported into Prism v5.0 (GraphPad) and normalized to DMSO control and an Effective Concentration 50 (EC50) value was determined. The EC50 values for BMN673 (9 nM), Olaparib (2.6 μM), 5-FU (52 nM) and LCS-1 (1.7 μM) in RAD54B-deficient cells were employed in all subsequent experiments. All experiments were conducted a minimum of three times.
Real time cell analyses
Real-time cell analyses (RTCA) (i.e. proliferation curves) were performed in quadruplicate using an RTCA-dual plate (RTCA-DP; Acea Biosciences) instrument housed within a 37°C incubator. The RTCA-DP system employs microelectrodes at the bottom of each well to measure increases or decreases in electrical impedance, termed cell index that reflect increases or decreases in cell numbers, respectively. Briefly, 4000 cells were seeded into each well of an E-plate and growth was monitored every 15 min. DMSO, BMN673 or Olaparib were supplemented into the appropriate wells 24 h post seeding, and growth was monitored for ~4 days. All data were imported into Prism, where Proliferation Defects (PD) were calculated for each line and condition using the following formula:
Modified two dimensional colony forming assays
Modified colony forming assays (mCFAs) were performed utilizing a cell seeding density of 1000 cells/well. Briefly, cells were seeded and treated 24 h later in sextuplet with DMSO, BMN673, or Olaparib. Cells were permitted to grow for 7 days, following which they were fixed, counterstained (0.005% crystal violet solution; Sigma) and imaged. Image intensity thresholding was applied to generate a binary mask that was employed to quantify cell confluency. Next, a circle of a fixed diameter was applied to each well and the average pixel intensity was determined and presented relative to the corresponding control. Similar mCFAs were performed for combinatorial drug treatments, where the media were supplemented with DMSO, BMN673, LCS-1, 5-FU, or combinations of BMN673 plus 5-FU or BMN673 plus LCS-1. Drug concentrations and cell seeding densities were optimized to achieve appropriate growth within a quantifiable range (9 nM BMN673, 52 nM 5-FU and 187.5 nM LCS-1 at 2000 cells/well). To address reproducibility all experiments were conducted a minimum of three times.
Quantitative imaging microscopy
The presence of DNA DSBs was evaluated using an established quantitative, indirect immunofluorescence (IIF) approach [51]. Briefly, 120,000 cells were seeded onto coverslips and permitted to attach. Cells were treated with media containing BMN673, Olaparib or DMSO 24 h post cell seeding and grown for an additional 24 h. Ionizing radiation (IR; 2 Grey) was used as a positive control for DNA DSBs using an RS 2000 X-ray Irradiator (RAD Source Technologies). Cells were fixed, permeabilized, immunofluorescently labeled with γ-H2AX (Abcam ab26350; 1:200) antibody, counterstained (DAPI) and imaged using identical exposure times as described [51]. The total γ-H2AX signal intensity was determined for each nucleus from a minimum of 175 nuclei/condition. Apoptosis was similarly assessed and quantified by calculating the percentage of cells labeled with a cleaved Caspase-3 antibody (Abcam ab13847; 1:200). Briefly, cells were seeded as above and treated with Staurosporine (1 μM; positive control), DMSO, BMN673 or Olaparib. Cells were fixed, permeabilized, immunofluorescently labeled and a minimum of 500 nuclei/condition were imaged and evaluated.
Multi-agent dose response
To assess multi-drug combinations a similar protocol to the Dose Response Curve (above) was employed. Briefly, 4000 asynchronous cells were seeded into each well of a 96-well optical plate. After 24 h, media were supplemented with DMSO (vehicle control), BMN673, 5-FU, LCS-1, or a combination of BMN673 plus 5-FU, or BMN673 plus LCS-1. Five distinct concentrations were employed for BMN673 (2.25, 4.5, 9, 18, 36 nM), while four concentrations were employed for 5-FU (26, 52, 104, 208 nM) and LCS-1 (0.75, 1.5, 3, 6 μM). Cells were permitted to grow for 3.5 days at which point they were analyzed as described above. All data were normalized to DMSO treated controls, and imported into Combenefit software where the Loewe Additivity model was employed to identify synergistic, additive or antagonistic drug combinations.
Multiplicative model
A multiplicative model was employed to determine whether the combined effects of two individual treatment conditions were greater than that predicted by the product of the individual treatments, and is:
A × B = E
where A is the relative percentage of cells remaining following condition A, B is the relative percentage of cells remaining following condition B and E is the expected product of the combined treatments. If the observed relative percentage of cells remaining is less than that predicted by the multiplicative model (i.e. fewer cells remaining within the combined condition than predicted by the model), the response of the combined treatment conditions is synergistic.
ACKNOWLEDGMENTS
We thank Dr. K Miyagawa (The University of Tokyo) for generously providing RAD54B reagents. We would like to acknowledge the strong support of the Research Institute in Oncology and Hematology and CancerCare Manitoba.
CONFLICTS OF INTEREST
The authors have no conflicts to declare.
FUNDING
This work was funded by CancerCare Manitoba Foundation (CCMF) and Canadian Institutes for Health Research (CIHR; MOP-115179) Operating Grants to KJM, and a Research Manitoba/University of Manitoba Graduate Fellowship/CancerCare Manitoba Studentship to ENM.
Author Contributions
Conceived and designed the experiments: ENM and KJM. Performed the experiments: ENM and CCL. Analyzed the data: ENM, CCL and KJM. Wrote the paper: ENM, CCL and KJM.
REFERENCES
1. (2015). American Cancer Society: Cancer Facts and Figures 2015. American Cancer Society, pp. 1-52.
2. (2015). Canadian Cancer Statistics 2015. Canadian Cancer Society, pp. 1-151.
3. Sajesh BV, Guppy BJ, McManus KJ. Synthetic genetic targeting of genome instability in cancer. Cancers. 2013; 5:739-761.
4. Pearl LH, Schierz AC, Ward SE, Al-lazikani B, Pearl FMG. Therapeutic opportunities within the DNA damage response. Nature Reviews Cancer. 2015; 15:166-180.
5. Lengauer C, Kinzler KW, Vogelstein B. Genetic instabilities in human cancers. Nature. 1998; 396:643-649.
6. Markowitz SD, Bertagnolli MM. Molecular Origins of Cancer: Molecular Basis of Colorectal Cancer. N Engl J Med. 2009; 361:2449-2460.
7. Hanahan D, Weinberg Ra. Hallmarks of cancer: the next generation. Cell. 2011; 144:646-674.
8. Cancer Genome Atlas N. Comprehensive molecular characterization of human colon and rectal cancer. Nature. 2012; 487:330-337.
9. Eirew P, Steif A, Khattra J, Ha G, Yap D, Farahani H, Gelmon K, Chia S, Mar C, Wan A, Laks E, Biele J, Shumansky K, Rosner J, McPherson A, Nielsen C, et al. Dynamics of genomic clones in breast cancer patient xenografts at single-cell resolution. Nature. 2015; 518:422-426.
10. Cancer Genome Atlas Research N. Comprehensive molecular profiling of lung adenocarcinoma. Nature. 2014; 511:543-550.
11. Miyagawa K, Tsuruga T, Kinomura A, Usui K, Katsura M, Tashiro S, Mishima H, Tanaka K. A role for RAD54B in homologous recombination in human cells. The EMBO journal. 2002; 21:175-180.
12. Sarai N, Kagawa W, Kinebuchi T, Kagawa A, Tanaka K, Miyagawa K, Ikawa S, Shibata T, Kurumizaka H, Yokoyama S. Stimulation of Dmc1-mediated DNA strand exchange by the human Rad54B protein. Nucleic Acids Res. 2006; 34:4429-4437.
13. Wesoly J, Agarwal S, Sigurdsson S, Bussen W, Van Komen S, Qin J, van Steeg H, van Benthem J, Wassenaar E, Baarends WM, Ghazvini M, Tafel Aa, Heath H, Galjart N, Essers J, Grootegoed JA, et al. Differential contributions of mammalian Rad54 paralogs to recombination, DNA damage repair, and meiosis. Molecular and cellular biology. 2006; 26:976-989.
14. Zhang Z, Fan HY, Goldman JA, Kingston RE. Homology-driven chromatin remodeling by human RAD54. Nat Struct Mol Biol. 2007; 14:397-405.
15. Pazin MJ, Kadonaga JT. SWI2/SNF2 and Related Proteins: ATP-Driven Motors That Disrupt-Protein–DNA Interactions? Cell. 1997; 88:737-740.
16. Heyer WD, Li X, Rolfsmeier M, Zhang XP. Rad54: The Swiss Army knife of homologous recombination? Nucleic Acids Research. 2006; 34:4115-4125.
17. Tanaka K, Hiramoto T, Fukuda T, Miyagawa K. A novel human Rad54 homologue, Rad54B, associates with Rad51. Journal of Biological Chemistry. 2000; 275:26316-26321.
18. Otterlei M, Bruheim P, Ahn B, Bussen W, Karmakar P, Baynton K, Bohr Va. Werner syndrome protein participates in a complex with RAD51, RAD54, RAD54B and ATR in response to ICL-induced replication arrest. Journal of cell science. 2006; 119:5137-5146.
19. McManus KJ, Barrett IJ, Nouhi Y, Hieter P. Specific synthetic lethal killing of RAD54B-deficient human colorectal cancer cells by FEN1 silencing. Proceedings of the National Academy of Sciences of the United States of America. 2009; 106:3276-3281.
20. Gordon DJ, Resio B, Pellman D. Causes and consequences of aneuploidy in cancer. Nature reviews Genetics. 2012; 13:189-203.
21. Cunningham CE, Li S, Vizeacoumar FS, Bhanumathy KK, Lee JS, Parameswaran S, Furber L, Abuhussein O, Paul JM, McDonald M, Templeton SD, Shukla H, El Zawily AM, et al. Therapeutic relevance of the protein phosphatase 2A in cancer. Oncotarget. 2016; 7:61544-61561. doi: 10.18632/oncotarget.11399.
22. Czyz M, Toma M, Gajos-Michniewicz A, Majchrzak K, Hoser G, Szemraj J, Nieborowska-Skorska M, Cheng P, Gritsyuk D, Levesque M, Dummer R, Sliwinski T, Skorski T. PARP1 inhibitor olaparib (Lynparza) exerts synthetic lethal effect against ligase 4-deficient melanomas. Oncotarget. 2016; doi: 10.18632/oncotarget.12270.
23. Paul JM, Toosi B, Vizeacoumar FS, Bhanumathy KK, Li Y, Gerger C, El Zawily A, Freywald T, Anderson DH, Mousseau D, Kanthan R, Zhang Z, Vizeacoumar FJ, et al. Targeting synthetic lethality between the SRC kinase and the EPHB6 receptor may benefit cancer treatment. Oncotarget. 2016; 7:50027-50042. doi: 10.18632/oncotarget.10569.
24. Sajesh BV, Bailey M, Lichtensztejn Z, Hieter P, McManus KJ. Synthetic lethal targeting of superoxide dismutase 1 selectively kills RAD54B-deficient colorectal cancer cells. Genetics. 2013; 195:757-767.
25. Oh S, Wang Y, Zimbric J, Hendrickson Ea. Human LIGIV is synthetically lethal with the loss of Rad54B-dependent recombination and is required for certain chromosome fusion events induced by telomere dysfunction. Nucleic Acids Research. 2013; 41:1734-1749.
26. van Pel DM, Barrett IJ, Shimizu Y, Sajesh BV, Guppy BJ, Pfeifer T, McManus KJ, Hieter P. An Evolutionarily Conserved Synthetic Lethal Interaction Network Identifies FEN1 as a Broad-Spectrum Target for Anticancer Therapeutic Development. PLoS Genetics. 2013; 9:e1003254.
27. Bajrami I, Frankum JR, Konde A, Miller RE, Rehman FL, Brough R, Campbell J, Sims D, Rafiq R, Hooper S, Chen L, Kozarewa I, Assiotis I, Fenwick K, Natrajan R, Lord CJ, et al. Genome-wide profiling of genetic synthetic lethality identifies CDK12 as a novel determinant of PARP1/2 inhibitor sensitivity. Cancer Research. 2014; 74:287-297.
28. Lord CJ, McDonald S, Swift S, Turner NC, Ashworth A. A high-throughput RNA interference screen for DNA repair determinants of PARP inhibitor sensitivity. DNA Repair. 2008; 7:2010-2019.
29. Sajesh BV, Bailey M, Lichtensztejn Z, Hieter P, McManus KJ. Synthetic lethal targeting of superoxide dismutase 1 selectively kills RAD54B-deficient colorectal cancer cells. Genetics. 2013; 195:757-767.
30. McCabe N, Turner NC, Lord CJ, Kluzek K, Białkowska A, Swift S, Giavara S, O'Connor MJ, Tutt AN, Zdzienicka MZ, Smith GCM, Ashworth A. Deficiency in the repair of DNA damage by homologous recombination and sensitivity to poly(ADP-ribose) polymerase inhibition. Cancer Research. 2006; 66:8109-8115.
31. Min A, Im S-A, Yoon Y-K, Song S-H, Nam H-J, Hur H-S, Kim H-P, Lee K-H, Han S-W, Oh D-Y, Kim T-Y, O'Connor MJ, Kim W-H, Bang Y-J. RAD51C-deficient cancer cells are highly sensitive to the PARP inhibitor olaparib. Molecular cancer therapeutics. 2013; 12:865-877.
32. Loveday C, Turnbull C, Ramsay E, Hughes D, Ruark E, Frankum JR, Bowden G, Kalmyrzaev B, Warren-Perry M, Snape K, Adlard JW, Barwell J, Berg J, Brady AF, Brewer C, Brice G, et al. Germline mutations in RAD51D confer susceptibility to ovarian cancer. Nature genetics. 2011; 43:879-882.
33. Koppensteiner R, Samartzis EP, Noske A, von Teichman A, Dedes I, Gwerder M, Imesch P, Ikenberg K, Moch H, Fink D, Stucki M, Dedes KJ. Effect of MRE11 loss on PARP-inhibitor sensitivity in endometrial cancer in vitro. PloS one. 2014; 9:e100041.
34. Turner NC, Lord CJ, Iorns E, Brough R, Swift S, Elliott R, Rayter S, Tutt AN, Ashworth A. A synthetic lethal siRNA screen identifying genes mediating sensitivity to a PARP inhibitor. The EMBO journal. 2008; 27:1368-1377.
35. Hiramoto T, Nakanishi T, Sumiyoshi T, Fukuda T, Matsuura S, Tauchi H, Komatsu K, Shibasaki Y, Inui H, Watatani M, Yasutomi M, Sumii K, Kajiyama G, Kamada N, Miyagawa K, Kamiya K. Mutations of a novel human RAD54 homologue, RAD54B, in primary cancer. Oncogene. 1999; 18:3422-3426.
36. Tanaka K, Kagawa W, Kinebuchi T, Kurumizaka H, Miyagawa K. Human Rad54B is a double-stranded DNA-dependent ATPase and has biochemical properties different from its structural homolog in yeast, Tid1/Rdh54. Nucleic Acids Res. 2002; 30:1346-1353.
37. Murzik U, Hemmerich P, Weidtkamp-Peters S, Ulbricht T, Bussen W, Hentschel J, von Eggeling F, Melle C. Rad54B targeting to DNA double-strand break repair sites requires complex formation with S100A11. Molecular biology of the cell. 2008; 19:2926-2935.
38. Sajesh BV, McManus KJ. Targeting SOD1 induces synthetic lethal killing in BLM- and CHEK2-deficient colorectal cancer cells. Oncotarget. 2015; 6:27907-27922. doi: 10.18632/oncotarget.4875.
39. Bryant HE, Schultz N, Thomas HD, Parker KM, Flower D, Lopez E, Kyle S, Meuth M, Curtin NJ, Helleday T. Specific killing of BRCA2-deficient tumours with inhibitors of poly (ADP-ribose) polymerase. Nature. 2005; 434:913-918.
40. Farmer H, McCabe N, Lord CJ, Tutt AN, Johnson DA, Richardson TB, Santarosa M, Dillon KJ, Hickson I, Knights C, Martin NM, Jackson SP, Smith GC, Ashworth A. Targeting the DNA repair defect in BRCA mutant cells as a therapeutic strategy. Nature. 2005; 434:917-921.
41. Ciccia A, Elledge SJ. The DNA Damage Response: Making It Safe to Play with Knives. Molecular Cell. 2010; 40:179-204.
42. Rogakou EP, Pilch DR, Orr AH, Ivanova VS, Bonner WM. DNA Double-stranded Breaks Induce Histone H2AX Phosphorylation on Serine 139. The Journal of biological chemistry. 1998; 273:5858-5868.
43. Zhivotovsky B, Samali A, Gahm A, Orrenius S. Caspases: their intracellular localization and translocation during apoptosis. Cell death and differentiation. 1999; 6:644-651.
44. Somwar R, Erdjument-Bromage H, Larsson E, Shum D, Lockwood WW, Yang G, Sander C, Ouerfelli O, Tempst PJ, Djaballah H, Varmus HE. Superoxide dismutase 1 (SOD1) is a target for a small molecule identified in a screen for inhibitors of the growth of lung adenocarcinoma cell lines. Proc Natl Acad Sci U S A. 2011; 108:16375-16380.
45. Cremolini C, Schirripa M, Antoniotti C, Moretto R, Salvatore L, Masi G, Falcone A, Loupakis F. First-line chemotherapy for mCRC - a review and evidence-based algorithm. Nat Rev Clin Oncol. 2015; 12:607-619.
46. Kim G, Ison G, McKee AE, Zhang H, Tang S, Gwise T, Sridhara R, Lee E, Tzou A, Philip R, Chiu HJ, Ricks TK, Palmby T, Russell AM, Ladouceur G, Pfuma E, et al. FDA approval summary: Olaparib monotherapy in patients with deleterious germline BRCA-mutated advanced ovarian cancer treated with three or more lines of chemotherapy. Clinical Cancer Research. 2015; 21:4257-4261.
47. Edwards SL, Brough R, Lord CJ, Natrajan R, Vatcheva R, Levine Da, Boyd J, Reis-Filho JS, Ashworth A. Resistance to therapy caused by intragenic deletion in BRCA2. Nature. 2008; 451:1111-1115.
48. Redmond KL, Papafili A, Lawler M, Van Schaeybroeck S. Overcoming Resistance to Targeted Therapies in Cancer. Seminars in oncology. 2015; 42:896-908.
49. Jia J, Zhu F, Ma X, Cao Z, Li Y, Chen YZ. Mechanisms of drug combinations: interaction and network perspectives. Nature reviews Drug discovery. 2009; 8:111-128.
50. Spankuch-Schmitt B, Bereiter-Hahn J, Kaufmann M, Strebhardt K. Effect of RNA Silencing of Polo-Like Kinase-1 (PLK1) on Apoptosis and Spindle Formation in Human Cancer Cells. Journal of National Cancer Institute. 2002; 94:1863-1877.
51. McManus KJ, Hendzel MJ. Phosphorylation of H2AX in Normally Growing Mammalian Cells. Molecular biology of the cell. 2005; 16:5013-5025.