
INTRODUCTION
Orofacial clefts include cleft palate only (CPO), cleft lip with cleft palate (CLP) and cleft lip only (CLO). Approximately 1/800 live births worldwide are affected by these diseases [1]. Nonsyndromic orofacial clefts occur as isolated entities with no other apparent structural and/or developmental abnormalities. The majority of CLP cases are nonsyndromic (NS) (~70%) [2]. Cleft palate only (CPO) is the least common form of the orofacial clefts (approximately 33%) [3]. The aetiology is multifactorial and involves both genetic and environmental risk factors. Most studies suggest that distinct etiological mechanisms underlie CLP and CPO [4, 5]; however, some overlapping exists in their aetiologies [6, 7]. Thus, our knowledge about whether CPO does indeed differ from CLP remains incomplete.
Mounting evidence suggests that miRNAs could be functionally important for the regulation of vertebrate and mammalian orofacial clefting [8–10]. The identification of the miRNA-mRNA regulatory molecules is important to understand the regulatory mechanisms of CLP and CPO. The potential of plasma miRNAs to be potential non-invasive diagnostic biomarkers for nonsyndromic cleft lip in infants has been reported [11]. In this study, based on our Agilent human miRNA microarray chips, we identified differentially expressed plasma microRNAs in nonsyndromic cleft palate and nonsyndromic cleft lip with cleft palate. Using gene ontology and pathway analysis of the target genes of these miRNAs, we report that distinct biological processes interact and coordinate the physiology of nonsyndromic cleft palate and nonsyndromic cleft lip with cleft palate.
RESULTS
miRNA microarray analysis
To investigate whether circulating miRNAs are associated with the pathogenesis of cleft palate and cleft lip with cleft palate, plasma samples were collected from healthy children and children with nonsyndromic cleft palate (NSCLP) and cleft lip with cleft palate (NSCLP). A comprehensive miRNA microarray analysis was performed on nine plasma samples, including three NSCP plasma samples (mixed as the CP group), three NSCLP plasma samples (mixed as the CLP group) and three plasma samples from healthy children (mixed as the Control group). Hierarchical clustering was used to show the miRNAs expression variation and patterns among these three groups CP, CLP and Control (Figure 1A). We also screened for differentially expressed miRNAs that showed a two-fold or greater change (compared to the control group) in the CP and CLP plasma samples, and illustrated the overlapping between the two data sets using Venn diagrams (Figure 1B, 1C). A total of 63 miRNAs were upregulated in both the CP and CLP plasma samples (Figure 1B). The upregulated miRNAs are listed in Table 1 (fold change ≥ 2). Furthermore, 49 miRNAs were downregulated in both the CP and CLP plasma samples (Figure 1C). The downregulated miRNAs are listed in Table 2 (fold change ≥ 2).
Table 1: List of 63 miRNAs that were co-overexpressed in CP and CLP plasma samples
miRNA |
Fold change in CP |
Fold change in CLP |
Mirbase_accession_No |
|---|---|---|---|
hsa-let-7a-5p |
2.593625 |
3.62266 |
MIMAT0000062 |
hsa-let-7f-5p |
36.22597 |
94.70817 |
MIMAT0000067 |
hsa-miR-1182 |
21.12385 |
26.03614 |
MIMAT0005827 |
hsa-miR-1185-2-3p |
35.17025 |
22.02562 |
MIMAT0022713 |
hsa-miR-1226-5p |
33.54898 |
41.68948 |
MIMAT0005576 |
hsa-miR-1249-3p |
40.65461 |
26.77842 |
MIMAT0005901 |
hsa-miR-126-5p |
22.59582 |
11.5428 |
MIMAT0000444 |
hsa-miR-139-3p |
9.764356 |
30.04384 |
MIMAT0004552 |
hsa-miR-144-5p |
22.1287 |
34.8168 |
MIMAT0004600 |
hsa-miR-150-5p |
2.004063 |
5.130724 |
MIMAT0000451 |
hsa-miR-17-3p |
25.74652 |
10.66161 |
MIMAT0000071 |
hsa-miR-194-5p |
2.004321 |
2.671813 |
MIMAT0000460 |
hsa-miR-195-5p |
11.29176 |
10.05747 |
MIMAT0000461 |
hsa-miR-215-5p |
10.32331 |
24.41001 |
MIMAT0000272 |
hsa-miR-27b-3p |
10.79146 |
4.974262 |
MIMAT0000419 |
hsa-miR-301a-3p |
2.216769 |
2.039103 |
MIMAT0000688 |
hsa-miR-30b-5p |
43.5225 |
53.10868 |
MIMAT0000420 |
hsa-miR-30c-1-3p |
9.047681 |
4.742653 |
MIMAT0004674 |
hsa-miR-30c-5p |
10.41076 |
4.763296 |
MIMAT0000244 |
hsa-miR-3156-5p |
39.43275 |
33.64425 |
MIMAT0015030 |
hsa-miR-3158-5p |
36.59335 |
29.4613 |
MIMAT0019211 |
hsa-miR-340-5p |
4.435901 |
10.44386 |
MIMAT0004692 |
hsa-miR-3648 |
2.844126 |
7.529149 |
MIMAT0018068 |
hsa-miR-374a-5p |
41.436 |
53.56016 |
MIMAT0000727 |
hsa-miR-3945 |
54.65085 |
55.2666 |
MIMAT0018361 |
hsa-miR-424-5p |
11.5428 |
23.91295 |
MIMAT0001341 |
hsa-miR-4314 |
48.6155 |
91.10153 |
MIMAT0016868 |
hsa-miR-4417 |
39.91649 |
27.81709 |
MIMAT0018929 |
hsa-miR-4496 |
21.48931 |
25.86879 |
MIMAT0019031 |
hsa-miR-4508 |
20.71299 |
22.6453 |
MIMAT0019045 |
hsa-miR-4673 |
23.30205 |
21.36562 |
MIMAT0019755 |
hsa-miR-4688 |
9.853577 |
37.87732 |
MIMAT0019777 |
hsa-miR-4698 |
2.111651 |
2.899994 |
MIMAT0019793 |
hsa-miR-4707-3p |
53.56016 |
88.45938 |
MIMAT0019808 |
hsa-miR-4716-3p |
25.26925 |
22.1287 |
MIMAT0019827 |
hsa-miR-4734 |
10.01005 |
24.63449 |
MIMAT0019859 |
hsa-miR-4769-5p |
10.66161 |
4.959765 |
MIMAT0019922 |
hsa-miR-532-5p |
10.62257 |
4.541014 |
MIMAT0002888 |
hsa-miR-550a-3-5p |
22.36834 |
10.8752 |
MIMAT0020925 |
hsa-miR-564 |
9.835221 |
47.83535 |
MIMAT0003228 |
hsa-miR-601 |
35.01135 |
36.03937 |
MIMAT0003269 |
hsa-miR-6071 |
21.2377 |
52.38286 |
MIMAT0023696 |
hsa-miR-6133 |
10.44386 |
27.50138 |
MIMAT0024617 |
hsa-miR-652-3p |
22.6453 |
4.860917 |
MIMAT0003322 |
hsa-miR-660-5p |
24.63449 |
28.21952 |
MIMAT0003338 |
hsa-miR-663a |
28.76448 |
47.35553 |
MIMAT0003326 |
hsa-miR-6738-5p |
9.491392 |
40.3395 |
MIMAT0027377 |
hsa-miR-6748-5p |
10.37443 |
20.60795 |
MIMAT0027396 |
hsa-miR-6758-5p |
23.39996 |
9.81465 |
MIMAT0027416 |
hsa-miR-6774-5p |
20.60795 |
4.699301 |
MIMAT0027448 |
hsa-miR-6777-3p |
35.46738 |
53.8186 |
MIMAT0027455 |
hsa-miR-6784-5p |
33.23554 |
28.4822 |
MIMAT0027468 |
hsa-miR-6793-5p |
23.91295 |
3.695676 |
MIMAT0027486 |
hsa-miR-6807-5p |
27.50138 |
34.4576 |
MIMAT0027514 |
hsa-miR-6820-5p |
22.91788 |
39.11779 |
MIMAT0027540 |
hsa-miR-6887-5p |
28.4822 |
22.30914 |
MIMAT0027674 |
hsa-miR-6889-5p |
9.57147 |
39.91649 |
MIMAT0027678 |
hsa-miR-7109-5p |
22.30914 |
20.89674 |
MIMAT0028115 |
hsa-miR-711 |
21.61314 |
28.39723 |
MIMAT0012734 |
hsa-miR-7114-5p |
9.41187 |
23.30205 |
MIMAT0028125 |
hsa-miR-8060 |
29.71088 |
24.85582 |
MIMAT0030987 |
hsa-miR-8089 |
9.716781 |
22.36834 |
MIMAT0031016 |
hsa-miR-877-5p |
36.42551 |
38.19915 |
MIMAT0004949 |
Table 2: List of 49 miRNAs that were co-downregulated in CP and CLP plasma samples
miRNA |
Fold change in CP |
Fold change in CLP |
Mirbase_accession_No |
|---|---|---|---|
hsa-miR-122-5p |
0.014823713 |
0.330486 |
MIMAT0000421 |
hsa-miR-1237-3p |
0.04279959 |
0.178651 |
MIMAT0005592 |
hsa-miR-1260a |
0.42197306 |
0.188688 |
MIMAT0005911 |
hsa-miR-1281 |
0.292045994 |
0.361803 |
MIMAT0005939 |
hsa-miR-1304-3p |
0.022515879 |
0.021418 |
MIMAT0022720 |
hsa-miR-1825 |
0.305341608 |
0.315741 |
MIMAT0006765 |
hsa-miR-191-3p |
0.210027916 |
0.202306 |
MIMAT0001618 |
hsa-miR-193a-5p |
0.425119659 |
0.1725 |
MIMAT0004614 |
hsa-miR-221-3p |
0.38537867 |
0.317683 |
MIMAT0000278 |
hsa-miR-3187-3p |
0.013885943 |
0.013209 |
MIMAT0015069 |
hsa-miR-338-3p |
0.04279959 |
0.214453 |
MIMAT0000763 |
hsa-miR-4286 |
0.481616926 |
0.148742 |
MIMAT0016916 |
hsa-miR-4290 |
0.04279959 |
0.040714 |
MIMAT0016921 |
hsa-miR-4428 |
0.354170872 |
0.170319 |
MIMAT0018943 |
hsa-miR-4433a-5p |
0.207866953 |
0.084119 |
MIMAT0020956 |
hsa-miR-4455 |
0.422613454 |
0.365739 |
MIMAT0018977 |
hsa-miR-4649-3p |
0.200187171 |
0.091757 |
MIMAT0019712 |
hsa-miR-4668-5p |
0.389545483 |
0.170031 |
MIMAT0019745 |
hsa-miR-4728-5p |
0.471992677 |
0.412945 |
MIMAT0019849 |
hsa-miR-4738-3p |
0.356057291 |
0.151948 |
MIMAT0019867 |
hsa-miR-4749-3p |
0.431131255 |
0.458677 |
MIMAT0019886 |
hsa-miR-4769-3p |
0.299500434 |
0.328468 |
MIMAT0019923 |
hsa-miR-483-3p |
0.025346248 |
0.25173 |
MIMAT0002173 |
hsa-miR-494-3p |
0.421072365 |
0.074374 |
MIMAT0002816 |
hsa-miR-497-5p |
0.26762079 |
0.401373 |
MIMAT0002820 |
hsa-miR-574-3p |
0.032438225 |
0.165143 |
MIMAT0003239 |
hsa-miR-574-5p |
0.398577728 |
0.302998 |
MIMAT0004795 |
hsa-miR-636 |
0.405198518 |
0.173279 |
MIMAT0003306 |
hsa-miR-6508-5p |
0.021489753 |
0.091996 |
MIMAT0025472 |
hsa-miR-6515-3p |
0.233030948 |
0.255185 |
MIMAT0025487 |
hsa-miR-6732-3p |
0.029496564 |
0.129832 |
MIMAT0027366 |
hsa-miR-6751-3p |
0.096354218 |
0.272251 |
MIMAT0027403 |
hsa-miR-6776-5p |
0.023690732 |
0.022536 |
MIMAT0027452 |
hsa-miR-6785-5p |
0.292436258 |
0.215104 |
MIMAT0027470 |
hsa-miR-6797-3p |
0.486474133 |
0.356753 |
MIMAT0027495 |
hsa-miR-6800-3p |
0.207096926 |
0.209525 |
MIMAT0027501 |
hsa-miR-6813-3p |
0.295100077 |
0.244702 |
MIMAT0027527 |
hsa-miR-6851-3p |
0.02840522 |
0.109846 |
MIMAT0027603 |
hsa-miR-6861-3p |
0.02773473 |
0.119237 |
MIMAT0027624 |
hsa-miR-6870-3p |
0.04279959 |
0.040714 |
MIMAT0027641 |
hsa-miR-6873-3p |
0.022068915 |
0.020993 |
MIMAT0027647 |
hsa-miR-6880-3p |
0.04279959 |
0.040714 |
MIMAT0027661 |
hsa-miR-7111-3p |
0.02234751 |
0.227218 |
MIMAT0028120 |
hsa-miR-7114-3p |
0.04279959 |
0.180041 |
MIMAT0028126 |
hsa-miR-7641 |
0.466679177 |
0.29544 |
MIMAT0029782 |
hsa-miR-766-3p |
0.248388555 |
0.280315 |
MIMAT0003888 |
hsa-miR-7975 |
0.443053554 |
0.153591 |
MIMAT0031178 |
hsa-miR-7977 |
0.425407891 |
0.15303 |
MIMAT0031180 |
hsa-miR-8073 |
0.04279959 |
0.462327 |
MIMAT0031000 |
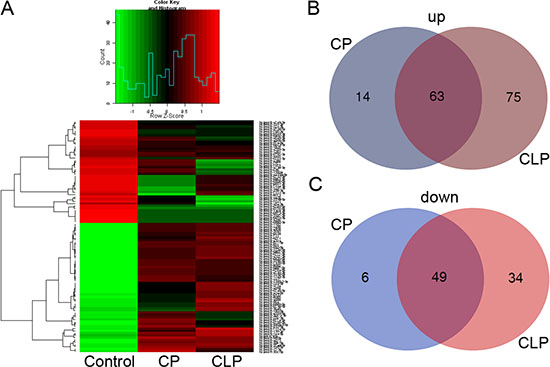
Figure 1: plasma miRNA microarray expression data among the patients with nonsyndromic cleft palate, nonsyndromic cleft lip with cleft palate and healthy children. (A) Hierarchical clustering reveals the miRNA expression profile. (B) Venn diagrams show the number of distinct and overlapping upregulated miRNAs in CP and CLP. (C) Venn diagrams show the number of distinct and overlapping downregulated miRNAs in CP and CLP.
Expression validation of selected miRNAs using Bulge-Loop™ qRT-PCR analysis
Among the 63 upregulated and 49 downregulated miRNAs in both the CP and CLP plasma samples, six miRNAs, namely miR-340–5p, miR-877–5p, miR-3648, miR-1260a, miR-494–3p, and miR-1304–3p, were selected for expression validation (Table 3). The selection standards were the same as we previously reported [11] and were as follows: infrequently reported in the literature, present in both samples and higher deep sequencing reads in miRBase. Bulge-Loop™ qRT-PCR was performed to validate these six differentially expressed miRNAs found in the miRNA microarray analysis. RNA was isolated from 57 plasma samples, including samples from 16 CP, 33 CLP and 8 healthy children, using the mirVana PARIS kit (Ambion, Carlsbad, CA, USA). The results showed that three miRNAs, miR-340–5p, miR-877–5p and miR-3648, were significantly upregulated in both the CP and CLP plasma samples (Figure 2). In contrast, three miRNAs, miR-1260a, miR-494–3p and miR-1304–3p, were significantly downregulated in both the CP and CLP plasma samples (Figure 2). Therefore, a similar pattern of upregulation and downregulation was observed in both the microarray and qRT-PCR samples for the 6 miRNAs assessed (Table 3, Figure 2). Therefore, our microarray data were reliable and stable.
Table 3: Selected six miRNAs’ basic characteristics
miRNA |
Fold change in |
Fold change in |
Dysregulation |
miRBase deep sequencing |
|---|---|---|---|---|
miR-340-5p |
4.435901 |
10.44386 |
up |
329 |
miR-877-5p |
36.42551 |
38.19915 |
up |
2840 |
miR-3648 |
2.844126 |
7.529149 |
up |
650 |
miR-1260a |
0.42197306 |
0.188688 |
down |
29 |
miR-494-3p |
0.421072365 |
0.074374 |
down |
153 |
miR-1304-3p |
0.022515879 |
0.021418 |
down |
4 |
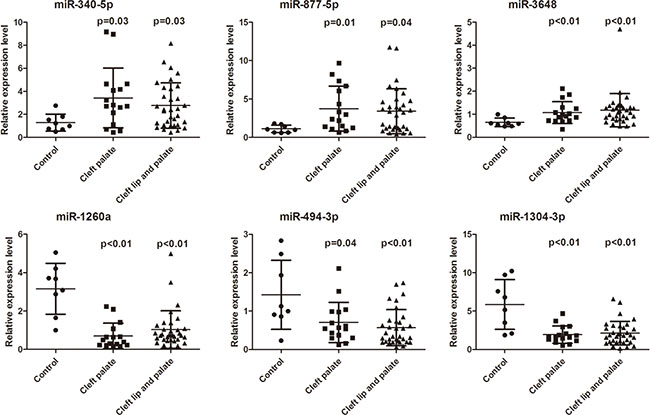
Figure 2: Rela6tive expression level (2−ΔΔCt) of miR-340-5p, miR-877-5p, miR-3648, miR-1260a, miR-494-3p, and miR-1304-3p expression in the plasma of cleft palate patients (n =16), cleft lip with cleft palate patients (n = 33) and controls (n = 8) (Mann-Whitney U test). P values are listed above the data dot.
Functional analysis of potential target genes of co-expressed dysregulated miRNAs
To explore whether overlapping biological processes were found in both CLP and CPO, we performed gene ontology (GO) and KEGG pathway analysis for the predicted targets of the differentially expressed miRNAs, including the 63 upregulated and 49 downregulated miRNAs in both CP and CLP, which produced 4227 and 2684 predictive target genes, respectively. The top ten enriched GO terms for the upregulated and downregulated are listed in Figure 3A and 3B, respectively. The analysis revealed that the potential target genes of the 63 miRNAs upregulated in both CP and CLP were associated with glutamate secretion, aorta or palate development, positive regulation of axonogenesis, cardiac septum development, artery development, the canonical Wnt signalling pathway, and the ephrin receptor signalling pathway (Figure 3A). Conversely, the potential target genes of the 49 miRNAs downregulated in both CP and CLP were associated with the generation of contraction-related action potentials in cardiac muscle cells, cardiac muscle cell contraction, columnar/cuboidal epithelial cell development, cardiac conduction, positive regulation of axonogenesis, and the ephrin receptor signalling pathway (Figure 3B). Pathway enrichment analysis revealed that the potential target genes of the miRNAs dysregulated in both CP and CLP were involved in p53 signalling, Wnt signalling, circadian rhythm, insulin resistance, and the AMPK signalling pathway (Figure 3C, 3D).
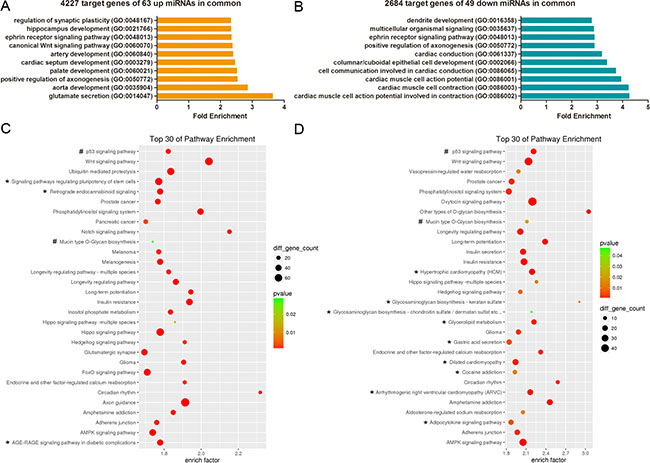
Figure 3: GO and KEGG pathway analyses show the associated function of the target genes of the miRNAs dysregulated in both CP and CLP. (A) The top 10 enriched GO terms for the 4227 target genes of the 63 miRNAs upregulated in both CP and CLP. (B) The top 10 enriched GO terms for the 2684 target genes of the 49 miRNAs downregulated in both CP and CLP. (C) The top 30 enriched pathways for the 4227 target genes of the 63 miRNAs upregulated in both CP and CLP. (D) The top 30 enriched pathways for the 2684 target genes of the 49 miRNAs downregulated in both CP and CLP. (C-D) The enrichment P values were calculated using Fisher’s exact test. The term/pathway on the vertical axis was drawn according to the first letter of the pathway name in descending order. The horizontal axis represents the enrichment factor, i.e., (the number of dysregulated genes in a pathway/the total number of dysregulated genes)/(the number of genes in a pathway in the database/the total number of genes in the database). The top 30 enriched pathways were selected according to the enrichment factor value. The selection standards were the number of genes in a pathway ≥ 4 and p < 0.05. The different colours from green to red represent the p-value. The different sizes of the round shapes represent the gene count number in a pathway. *indicates the pathway is similarly regulated in both CP and CLP. # means the pathway is regulated in both CP and CLP but the miRNA target genes may be upregulated or downregulated.
Function analysis of the potential target genes of the miRNAs dysregulated in CP
To explore whether distinct biological processes regulated CLP and CPO, we performed gene ontology (GO) and KEGG analysis of the predicted targets of the differentially expressed miRNAs in CP, including 14 upregulated miRNAs producing 1057 predictive target genes and 6 downregulated miRNAs yielding 363 potential target genes. The top ten enriched GO terms are listed in Figure 4A and 4B, respectively. The analysis revealed that the potential target genes of the 14 miRNAs upregulated in CP were associated with hippo signalling, dendrite morphogenesis or development, positive regulation of smooth muscle cell proliferation, neural tube formation and developmental cell growth (Figure 4A). Conversely, the potential target genes of the 6 miRNAs downregulated in CP were associated with modulation of synaptic transmission, blood vessel or tissue morphogenesis, regulation of cell morphogenesis or cell differentiation and neurogenesis (Figure 4B). Surprisingly, 1057 of the predictive target genes of the 14 miRNAs upregulated in CP did not display KEGG enrichment results using the SBC analysis system. For the 363 potential target genes of the 6 miRNAs downregulateCP, the pathway enrichment results showed that those genes were mainly involved in thyroid cancer, the Notch signalling pathway, fatty acid metabolism, adherens junctions and amphetamine addiction (Figure 4C).
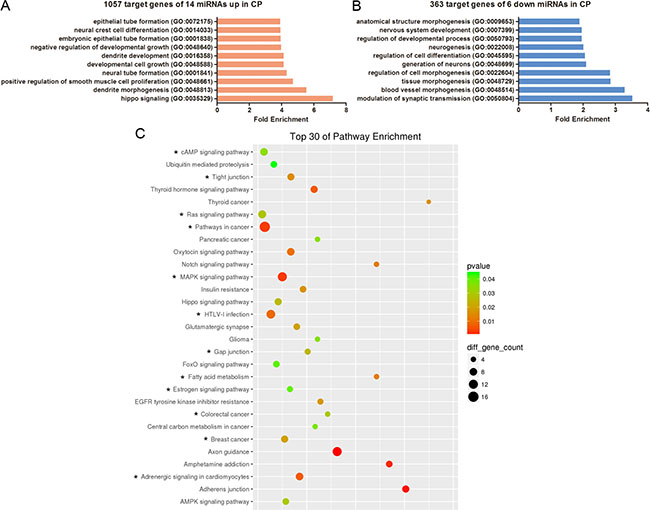
Figure 4: GO and KEGG pathway analyses show the associated function of the target genes of the miRNAs dysregulated in CP. (A) The top 10 enriched GO terms for the 1057 target genes of the 14 miRNAs upregulated in CP. (B) The top 10 enriched GO terms for the 363 target genes of the 6 miRNAs downregulated in CP. (C) Top 30 enriched pathways for the 363 target genes of the 6 miRNAs downregulated in CP. The enrichment P values were calculated using Fisher’s exact test. The term/pathway on the vertical axis was drawn according to the first letter of the pathway name in descending order. The horizontal axis represents the enrichment factor, i.e., (the number of dysregulated genes in a pathway/the total number of dysregulated gene)/(the number of genes in a pathway in the database/the total number of genes in the database). Top 30 enriched pathways were selected according to the enrichment factor value. The selection standards were the number of genes in a pathway ≥ 4 and p < 0.05. The different colours from green to red represent the p value. The different sizes of the round shapes represent the gene count number in a pathway. * indicates the pathway is similarly regulated in both CP and CLP.
Function analysis of the potential target genes of the miRNAs dysregulated in CLP
Additionally, we performed gene ontology (GO) and KEGG analysis of the predicted targets of the differentially expressed miRNAs in CLP, including 75 upregulated miRNAs yielding 3505 possible target genes and 34 downregulated miRNAs creating 1666 possible target genes. The top ten enriched GO terms are listed in Figure 5A and 5B, respectively. The analysis revealed that the potential target genes of the 75 miRNAs upregulated in CLP were associated with the regulation of axon extension during axon guidance, the semaphorin-plexin signalling pathway, the epidermal growth factor receptor signalling pathway, the regulation of axon extension, histone methylation and the extent of cell growth (Figure 5A). Conversely, the potential target genes of the 34 miRNAs downregulated in CLP were associated with glutamate secretion, the positive regulation of axon extension, multicellular organism growth, the extent of cell growth, neurotransmitter transport and the regulation of synaptic plasticity (Figure 5B). Pathway enrichment analysis indicated that the potential target genes of the miRNAs dysregulated in CLP were associated with specific pathways, including the thyroid hormone signalling pathway, the GnRH signalling pathway, the Hedgehog signalling pathway, and the longevity regulating pathway (Figure 5C, 5D).
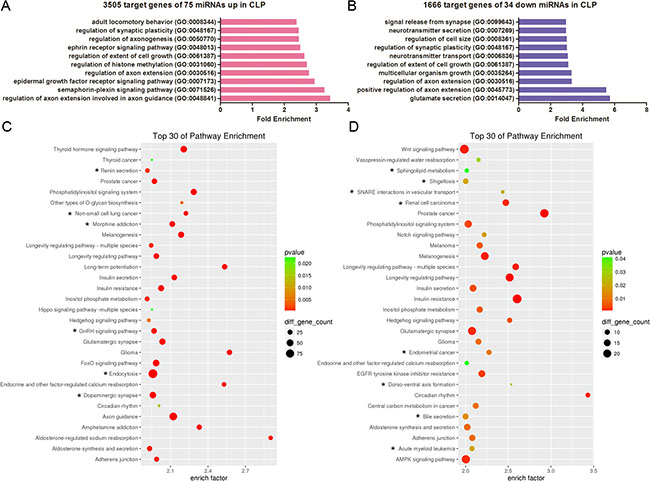
Figure 5: GO and KEGG pathway analyses show the associated function of the target genes of the miRNAs dysregulated in CLP. (A) The top 10 enriched GO terms for the 3505 target genes of the 75 miRNAs upregulated in CLP. (B) The top 10 enriched GO terms for the 1666 target genes of the 34 miRNAs downregulated in CLP. (C) Top 30 enriched pathways for the 3505 target genes of the 75 miRNAs upregulated in CLP. (D) Top 30 enriched pathways for the 1666 target genes of the 34 miRNAs downregulated in CLP. (C–D) The enrichment P values were calculated using Fisher’s exact test. The term/pathway on the vertical axis was drawn according to the first letter of the pathway name in descending order. The horizontal axis represents the enrichment factor, i.e., (the number of dysregulated genes in a pathway/the total number of dysregulated genes)/(the number of genes in a pathway in the database/the total number of genes in the database). The top 30 enriched pathways were selected according to the enrichment factor value. The selection standards were the number of genes in a pathway ≥ 4 and p < 0.05. The different colours from green to red represent the p value. The different sizes of the round shapes represent the gene count number in a pathway. * indicates the pathway is similarly regulated in both CLP and CP.
DISCUSSION
Plasma miRNAs are highly stabile under handling and storage conditions [12]. They play crucial roles in many diseases including cancer [13, 14] and respiratory diseases [15]. Nonsyndromic cleft palate and nonsyndromic cleft lip with cleft palate are two types of oral clefting that occur without other developmental syndromes. Research on the roles of differentially expressed plasma miRNAs in NSCP and NSCLP patients will improve our knowledge, diagnosis and management of the two diseases. This study, for the first time, has used microarray profiling to evaluate the differential expression of miRNAs in plasma samples from NSCP and NSCLP patients compared with healthy children. Six miRNAs, namely miR-340–5p, miR-877–5p, miR-3648, miR-1260a, miR-494–3p, and miR-1304–3p, were found to be differentially expressed in both the NSCP and NSCLP plasma samples.
Venn diagrams have been widely used to visualize the relationship between complex genetic data sets [16, 17]. Based on our miRNA microarray data, we found the intersection of differentially expressed miRNAs in CP and CLP. Using Bulge-Loop™ qRT-PCR analysis, we demonstrated that the upregulated and downregulated miRNAs were consistent with the results of the miRNA microarray assay. Therefore, we investigated the key genes and pathways associated with CP and/or CLP using bioinformatics analysis according to the microarray data. In mammals, miRNAs could regulate 30% of the protein-coding genes through posttranscriptional silencing; therefore, the dysregulation of miRNAs in NSCP or NSCLP patients could have a profound influence on various biological functions.
Based on the GO analysis, the predicted target genes of the upregulated and downregulated miRNAs in both CP and CLP mainly participated in glutamate secretion, aorta or palate development, cardiac muscle cell contraction, and the ephrin receptor signalling pathway. Examining the top 30 enriched pathways showed that the target genes were solely associated with several pathways, including the AGE-RAGE signalling pathway in diabetic complications, retrograde endocannabinoid signalling, signalling pathways regulating the pluripotency of stem cells, the adipocytokine signalling pathway, arrhythmogenic right ventricular cardiomyopathy (ARVC), cocaine addiction, dilated cardiomyopathy, gastric acid secretion, glycerolipid metabolism, glycosaminoglycan biosynthesis-chondroitin sulphate/dermatan sulphate, glycosaminoglycan biosynthesis-keratan sulphate, hypertrophic cardiomyopathy (HCM), the p53 signalling pathway and mucin type O-Glycan biosynthesis. Consistent with this prediction, cleft palate and cleft lip with cleft palate may be associated with a wide range of signalling molecules, including transforming growth factors (TGFs) [18], bone morphogenetic proteins (BMPs) [19], and fibroblast growth factors (FGFs) [20]. In addition, various developmental transcription factors belonging to the paired box (PAX) [21], distal-less homeobox (DLX) [22], msh homeobox (MSX) [23], and T-Box (TBX) gene families [24] are also involved in CP and CLP.
Recent studies suggest that isolated cleft palate only (CPO) has independent genetic causes and should be evaluated separately [25, 26]. Therefore, we analysed the predictive target genes of nonoverlapping miRNAs in CP and CLP using GO and KEGG pathway analysis. Interestingly, the top 10 enriched GO terms showed that Hippo signalling, dendrite morphogenesis, modulation of synaptic transmission and tissue morphogenesis were related to CP. Thirteen pathways of the top 30 enriched pathways were uniquely associated with CP including 2-oxocarboxylic acid metabolism, adrenergic signalling in cardiomyocytes, breast cancer, the cAMP signalling pathway, colorectal cancer, the oestrogen signalling pathway, fatty acid metabolism, gap junctions, HTLV-I infection, the MAPK signalling pathway, pathways in cancer, the ras signalling pathway, and tight junctions. In contrast, 14 pathways of the top 30 enriched pathways were only linked with CLP including dopaminergic synapses, endocytosis, the GnRH signalling pathway, morphine addiction, non-small cell lung cancer, renin secretion, acute myeloid leukaemia, bile secretion, dorso-ventral axis formation, endometrial cancer, renal cell carcinoma, shigellosis, SNARE interactions in vesicular transport, and Sphingolipid metabolism.
NSCP and NSCLP are developmental defects. The differentially expressed plasma miRNAs identified in the affected infants could be from their mother’s blood. Further elucidation of the sources of the plasma miRNAs in human tissues and their roles in the pathogenesis of cleft palate or cleft lip with cleft palate, particularly in palate development or the regulation of cranial neural crest (CNC) cells that give rise to craniofacial structures, needs to be further explored. In addition, larger samples are needed to perform receiver operating characteristic (ROC) curve analysis to prove that some of the children plasma microRNAs are promising biomarkers.
Taken together, based on the Bulge-Loop™ qRT-PCR analysis and miRNA microarray assay, we uncovered a differential plasma miRNA expression profile in NSCP and NSCLP patients compared with healthy children. Using GO and KEGG pathway analysis, we found distinct and overlapping biological processes or signalling pathways involved in CP and CLP. Further studies should examine the mechanism of the potential target genes, which may provide new avenues for future clinical prevention and therapy.
MATERIALS AND METHODS
Sample collection
The study protocol was approved by the Institutional Review Board of Nanjing Medical University (2014–10–16). The plasma samples were collected according to previously described methods [11]. Nonsyndromic cleft palate (NSCP) and nonsyndromic cleft lip with cleft palate (NSCLP) patients who underwent surgery and healthy children (normal face but who underwent surgery for hydrocele) participated in this study with their parent’s consent at the Department of Burns and Plastic Surgery, Nanjing Children’s Hospital Affiliated to Nanjing Medical University in Nanjing, China. All NSCP, NSCLP and healthy children were between 2 and 12 months old. The patient information is listed in Table 4. Briefly, peripheral blood was collected into EDTAK2 tubes (regular type), and then immediately centrifuged at 1000 g for 15 min. The supernatant plasma was transferred to RNase-free tubes and centrifuged at 12000 g for 10 min to pellet any remaining cellular debris. Aliquots of the supernatant were transferred to fresh tubes and immediately stored at –80°C.
Table 4: Patient characteristics
Group |
Age (m, months; d, days) |
Gender |
Sample use |
|---|---|---|---|
Control |
9m12d |
female |
Array |
Control |
3m30d |
male |
Array |
Control |
10m |
male |
Array |
Control |
6m |
female |
qRT-PCR |
Control |
9m |
female |
qRT-PCR |
Control |
12m |
female |
qRT-PCR |
Control |
3m |
male |
qRT-PCR |
Control |
9m |
male |
qRT-PCR |
Control |
3m |
male |
qRT-PCR |
Control |
6m |
male |
qRT-PCR |
Control |
5m |
male |
qRT-PCR |
CP |
3m |
female |
Array |
CP |
6m |
female |
Array |
CP |
5m |
male |
Array |
CP |
10m7d |
female |
qRT-PCR |
CP |
12m |
female |
qRT-PCR |
CP |
3m |
female |
qRT-PCR |
CP |
8m28d |
female |
qRT-PCR |
CP |
9m20d |
female |
qRT-PCR |
CP |
10m9d |
female |
qRT-PCR |
CP |
11m13d |
female |
qRT-PCR |
CP |
8m |
female |
qRT-PCR |
CP |
12m |
female |
qRT-PCR |
CP |
12m |
female |
qRT-PCR |
CLP |
7m30d |
male |
Array |
CLP |
4m |
male |
Array |
CLP |
4m21d |
male |
Array |
CLP |
2m22d |
female |
qRT-PCR |
CLP |
4m17d |
female |
qRT-PCR |
CLP |
12m |
female |
qRT-PCR |
CLP |
10m25d |
female |
qRT-PCR |
CLP |
12m |
female |
qRT-PCR |
CLP |
10m24d |
female |
qRT-PCR |
CLP |
5m |
female |
qRT-PCR |
CLP |
7m |
female |
qRT-PCR |
CLP |
12m |
female |
qRT-PCR |
CLP |
11m |
female |
qRT-PCR |
CLP |
3m21d |
female |
qRT-PCR |
CLP |
5m30d |
female |
qRT-PCR |
CLP |
4m12d |
male |
qRT-PCR |
CLP |
3m12d |
male |
qRT-PCR |
CLP |
4m23d |
male |
qRT-PCR |
CLP |
3m20d |
male |
qRT-PCR |
CLP |
2m10d |
male |
qRT-PCR |
CLP |
2m |
male |
qRT-PCR |
CLP |
9m29d |
male |
qRT-PCR |
CLP |
12m |
male |
qRT-PCR |
CLP |
12m |
male |
qRT-PCR |
CLP |
11m3d |
male |
qRT-PCR |
CLP |
3m |
male |
qRT-PCR |
CLP |
6m |
male |
qRT-PCR |
CLP |
9m10d |
male |
qRT-PCR |
CLP |
12m |
male |
qRT-PCR |
CLP |
11m |
male |
qRT-PCR |
CLP |
4m21d |
male |
qRT-PCR |
CLP |
3m30d |
male |
qRT-PCR |
CLP |
11m12d |
male |
qRT-PCR |
CP, cleft palate; CLP, cleft lip with palate.
Total RNA isolation from human plasma samples
Total RNA was isolated from 400 μl of human plasma samples using the mirVana PARIS kit (Ambion, Carlsbad, CA, USA) according to the manufacturer’s instructions. After infusing an equal volume of 2x denaturing solution to the plasma samples to inactivate RNases, the denatured samples were mixed with Synthetic Caenorhabditis elegans miRNA cel-miR-39 (GenePharma, Shanghai, China), to normalize the variation in RNA isolation from the different samples. RNA was eluted using 100 μl of elution solution.
Mature miRNA microarray analysis
Nine samples, which included three NSCP plasma samples (mixed as the CP group), three NSCLP plasma samples (mixed as the CLP group) and three normal plasma samples (mixed as the Control group), were analysed using Agilent human miRNA microarray chips (8*60K) v21.0 (ShanghaiBio Corporation, Shanghai, China). The raw data were normalized using the quantile algorithm in GeneSpring Software 12.6 (Agilent Technologies, Santa Clara, CA, USA). The differentially expressed miRNAs that showed a two-fold or greater change were screened. Venn diagrams were draw online (http://bioinformatics.psb.ugent.be/webtools/Venn/).
Validation of the microarray data using Bulge-Loop™ miRNA qRT-PCR
To confirm the microarray data, six selected miRNAs with two-fold or greater changes were further validated in samples from an additional 16 CP, 33 CLP and 8 healthy children using Bulge-Loop™ qRT-PCR according to the manufacturer’s protocol (RIBOBIO, Guangzhou, China) with SYBR green on an Applied Biosystems ViiA™ 7 Dx (Life Technologies, USA). The expression levels of the miRNAs were normalized to C. elegans control miRNA cel-39 using the 2(–△△Ct) method [27].
Statistical analysis
The validation results from the qRT-PCR analysis are displayed as the mean ± SD. Statistical significance was assessed using the Mann-Whitney U test in Graphpad Prism 6 (Graphpad software, CA, USA). A P < 0.05 was considered statistically significant.
GO and pathway enrichment analyses
The differentially expressed miRNAs were further analysed for predicted gene targets simultaneously using at least two of the following five databases: TARGETMINER, miRDB, microRNA, TarBase, and RNA22 through the ShanghaiBio Corporation (SBC) analysis system (http://sas.ebioservice.com). GO enrichment analyses were performed online (http://geneontology.org/). KEGG pathway enrichment analyses of the predicted targets of the differentially expressed miRNAs were performed according to previously described methods [11]. KEGG pathway enrichment analyses were performed by the ShanghaiBio Corporation (SBC) analysis system, which uses clusterProfiler data from R/bioconductor software (http://www.r-project.org and http://www.bioconductor.org/) with public databases that include NCBI Entrez Gene (http://www.ncbi.nlm.nih.gov/gene), GO (http://www.geneontology.org), KEGG (http://www.genome.jp/kegg), and Biocarta (http://www.biocarta.com). The enrichment P-values of both the GO and pathway enrichment analyses were calculated using the Fisher’s exact test [28], which was corrected using enrichment q-values (the false discovery rate) that were calculated using John Storey’s method [29].
ACKNOWLEDGMENTS
This study was supported by the National Natural Science Foundation of China (81501672), the Natural Science Foundation of Jiangsu Province (BK20140083), the Nanjing Medical Science and Technique Development Foundation (YKK15159), and the Nanjing Science and Technology project (201503047).
CONFLICTS OF INTEREST
The authors declare that they have no conflicts of interests.
Authors’ contributions
Jun Li planned the experiment and conducted the data analyses. Jingyun Li and Jijun Zou performed the sample preparation and validation of the specific plasma miRNAs. Qian Li and Ling Chen performed the bioinformatics analyses. Yanli Gao, Hui Yan, and Bei Zhou performed the statistical analyses. Jingyun Li and Jun Li wrote and edited the manuscript.
REFERENCES
1. Rahimov F, Jugessur A, Murray JC. Genetics of nonsyndromic orofacial clefts. Cleft Palate Craniofac J. 2012; 49:73–91. doi: 10.1597/10-178.
2. Tolarova MM, Cervenka J. Classification and birth prevalence of orofacial clefts. Am J Med Genet. 1998; 75:126–37.
3. Burg ML, Chai Y, Yao CA, Magee W, 3rd, Figueiredo JC. Epidemiology, Etiology, and Treatment of Isolated Cleft Palate. Front Physiol. 2016; 7:67. doi: 10.3389/fphys.2016.00067.
4. Sivertsen A, Wilcox AJ, Skjaerven R, Vindenes HA, Abyholm F, Harville E, Lie RT. Familial risk of oral clefts by morphological type and severity: population based cohort study of first degree relatives. BMJ. 2008; 336:432–4. doi: 10.1136/bmj.39458.563611.AE.
5. Leslie EJ, Marazita ML. Genetics of cleft lip and cleft palate. Am J Med Genet C Semin Med Genet. 2013; 163C:246–58. doi: 10.1002/ajmg.c.31381.
6. Peng HH, Chang NC, Chen KT, Lu JJ, Chang PY, Chang SC, Wu-Chou YH, Chou YT, Phang W, Cheng PJ. Nonsynonymous variants in MYH9 and ABCA4 are the most frequent risk loci associated with nonsyndromic orofacial cleft in Taiwanese population. BMC Med Genet. 2016; 17:59. doi:10.1186/s12881-016–0322–2.
7. Kondo S, Schutte BC, Richardson RJ, Bjork BC, Knight AS, Watanabe Y, Howard E, de Lima RL, Daack-Hirsch S, Sander A, McDonald-McGinn DM, Zackai EH, Lammer EJ, et al. Mutations in IRF6 cause Van der Woude and popliteal pterygium syndromes. Nat Genet. 2002; 32:285–9. doi: 10.1038/ng985.
8. Radhakrishna U. Small players with a big role: MicroRNAs in pathophysiology of cleft lip and palate. Indian J Hum Genet. 2012; 18:272–3. doi: 10.4103/0971-6866.107973.
9. Wang J, Bai Y, Li H, Greene SB, Klysik E, Yu W, Schwartz RJ, Williams TJ, Martin JF. MicroRNA-17–92, a direct Ap-2alpha transcriptional target, modulates T-box factor activity in orofacial clefting. PLoS Genet. 2013; 9:e1003785. doi: 10.1371/journal.pgen.1003785.
10. Warner DR, Mukhopadhyay P, Brock G, Webb CL, Michele Pisano M, Greene RM. MicroRNA expression profiling of the developing murine upper lip. Dev Growth Differ. 2014; 56:434–47. doi: 10.1111/dgd.12140.
11. Zou J, Li J, Li J, Ji C, Li Q, Guo X. Expression profile of plasma microRNAs in nonsyndromic cleft lip and their clinical significance as biomarkers. Biomed Pharmacother. 2016; 82:459–66. doi: 10.1016/j.biopha.2016.05.033.
12. Balzano F, Deiana M, Dei Giudici S, Oggian A, Baralla A, Pasella S, Mannu A, Pescatori M, Porcu B, Fanciulli G, Zinellu A, Carru C, Deiana L. miRNA Stability in Frozen Plasma Samples. Molecules. 2015; 20: 19030–40. doi: 10.3390/molecules201019030.
13. Li C, Li JF, Cai Q, Qiu QQ, Yan M, Liu BY, Zhu ZG. miRNA-199a-3p in plasma as a potential diagnostic biomarker for gastric cancer. Ann Surg Oncol. 2013; 20:S397–405. doi: 10.1245/s10434-012-2600-3.
14. Torres A, Torres K, Pesci A, Ceccaroni M, Paszkowski T, Cassandrini P, Zamboni G, Maciejewski R. Diagnostic and prognostic significance of miRNA signatures in tissues and plasma of endometrioid endometrial carcinoma patients. Int J Cancer. 2013; 132:1633–45. doi: 10.1002/ijc.27840.
15. Molina-Pinelo S, Suarez R, Pastor MD, Nogal A, Marquez-Martin E, Martin-Juan J, Carnero A, Paz-Ares L. Association between the miRNA signatures in plasma and bronchoalveolar fluid in respiratory pathologies. Dis Markers. 2012; 32:221–30. doi:10.3233/DMA-2011-0882.
16. Yang JJ, Kwon H, Lee JM. Complementary Characteristics of Correlation Patterns in Morphometric Correlation Networks of Cortical Thickness, Surface Area, and Gray Matter Volume. Sci Rep. 2016; 6:26682. doi: 10.1038/srep26682.
17. Kestler HA, Muller A, Gress TM, Buchholz M. Generalized Venn diagrams: a new method of visualizing complex genetic set relations. Bioinformatics. 2005; 21:1592–5. doi: 10.1093/bioinformatics/bti169.
18. Lane J, Yumoto K, Azhar M, Ninomiya-Tsuji J, Inagaki M, Hu Y, Deng CX, Kim J, Mishina Y, Kaartinen V. Tak1, Smad4 and Trim33 redundantly mediate TGF-beta3 signaling during palate development. Dev Biol. 2015; 398:231–41. doi:10.1016/j.ydbio.2014.12.006.
19. Cela P, Hampl M, Fu KK, Kunova Bosakova M, Krejci P, Richman JM, Buchtova M. MORN5 Expression during Craniofacial Development and Its Interaction with the BMP and TGFbeta Pathways. Front Physiol. 2016; 7:378. doi: 10.3389/fphys.2016.00378.
20. Wu W, Gu S, Sun C, He W, Xie X, Li X, Ye W, Qin C, Chen Y, Xiao J, Liu C. Altered FGF Signaling Pathways Impair Cell Proliferation and Elevation of Palate Shelves. PLoS One. 2015; 10:e0136951. doi:10.1371/journal.pone.0136951.
21. Sull JW, Liang KY, Hetmanski JB, Fallin MD, Ingersoll RG, Park J, Wu-Chou YH, Chen PK, Chong SS, Cheah F, Yeow V, Park BY, Jee SH, et al. Maternal transmission effects of the PAX genes among cleft case-parent trios from four populations. Eur J Hum Genet. 2009; 17:831–9. doi: 10.1038/ejhg.2008.250.
22. Wu D, Mandal S, Choi A, Anderson A, Prochazkova M, Perry H, Gil-Da-Silva-Lopes VL, Lao R, Wan E, Tang PL, Kwok PY, Klein O, Zhuan B, et al. DLX4 is associated with orofacial clefting and abnormal jaw development. Hum Mol Genet. 2015; 24:4340–52. doi:10.1093/hmg/ddv167.
23. Singh N, Gupta M, Trivedi CM, Singh MK, Li L, Epstein JA. Murine craniofacial development requires Hdac3-mediated repression of Msx gene expression. Dev Biol. 2013; 377: 333-44. doi:10.1016/j.ydbio.2013.03.008.
24. Funato N, Nakamura M, Richardson JA, Srivastava D, Yanagisawa H. Tbx1 regulates oral epithelial adhesion and palatal development. Hum Mol Genet. 2012; 21:2524–37. doi:10.1093/hmg/dds071.
25. Rahimov F, Marazita ML, Visel A, Cooper ME, Hitchler MJ, Rubini M, Domann FE, Govil M, Christensen K, Bille C, Melbye M, Jugessur A, Lie RT, et al. Disruption of an AP-2alpha binding site in an IRF6 enhancer is associated with cleft lip. Nat Genet. 2008; 40:1341–7. doi:10.1038/ng.242.
26. Jugessur A, Shi M, Gjessing HK, Lie RT, Wilcox AJ, Weinberg CR, Christensen K, Boyles AL, Daack-Hirsch S, Nguyen TT, Christiansen L, Lidral AC, Murray JC. Fetal genetic risk of isolated cleft lip only versus isolated cleft lip and palate:a subphenotype analysis using two population-based studies of orofacial clefts in Scandinavia. Birth Defects Res A Clin Mol Teratol. 2011; 91:85–92. doi: 10.1002/bdra.20747.
27. Livak KJ, Schmittgen TD. Analysis of relative gene expression data using real-time quantitative PCR and the 2(-Delta Delta C(T)) Method. Methods. 2001; 25:402–8. doi: 10.1006/meth.2001.1262.
28. Fisher RA. On the interpretation of x(2) from contingency tables, and the calculation of P. Journal of the Royal Statistical Society. 1922; 85:87–94. doi:10.2307/2340521.
29. Storey JD, Taylor JE, Siegmund D. Strong control, conservative point estimation and simultaneous conservative consistency of false discovery rates: a unified approach. Journal of the Royal Statistical Society. 2004; 66:187–205. doi: 10.1111/j.1467–9868.2004.00439.x.