
INTRODUCTION
Multiple myeloma(MM) is an incurable malignancy of plasma cells that accumulate in the bone marrow. MM strike males and females in elders and represent the second most common hematological cancer [1]. It is characterized by excessive production of heavy and light chain monoclonal immunoglobulin, as well as bone destruction [2, 3]. Currently there are several established risk factors: older age, meaning unknown monoclonal immunoglobulin hyperlipidemia (MGUS) and family history of lymphatic cancers [4, 5]. Some potential risk factors such as exposure to chemicals and radiation, chronic immune activation, are still under determination [6–8]. In recent years, more and more evidence show that obesity is a risk factor for the occurrence of MM [8]. As obesity accompanied with increased adipose tissue, that is not only an organ for energy savings, but also an endocrine organ that secretes adipokines. The adipokines takes part both in the metabolism, fat synthesis and degradation and regulation of human inflammatory response [9, 10]. One reason for obesity increase the risk of developing multiple myeloma may be associated with changes in adipokines levels.
Adipocytes are differentiated from mesenchymal stem cells and a major type of bone marrow stromal cells(BMSCs). Adipocytes are the primary components of adipose tissue and secret several adipokines. A number of researches have proved that changed levels of the adipokines secreted from adipose tissue is thought to be involved in the development of several types of cancer [8, 10, 11]. Leptin and adiponectin are two members of the adipokines and well-studies in association with tumors. In recent years, studies revealed that levels of leptin and adiponectin were changed in MM patients and other cancer [9, 10, 12–14].
Leptin is important for energy balance and metabolism, as well as adaptive immune function, receptors associated angiogenesis and hematopoietic process [14]. As reported, in fatty population with increased risk of cancer, the level of leptin usually significantly elevated, suggesting that leptin may also be involved in cancer development [15–17]. Previous studies also suggested that it protected cancer cells from chemotherapy agents induced apoptosis in vitro by reducing intracellular reactive oxygen species(ROS) [18]. Adiponectin is another member of adipokines secreted by fatty cells with hormone characteristics. Previous studies showed an inverse correlation between plasma concentration of adiponectin and incidence of breast, prostate, colorectal, and acute myeloid leukemia [9, 10, 13, 19]. Adiponectin is suggested to be a protective factor by exerting anti-inflammation, insulin-sensitizing, and anti-angiogenesis [20–22].
Although previous studies showed that certain kinds of adipokines were related to risk of myeloma, the characteristics of correlation and mechanism remain unclear. Therefore, in this study, we evaluated the levels of adipokines (leptin and adiponectin), determining the correlation between their disturbances and clinical characteristics in multiple myeloma, and investigated the possible underlying mechanisms between adipokines and multiple myeloma, and whether aberrant expression of adipokines could be served as a novel target for preventing myeloma chemo-resistance.
RESULTS
Adipokines levels in the serum of patients with multiple myeloma
28 patients with multiple myeloma and 28 control cases were allocated to measure serum adipokines levels. Distribution of study factors is presented in Table 1. BMI, which is associated with MM, was slightly lower among selected MM patients than among controls. There were 15 male and 13 female in the MM group, as well as the control group. The mean age of MM patients were 56 years, and it was 55 years in the control group. There were no significant difference among all of these baseline characteristics.
Table 1: selected characteristics of MM patients and matched controls
MM |
control |
|
|---|---|---|
cases |
28 |
28 |
M, n/F, n |
15/13 |
15/13 |
Age, mean (SD) |
56 ± 10 |
55 ± 12 |
BMI, mean (SD) |
22.79 ± 3.1 |
23.01 ±2.8 |
MM ISS stage, n(%) |
||
I |
5 (17.9%) |
|
II |
7 (25%) |
|
III |
16 (57.1%) |
Abbreviations: MM, multiple myeloma; M, male; F, female; BMI, body mass index; SD, standard deviation.
Levels of adipocytokines in MM and control
By using ELISA, we measured serum levels of adipocytokines, including leptin, adiponectin, resistin, and visfatin. As shown in Figure 1A, MM patients had higher levels of leptin than did controls (6.82 ± 3.09 vs. 2.91 ± 1.81; p <0.01). The level of adiponectin in MM patients was significantly lower than control group(5.79 ± 2.37 vs. 9.29 ± 3.45; p < 0.01. Figure 1B). However, there were no significant differences in levels of resistin(8.98 + 6.41 vs. 9.48 ± 6.18, p = 0.091. Figure 1C) and visfatin(8.35 + 5.06 vs. 7.74 ± 4.79 ng/ml, p = 0.819. Figure 1D) between MM and control groups (Table 2).
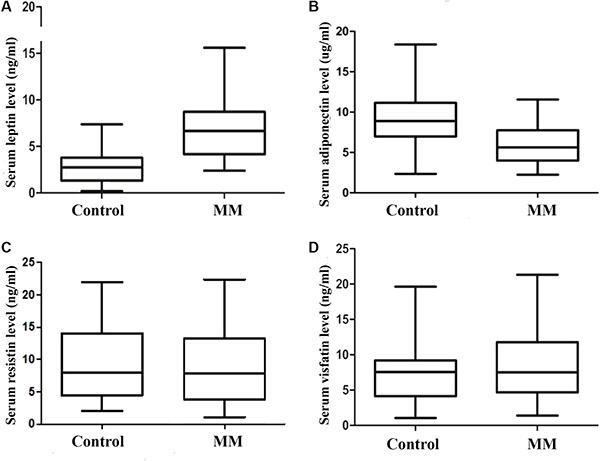
Figure 1: Serum adipocytokines levels in control group(n = 28) and MM group(n = 28). The level of leptin is significantly higher in MM group when compared with control group. (A) serum leptin level; (B) serum adiponectin level; (C) serum resistin level; (D) serum visfatin level).
Table 2: Serum adipocytokines levels in control group and MM patients
Mean + SD |
MM patients N = 28 |
control N = 28 |
P value |
|---|---|---|---|
Leptin (ng/ml) |
6.82 ± 3.09 |
2.91 ± 1.81 |
< 0.01 |
adiponectin (μg/ml) |
5.79 ± 2.37 |
9.29 ± 3.45 |
< 0.01 |
resistin (ng/ml) |
8.98 ± 6.41 |
9.48 ± 6.18 |
0.091 |
visfatin (ng/ml) |
8.35 ± 5.06 |
7.74 ± 4.79 |
0.819 |
Abbreviations: MM, multiple myeloma; SD, standard deviation.
Correlation between serum levels of leptin and adiponectin and clinical features
As shown in Tables 3 and 4, we observed inverse associations between MM clinical features and plasma levels of leptin and adiponectin. Consistent patterns of association were observed for leptin (p = 0.023) and adiponectin (p = 0.015), when the MM ISS stage was subdivided using the Stage I + II vs. Stage III.
Table 3: Correlation between serum leptin and adiponectin levels and clinical stage in MM patients
MM ISS stage |
Mean |
SD |
P value |
|
|---|---|---|---|---|
leptin |
Stage I + II |
5.34 |
1.9 |
0.023 |
Stage III |
7.93 |
3.38 |
||
adiponectin |
Stage I + II |
7.05 |
2.62 |
0.015 |
Stage III |
4.84 |
1.7 |
Abbreviations: MM, multiple myeloma; SD, standard deviation.
Table 4: Correlation between serum leptin and adiponectin levels and clinical parameters in MM patients
leptin |
adiponectin |
|||
|---|---|---|---|---|
Spearman r |
P value |
Spearman r |
P value |
|
IgG |
0.607 |
0.001 |
–0.575 |
0.001 |
MM cell % |
0.513 |
0.005 |
–0.065 |
0.741 |
ß2 MG |
0.572 |
0.01 |
–0.577 |
0.001 |
ESR |
0.374 |
0.05 |
–0.441 |
0.019 |
Serum albumin |
0.546 |
0.003 |
0.517 |
0.005 |
LDH |
–0.014 |
0.943 |
–0.179 |
0.362 |
Hb |
0.279 |
0.151 |
0.262 |
0.179 |
serum calcium |
–0.275 |
0.156 |
0.264 |
0.175 |
Abbreviations: MM, multiple myeloma; MG, microglobulin; ESR, Erythrocyte Sedimentation Rate; LDH, lactate dehydrogenase.
Pearson coefficient correlation showed a significant positive relation between leptin and IgG level, ER, bone marrow plasma cells % as well as ß2MG, but not the LDH, hemoglobin or Ca2+. Adiponetin level was inversely correlated with IgG level, ß2M and ER. Whereas, there were no significant differences in resistin level and visfatin level between MM patients and healthy individuals. Also we haven’t been able to find either a significant association between resistin level and MM prognostic biological parameters or a significant association between visfatin level and MM prognostic biological parameters (Table 4).
Generation of human adipocytes in vitro
We have found adipokines levels were associated with clinical characteristics in multiple myeloma patients. Because bone marrow cavity is filled with adipocytes and their numbers is strongly correlated with age, in this part, we investigate the effect of adipocytes on the biological behavior of multiple myeloma.
3T3-L1 cells and isolated human MSCs from iliac crest bone marrow aspirates of 6 healthy volunteers were later differentiated into adipocytes by culturing them in adipocyte medium for nearly 2 weeks. During the adipocyte-differentiation culture period, more and more 3T3-L1 cells or MSCs showed an accumulation of multiple lipid droplets. 80%–90% of the 3T3-L1 cells were differentiated into adipocytes while 20%–30% of the MSCs were differentiated into adipocytes. Both of the two kinds of mature adipocytes were detected with Oil Red stain (Figure 2). The generated mature adipocytes were further purified for the following experiments.
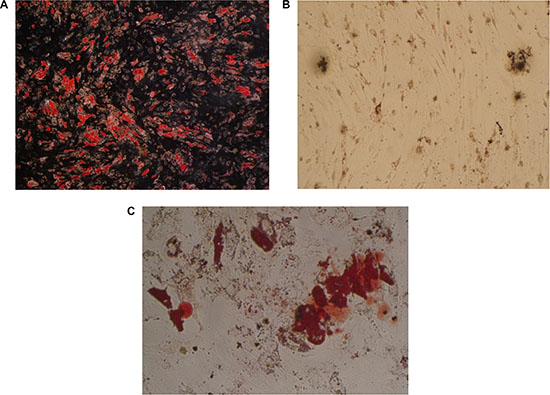
Figure 2: Detection of human adipocytes in vitro by oil red statin. (A) mature fat cells differentiated from 3T3-L1 cells; (B) undifferentiated mesenchymal stem cells; (C) mature fat cells differentiated from mesenchymal stem cells).
Level of leptin released by the 3T3-L1 and MSCs generated mature adipocytes
The concentrations of leptin in the culture supernatant of both adipocytes were tested by ELISA. The levels of leptin in 3T3-L1 cells and MSCs differentiated adipocytes were 0.88 ± 0.17 ng/ml and 1.52 ± 0.12 ng/ml, respectively.
Adipocytes promotes multiple myeloma cells proliferation via leptin and its receptor
To investigate whether adipocytes have a beneficial role in myeloma cell proliferation, we cultured myeloma cells including RPMI8226, ARH-77, U266, NCI-H929 with or without adipocytes for three days. The proliferation rates(PR) were tested by CFSE staining. The results showed that the proliferation rates were significantly higher in co-culture systems, compared with control. The PRs for ARH, NCI-H929, RPMI8226 and U266 co-culture cells were 1.28 ± 0.07, 2.19 ± 0.18, 1.26 ± 0.09, and 1.48 ± 0.07, respectively. These data indicate that adipocytes stimulating proliferation in myeloma cells.
As leptin level was significantly increased in myeloma patients, we tried to determine whether the pro-proliferation effect of adipocytes was through leptin or not. Anti-leptin receptor antibody was administrated in co-culture system of NCI-H929 + adipocytes and U266 + adipocytes, and the growth of myeloma cells was suppressed (Figure 3).
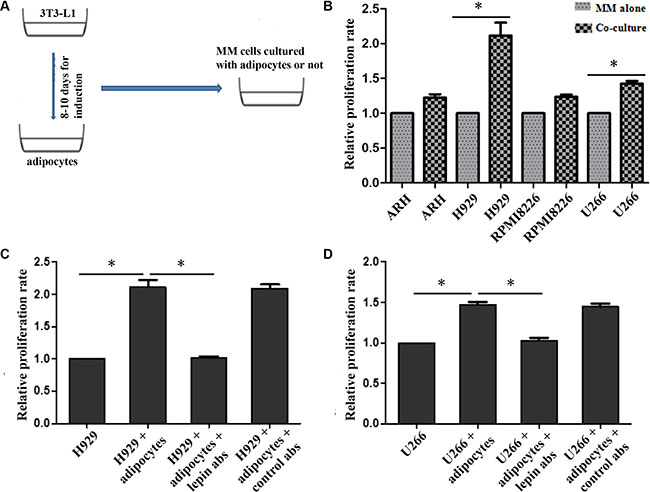
Figure 3: Proliferation of MM cells when co-cultured with adipocytes. The proliferations of MM cells are increased when co-cultured with adipocytes, and H929 and U266 are most significant (B). However, this pro-proliferation effect is significantly inhibited after adding leptin receptor antibodies both in H929 (C) and U266 cells (D). (A) overall process of co-culture system; B, relative proliferation rates of ARH, H929, RPMI8226, and U266 cells(n ≥ 3); C and D, proliferation rates of H929 and U266 were impaired when adding leptin receptor antibodies to the culture systems. p <0.05 ).
Adipocytes protects multiple myeloma cells from apoptosis induced by chemotherapy
The above data suggested that the proliferation of myeloma could be affected by leptin, so we wondered whether the anti-tumor effect of chemotherapy could be influenced by adipocytes secreted leptin. Bortezomib and dexamethasone, two common chemotherapeutic agents, were added into U266 and NCI-H929 cells. The IC50 values were calculated based on the CCK-8 tests (Table 5). When co-cultured with adipocytes, the tumor-killing effect of 7nM bortezomib was decreased in U266 cells, as well as 30uM dexamethasone. Similar results were observed in H929 cells (Figure 4).
Table 5: IC50 values of Bortezomib and dexamthasone in U266 and NCI-H929
Cell line |
Bortezomib |
Dexamthasone |
|---|---|---|
U266 |
7 nM |
30 μM |
NCI-H929 |
3 nM |
25 μM |
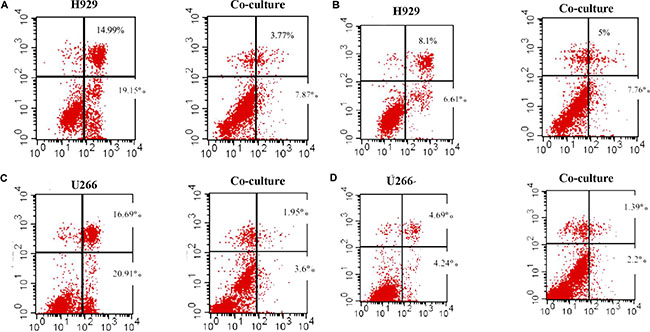
Figure 4: Adipocytes protects MM cells from apoptosis when cultured together. The apoptosis of MM cells is detected by Flow cytometry. The percentages of apoptotic cells are reduced in co-culture condition when adding bortezomib and dexamethasone. (A) bortezomib treatment in H929 cells; (B) dexamethasone treatment in H929 cells; (C) bortezomib treatment in U266 cells; (D) dexamethasone treatment in U266 cells)
Adipocytes increase the expression of proliferation and anti-apoptosis proteins
To explore the reasons for increasing proliferation and inhibiting apoptosis when myeloma cells were co-cultured with adipotcytes, the expressions of cell cycle, proliferation and apoptosis related proteins were measured. The data showed that the percentage of U266 cells in G1 phase decreased from 58.16% to 44.46%, along with S phase increased from 27.65% to 46.64%. The same trend was also found in H929 cells with the G1 phase declined from 38.3% to 32.9%, along with S phase elevated from 48.32% to 63.38%. The expression of cyclinD1, phosphorylated AKT and STAT3 proteins in myeloma cells were increased when co-cultured with adipocytes, whereas the percentage of phosphorylated proteins decreased when using anti-lepin receptor antibody(Figure 5). We also tested the changes of apoptosis related proteins in co-culture system, and found increased expression of Bcl-2 and decreased expression of caspase-3 (Figure 5).
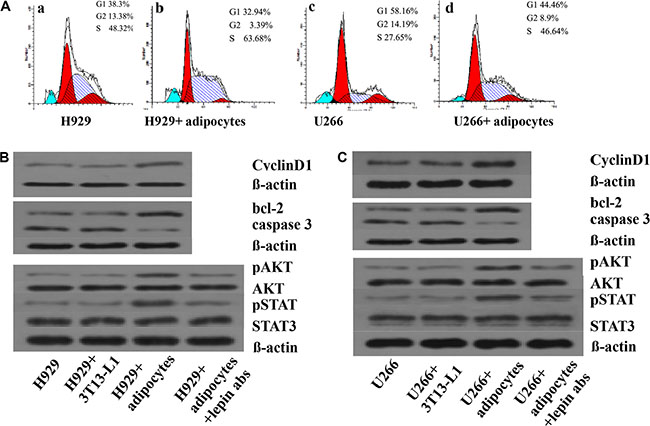
Figure 5: Adipocytes influence the cell cycle and protein expressions in MM cells. The percentages of MM cells in different phases of cell cycle are measured by Folw cytometry. In Figure 5A-a and 5A-c, the MM cells are served as controls. In Figure 5A-b and 5A- d, the MM cells are co-cultured with adipocytes. The percentages of cells in S phase are increased in 5A-b and 5A-d. Next, the expression of proteins including CyclinD1, bcl-2, caspase 3, pAKT, AKT, pSTAT, STAT3, and beta-actin are detected by Western blotting.(A) percentages of cells in S phase increased in co-culture system; (B) levels of proliferation associated proteins up-regulated in H929 cells; (C) levels of proliferation or apoptosis associated proteins up-regulated in U266 cells. When adding leptin antibodies to the co-culture system, the levels of proliferation associated proteins decreased.
Leptin promotes proliferation of multiple myeloma cells trough activating JAK/STAT-PI3K/AKT pathway
As illustrated in Figure 6, leptin treatment stimulated the growth of U266 and 929 cells in a time-dependent manner, but not a dose-dependent manner. Leptin stimulated the growth of both cells most at the concentration of 50ng/ml. AKT phosphorylation was increased to peak at 1h after treatment, while the AKT protein expression was not changed. STAT3 phosphorylation was increased to peak at 6h of treatment and the increase was not due to the increased STAT3 protein expression. LY294002 specifically inhibited the phosphorylation of AKT, without affecting the expression of AKT or level of phosphorylated STAT3. Treatment with AG490, inhibitor of JAK/STAT, blocked leptin-induced hyperphosphorylation of both ERK and AKT. Simultaneous treatment with leptin and AG490 could not restore the level of phosphorylation of STAT3 and AKT. These data suggest that activation of JAK/STAT is upstream of the activation of AKT pathway. Both AG490 and LY2904002 inhibited leptin-induced proliferation of MM cells (Figure 7).
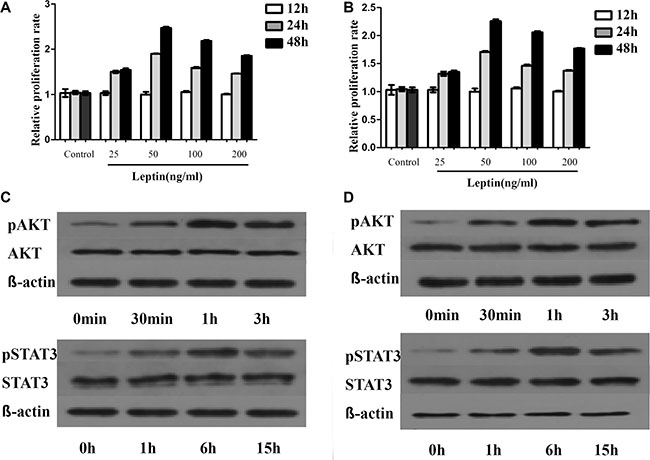
Figure 6: Leptin promotes MM cells proliferation by regulating phosphorylation of proliferation associated proteins. The proliferation of MM cells is dependent on dose but not time. The most significant increase in proliferation is observed at 50ng/ml of leptin. This dose of leptin is used for the following experiments. (A) proliferation rates of H929 at different times with various concentrations of leptin; (B) proliferation rates of U266 at different times with varied concentrations of leptin; (C) levels of phosphorylated AKT and STAT3 at different time points in H929 cells treated with 50 ng/ml leptin; (D) levels of phosphorylated AKT and STAT3 at different time points in U266 cells treated with 50 ng/ml leptin)
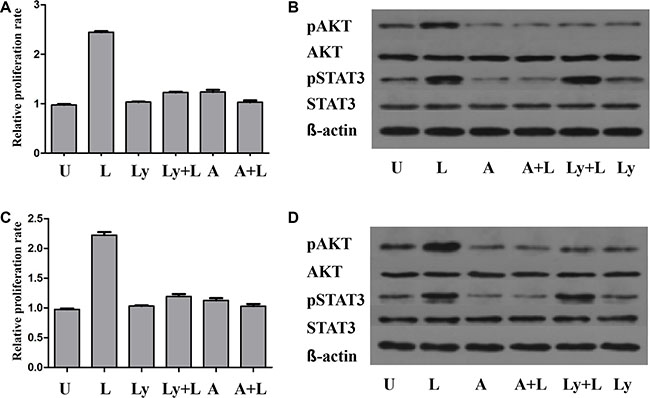
Figure 7: The pro-proliferation effect of leptin is influenced by the JAK/STAT-PI3K/AKT pathway. The proliferation of MM cells is significantly increased when treated with leptin. This effect of leptin is suppressed by either LY294002 or AG490, along with decreased level of pAKT. The levels of pSTAT3 are reduced in the presence of AG490, but not LY294002. (A) proliferation rates of H929 cells under different treatments; (B) levels of phosphorylated AKT and STAT3 in H929 cells under different treatments; (C) proliferation rates of U266 cells under different treatments; (D) levels of phosphorylated AKT and STAT3 in U266 cells under different treatments. p, phosphorylated; U, untreated; L, leptin; A, JAK/STAT inhibitor AG490; LY, PI3K inhibitor LY294002).
DISCUSSION
The current study proposed that adipokines were dys-regulated and participant in cancer development and chemo-resistance focusing on MM. We have identified that the level of leptin is increased and adiponectin is decreased in newly diagnosed myeloma compared to healthy controls. When co-culturing with adipocytes, the proliferation of myeloma cells was increased and the anti-tumor efficacy of chemotherapy drugs was reduced, associated with up-regulation of cell cycle and anti-apoptosis proteins via leptin. Furthermore, we found that JAK/STAT-PI3K/AKT pathway should be responsible for the pro-tumor effects of leptin. These findings are in agreement with the results obtained by other researchers [16, 23].
Elevated level of leptin can be a factor for fostering development and progression of tumors as it has the characteristics of mitogenic, proinflammatory, antiapoptotic, and proangiogenic [16, 24]. Few studies [11, 17, 24–26] have investigated the effects of leptin in hematological tumors and found that leptin modestly promotes proliferation of myeloma cell lines, and reduces chemotherapy induced apoptosis in myeloma cell lines, which are in accordance with our results. In addition, Leptin was correlated with ISS stage in patients with multiple myeloma. Moschovi et al. [27] showed that leptin levels were higher at diagnosis of multiple myeloma when compared with controls.
A prospective study revealed that low level of adiponectin was associated with high risk of colon cancer [28] and breast cancer [29]. We also found a decreased expression of adiponectin in newly diagnosed multiple myeloma patients compared to healthy controls. And its level further decreased in patients with advanced stage of disease. Adiponetin level was inversely correlated with IgG level, ß2M and ER. A possible explanation could be due to a possible protective effect of adiponectin against myeloma. These results were similar with the findings of Dalamaga et. al. [17] who also reported that low level of adiponectin could be a risk factor of multiple myeloma.
We used 3T3-L1 differentiated mature adipocytes to study the impact of leptin on the biological behaviors of multiple myeloma cells. We found that mature adipocytes could directly stimulate proliferation, accelerate cell cycle, and up-regulate cell cycle related proteins in multiple myeloma cells when cultured together. Several studies [17, 25, 26] have revealed that adipocytes secreted leptin could help tumor cells to proliferate, chemo-resistant, and metastasis via activating pro-tumor pathways. After adding anti-leptin related receptor antibodies, the proliferation of myeloma cells was inhibited, indicating leptin and its receptors were responsible for the pro-tumor effect of adipocytes. A few studies showed that adipocytes could protect myeloma cells from chemotherapy induced apoptosis by increasing expression of Bcl-2 and Pim-2 protein [30]. This was in accordance with our results that co-culture with adipocytes could reduce apoptosis by increasing Bcl-2 expression and inhibiting activation of caspase-3.
In order to well understand how leptin exert its role in promoting cancer, we treated myeloma cells with recombinant leptin at several concentrations and times. The results exhibited that leptin treatment stimulated the growth of U266 and H929 cells in a time-dependent manner, but not a dose-dependent manner. Leptin stimulated the growth of both myeloma cells via increasing AKT and STAT3 phosphorylation, without changing expression of AKT and STAT3. LY294002 specifically inhibited the phosphorylation of AKT, without affecting the expression of AKT or level of phosphorylated STAT3. Treatment with AG490 blocked leptin-induced hyperphosphorylation of both ERK and AKT. Simultaneous treatment with leptin and AG490 could not restore the level of phosphorylation of STAT3 and AKT. These data suggest that leptin stimulated MM cell growth through activating JAK/STAT-PI3K/AKT pathway.
MATERIALS AND METHODS
Study patients
A total of 28 patients with newly diagnosed disease were included from hematology department, Union hospital. The serum concentrations of adipokines including leptin, adiponectin, resistin, and visfatin were compared to those measured in 28 age- and sex- matched healthy volunteers. Plasma samples were taken immediately after diagnosis. The diagnostic criteria, clinical characteristics of myeloma patients have been detailed previously [1, 31]. All subjects provided informed consent and the study protocol was approved by the Ethics Committee of the Tongji Medical college, Huazhong University of Science & Technology.
Determination of serum and supernatants adipokine concentrations
The plasma levels of leptin, adiponectin, resistin, and visfatin were detected by the enzyme-linked immunosorbent assay (ELISA) kit(Elabscience, Inc.). The supernatants collected from cell culture media of myeloma or adipocytes in serum-free medium for 12, 24, 48 hours. The concentration of leptin in conditioned media were tested by ELISA kit(Elabscience, Inc.). All measurements were performed according to the instructions of the manufactures.
Cell culture
RPMI8226, ARH-77, U266, NCI-H929 and 3T3-L1 cells were purchased from American Type Culture Collection (ATCC). Primary MSCs were isolated from BM aspirates of healthy control volunteers using anti-CD138 antibody coated magnetic beads (Miltenyi Biotec, Inc.). Cells were cultured in conditioned medium with 10% fetal bovine serum (FBS) according to the ATCC cell culture suggestion. Multiple myeloma cells were grown in RPMI-medium containing 2 mmol⁄L glutamine, 20% FCS, 100 U⁄mL penicillin and 0.1 mg⁄mL streptomycin.
Generation of mature adipocytes in vitro
As previously reported, the MSCs were prepared using the BM cells from human fetal femoral bones[32]. MSCs were identified by the flow cytometry, and cultured in adipocyte medium for 2 weeks to get mature adipocytes. The adipocyte precursor (pre-adipocyte) cell line 3T3-L1 cells were also used to generate mature adipocytes. After differentiation, these cells were fixed with 4.0% paraformaldehyde, stained with red oil and observed using microscopy as previously reported [33].
Co-cultures of MM cells and mature adipocytes
3T3-L1 cells were seeded at the bottom of 6 well plates, and induced to mature adipocytes as mentioned above. Abandon culture medium when the differentiation rate was among 80% to 90%, and washed three times gently with PBS. The multiple myeloma RPMI8226, ARH77, U266, and H929 cells were adjusted to the appropriate density using serum-free RPMI1640 medium. MM cell suspension was added to the mature adipocytes, and myeloma cells without adipocytes were used as control group. In some experiments dexamethasone or bortezomib was added for 12, 24 and 48 hours.
Proliferation assay by CCK-8
Myeloma cells(1×10⁵/ml) were seeded in 96 culture wells for different interventions. After 12, 24, and 48 hours of culture, the proliferation assay was performed using CCK-8, according to the manufacturer’s insrtuctions.
Apoptosis assay
After treating cells with specific agents for 12, 24, and 48 hours, an annexin V-binding assay was performed to measure proportion of cell apoptosis by using a BD flow cytometer, accorinding to the manufacturer’s insrtuctions.
Western blot analysis
After leptin or chemotherapy treatment, multiple myeloma cells were collected and lysised for the following experiments. Briefly, sodium dodecyl sulfate-polyacrylamide gel electrophoresis (SDS-PAGE) system was used to separate proteins from cell lysates. Cell proteins were next transferred to a nitrocellulose membrane, and immunoblotted with antibodies against CyclinD1, caspase 3, Bcl-2 and phosphorylated (p) or non-phosphorylated STAT3 and AKT. β-actin protein levels were used to serve as a loading control.
Statistical analysis
Statistical analysis was carried out using SPSS 14.0 for Windows software. Variables were expressed as mean ± standard deviation (SD). Differences between groups were analyzed by an unpaired t test. The correlation coefficients between two variable parameters were determined by Pearson correlation test. Significance was assigned for P values as significant where P < 0.05.
CONCLUSIONS
In conclusion, elevated leptin level was found in newly diagnosed MM. Our study demonstrate that up-regulated leptin could stimulate proliferation and reduce the anti-tumor effect of chemotherapy in multiple myeloma possibly via activating AKT and STAT3 pathways, and leptin might be one of the potential therapeutic targets for treating myeloma.
ACKNOWLEDGMENTS
We thank the members at the Collaborative Innovation Center of Hematology, China. for their assistance with statistical analysis.
CONFLICTS OF INTEREST
The authors declare no conflicts of interest.
FINANCIAL SUPPORT
No financial support was received for this study.
REFERENCES
1. Kyle RA, Rajkumar SV. Criteria for diagnosis, staging, risk stratification and response assessment of multiple myeloma. Leukemia. 2009; 23:3–9. doi: 10.1038/leu.2008.291.
2. Gorgun GT, Whitehill G, Anderson JL, Hideshima T, Maguire C, Laubach J, Raje N, Munshi NC, Richardson PG, Anderson KC. Tumor-promoting immune-suppressive myeloid-derived suppressor cells in the multiple myeloma microenvironment in humans. Blood. 2013; 121:2975–87. doi: 10.1182/blood-2012-08-448548.
3. Fowler JA, Lwin ST, Drake MT, Edwards JR, Kyle RA, Mundy GR, Edwards CM. Host-derived adiponectin is tumor-suppressive and a novel therapeutic target for multiple myeloma and the associated bone disease. Blood. 2011; 118:5872–82. doi: 10.1182/blood-2011-01-330407.
4. Matsui W, Wang Q, Barber JP, Brennan S, Smith BD, Borrello I, McNiece I, Lin L, Ambinder RF, Peacock C, Watkins DN, Huff CA, Jones RJ. Clonogenic multiple myeloma progenitors, stem cell properties, and drug resistance. Cancer Res. 2008; 68:190–7. doi: 10.1158/0008-5472.CAN-07-3096.
5. Chapman MA, Lawrence MS, Keats JJ, Cibulskis K, Sougnez C, Schinzel AC, Harview CL, Brunet JP, Ahmann GJ, Adli M, Anderson KC, Ardlie KG, Auclair D, et al. Initial genome sequencing and analysis of multiple myeloma. Nature. 2011; 471:467–72. doi: 10.1038/nature09837.
6. Butler JS, Malhotra K, Patel A, Sewell MD, Benton A, Kyriakou C, Molloy S. Pathologic sternal involvement is a potential risk factor for severe sagittal plane deformity in multiple myeloma with concomitant thoracic fractures. Spine J. 2015; 15:2503–8. doi: 10.1016/j.spinee.2015.09.031.
7. Kang MG, Won EJ, Choi HW, Kim HR, Choi HJ, Park HR, Shin JH, Suh SP, Ryang DW, Shin MG. Serum parathyroid hormone is a new potential risk factor in multiple myeloma. Biomed Res Int. 2014; 2014:804182. doi: 10.1155/2014/804182.
8. De Pergola G, Silvestris F. Obesity as a major risk factor for cancer. J Obes. 2013; 2013:291546. doi: 10.1155/2013/291546.
9. Gunter MJ, Wang T, Cushman M, Xue X, Wassertheil-Smoller S, Strickler HD, Rohan TE, Manson JE, McTiernan A, Kaplan RC, Scherer PE, Chlebowski RT, Snetselaar L, et al. Circulating Adipokines and Inflammatory Markers and Postmenopausal Breast Cancer Risk. J Natl Cancer Inst. 2015; 107. doi: 10.1093/jnci/djv169.
10. Booth A, Magnuson A, Fouts J, Foster M. Adipose tissue, obesity and adipokines: role in cancer promotion. Horm Mol Biol Clin Investig. 2015; 21:57–74. doi: 10.1515/hmbci-2014-0037.
11. Liu Z, Xu J, He J, Liu H, Lin P, Wan X, Navone NM, Tong Q, Kwak LW, Orlowski RZ, Yang J. Mature adipocytes in bone marrow protect myeloma cells against chemotherapy through autophagy activation. Oncotarget. 2015; 6:34329–41. doi: 10.18632/oncotarget.6020.
12. Dranka-Bojarowska D, Lekstan A, Olakowski M, Jablonska B, Lewinski A, Musialski P, Sobczyk W, Kapalka A, Lampe P. The assessment of serum concentration of adiponectin, leptin and serum carbohydrate antigen-19.9 in patients with pancreatic cancer and chronic pancreatitis. J Physiol Pharmacol. 2015; 66:653–63. doi:
13. Gong TT, Wu QJ, Wang YL, Ma XX. Circulating adiponectin, leptin and adiponectin-leptin ratio and endometrial cancer risk: Evidence from a meta-analysis of epidemiologic studies. Int J Cancer. 2015; 137:1967–78. doi: 10.1002/ijc.29561.
14. Howard JM, Cathcart MC, Healy L, Beddy P, Muldoon C, Pidgeon GP, Reynolds JV. Leptin and adiponectin receptor expression in oesophageal cancer. Br J Surg. 2014; 101:643–52. doi: 10.1002/bjs.9469.
15. Nalabolu MR, Palasamudram K, Jamil K. Adiponectin and leptin molecular actions and clinical significance in breast cancer. Int J Hematol Oncol Stem Cell Res. 2014; 8:31–40. doi:
16. Hofmann JN, Liao LM, Pollak MN, Wang Y, Pfeiffer RM, Baris D, Andreotti G, Lan Q, Landgren O, Rothman N, Purdue MP. A prospective study of circulating adipokine levels and risk of multiple myeloma. Blood. 2012; 120:4418–20. doi: 10.1182/blood-2012-06-438606.
17. Dalamaga M, Karmaniolas K, Panagiotou A, Hsi A, Chamberland J, Dimas C, Lekka A, Mantzoros CS. Low circulating adiponectin and resistin, but not leptin, levels are associated with multiple myeloma risk: a case-control study. Cancer Causes Control. 2009; 20:193–9. doi: 10.1007/s10552-008-9233-7.
18. Buldak RJ, Pilc-Gumula K, Buldak L, Witkowska D, Kukla M, Polaniak R, Zwirska-Korczala K. Effects of ghrelin, leptin and melatonin on the levels of reactive oxygen species, antioxidant enzyme activity and viability of the HCT 116 human colorectal carcinoma cell line. Mol Med Rep. 2015; 12:2275–82. doi: 10.3892/mmr.2015.3599.
19. Johrer K, Ploner C, Thangavadivel S, Wuggenig P, Greil R. Adipocyte-derived players in hematologic tumors: useful novel targets? Expert Opin Biol Ther. 2015; 15:61–77. doi: 10.1517/14712598.2015.970632.
20. Ehsan M, Singh KK, Lovren F, Pan Y, Quan A, Mantella LE, Sandhu P, Teoh H, Al-Omran M, Verma S. Adiponectin limits monocytic microparticle-induced endothelial activation by modulation of the AMPK, Akt and NFkappaB signaling pathways. Atherosclerosis. 2016; 245:1–11. doi: 10.1016/j.atherosclerosis.2015.11.024.
21. Shrestha A, Nepal S, Kim MJ, Chang JH, Kim SH, Jeong GS, Jeong CH, Park GH, Jung S, Lim J, Cho E, Lee S, Park PH. Critical Role of AMPK/FoxO3A Axis in Globular Adiponectin-Induced Cell Cycle Arrest and Apoptosis in Cancer Cells. J Cell Physiol. 2016; 231: 357–69. doi: 10.1002/jcp.25080.
22. Medina EA, Oberheu K, Polusani SR, Ortega V, Velagaleti GV, Oyajobi BO. PKA/AMPK signaling in relation to adiponectin's antiproliferative effect on multiple myeloma cells. Leukemia. 2014; 28:2080–9. doi: 10.1038/leu.2014.112.
23. Esheba NE, Shahba A, El Shora O. Assessment of leptin and resistin levels in non-obese multiple myeloma patients and their relation with Ig level and disease stage. J Egypt Natl Canc Inst. 2014; 26:61–6. doi: 10.1016/j.jnci.2014.02.002.
24. Reseland JE, Reppe S, Olstad OK, Hjorth-Hansen H, Brenne AT, Syversen U, Waage A, Iversen PO. Abnormal adipokine levels and leptin-induced changes in gene expression profiles in multiple myeloma. Eur J Haematol. 2009; 83:460–70. doi: 10.1111/j.1600-0609.2009.01311.x.
25. Pamuk GE, Demir M, Harmandar F, Yesil Y, Turgut B, Vural O. Leptin and resistin levels in serum of patients with hematologic malignancies: correlation with clinical characteristics. Exp Oncol. 2006; 28:241–4. doi:
26. Alexandrakis MG, Passam FH, Sfiridaki A, Pappa CA, Moschandrea JA, Kandidakis E, Tsirakis G, Kyriakou DS. Serum levels of leptin in multiple myeloma patients and its relation to angiogenic and inflammatory cytokines. Int J Biol Markers. 2004; 19:52–7. doi:
27. Moschovi M, Trimis G, Vounatsou M, Katsibardi K, Margeli A, Damianos A, Chrousos G, Papassotiriou I. Serial plasma concentrations of adiponectin, leptin, and resistin during therapy in children with acute lymphoblastic leukemia. J Pediatr Hematol Oncol. 2010; 32:e8–13. doi: 10.1097/MPH.0b013e3181b8a50c.
28. Wei EK, Giovannucci E, Fuchs CS, Willett WC, Mantzoros CS. Low plasma adiponectin levels and risk of colorectal cancer in men: a prospective study. J Natl Cancer Inst. 2005; 97:1688–94. doi: 10.1093/jnci/dji376.
29. Tworoger SS, Eliassen AH, Kelesidis T, Colditz GA, Willett WC, Mantzoros CS, Hankinson SE. Plasma adiponectin concentrations and risk of incident breast cancer. J Clin Endocrinol Metab. 2007; 92:1510–6. doi: 10.1210/jc.2006-1975.
30. Behan JW, Yun JP, Proektor MP, Ehsanipour EA, Arutyunyan A, Moses AS, Avramis VI, Louie SG, Butturini A, Heisterkamp N, Mittelman SD. Adipocytes impair leukemia treatment in mice. Cancer Res. 2009; 69:7867–74. doi: 10.1158/0008-5472.CAN-09-0800.
31. Rajkumar SV. Evolving diagnostic criteria for multiple myeloma. Hematology Am Soc Hematol Educ Program. 2015; 2015:272–8. doi: 10.1182/asheducation-2015.1.272.
32. Garcia-Alvarez F, Alegre-Aguaron E, Desportes P, Royo-Canas M, Castiella T, Larrad L, Martinez-Lorenzo MJ. Chondrogenic differentiation in femoral bone marrow-derived mesenchymal cells (MSC) from elderly patients suffering osteoarthritis or femoral fracture. Arch Gerontol Geriatr. 2011; 52:239–42. doi: 10.1016/j.archger.2010. 03.026.
33. Kim NH, Choi SK, Kim SJ, Moon PD, Lim HS, Choi IY, Na HJ, An HJ, Myung NY, Jeong HJ, Um JY, Hong SH, Kim HM. Green tea seed oil reduces weight gain in C57BL/6J mice and influences adipocyte differentiation by suppressing peroxisome proliferator-activated receptor-gamma. Pflugers Arch. 2008; 457: 293-302. doi: 10.1007/s00424-008-0537-y.