
INTRODUCTION
Chronic lymphocytic leukemia (CLL) is a heterogeneous disease with highly variable clinical manifestations, ranging from asymptomatic at the time of diagnosis to a progressive symptomatic disease that is poorly responsive to the common immuno-chemotherapeutic regimens [1–2]. Genomic sequencing studies have revealed a number of recurrently mutated genes in CLL [3–5]. Among them, mutations of the NOTCH1 gene are found at diagnosis with a variable incidence depending on the method used, ranging from 7% to 22% of CLL cases [6–10], and up to 20-30% in chemo-refractory disease and cases transformed to the Richter syndrome, respectively [11–14]. Moreover, a greater burden of NOTCH1 mutations (NOTCH1mut) has been reported in CLL patient subgroups defined by trisomy 12 and an unmutated IGHV gene status [8, 15–16]. Some studies have suggested that NOTCH1 mutated cases exhibit adverse prognostic features with a shorter time to first treatment (TTT) and overall survival (OS), but this point is still controversial [7–10, 17–18]. A two base-pair frameshift-deletion (c.7544_7545fsdelCT) accounts for more than 90% of all NOTCH1mut in CLL and results in a stable activated form of NOTCH1 due to the truncation of the C-terminal PEST domain, which is involved in NOTCH1 protein turnover and degradation [4]. Apart from next generation (NGS) and Sanger sequencing analysis, the presence of c.7541-7542delCT NOTCH1 mutations (NOTCH1mut) can be investigated by amplification refractory mutation system PCR, as previously reported [6, 9, 13, 15]. Obviously, all of these methods of investigation, with the exception of NGS, provide only qualitative and not quantitative information. We validated a c.7541-7542delCT NOTCH1 specific mutation assay based on digital droplet PCR (ddPCR) technology. This technique relies on the fragmentation of the PCR reactions into very small droplets that are clonally analyzed [19]. The purpose of ddPCR is to quantify the absolute number of target present in a sample, implementing PCR data with Poisson statistics [20]. Therefore, the ddPCR provides a more direct measurement of target genomic copy numbers and offers a greater precision and reproducibility. The aims of our study were to analyze: a) a c.7541-7542delCT NOTCH1 mutation assay based on ddPCR; b) the NOTCH1mut allelic burden in CLL patients at diagnosis to assess its prognostic role; c) longitudinal ddPCR in a few cases harboring NOTCH1mut (including patients who required therapy and those who were managed with a “watch and wait” approach).
RESULTS
The AS-PCR approach demonstrated NOTCH1mut in a total of 33/88 (37.5%) CLL patients. ddPCR experiments aimed at detecting the LoD for the NOTCH1mut assay established that the limit was a FA ≥0.03% (Figure 1), that is, it can detect three positive events of a total of 10.000 events. A higher percentage of CLL patients bearing NOTCH1mut was detected by ddPCR analysis, 47/88 (53.4%) patients resulting positive, with a FA ≥ 0.03% (Figure 2). In particular, among the 14 patients positive at ddPCR but negative at AS-PCR (NOTCH1mut/AS-PCR-) the median FA was 0.07% (min. 0.03% – max 0.23%) (Figure 2). Among all cases with NOTCH1mut, 16 (18.1%) had a FA >15%, a value roughly within the detection limit of Sanger sequencing. The IGHV status was assessed in 63 (71.5%) cases, NOTCH1mut mostly occurred in IGHV-unmutated CLL patients (15/32 (46.8%) vs 8/31 (25.8%) in NOTCH1wt patients, p = 0.03). Interestingly, among all the CLL cases bearing NOTCH1mut those with unmutated IGHV had a higher median FA than the value observed in IGHV-mutated patients (2.7% vs 0.1%, respectively, p = 0.02) (Figure 3). We did not find statistically significant associations between NOTCH1 mutational status and the clinical and biological features of our CLL series, such as age, sex, stage, and FISH abnormalities (Table 1). NOTCH1mut had a significant effect on TTT; in fact, the median TTT was shorter in the NOTCH1mut group compared to NOTCH1wt patients (0.9 vs 2.5 years, respectively, p = 0.02) (Figure 4A). Moreover, considering in TTT analysis also the NOTCH1mut/AS-PCR- subgroup, the latter did not show statistically significant differences from NOTCH1wt patients (Figure 4B). At univariate analysis the other covariate with a significant impact on TTT was IGHV mutational status: IGHV-mutated patients had a longer TTT than the IGHV-unmutated group (4.43 vs 0.71, p<0.0001) (Figure 4C). Moreover, in a four variables multivariate analysis model that included Rai stage, NOTCH1mut, and FISH abnormalities, IGHV mutational status emerged as the sole independent prognostic factor for TTT (hazard ratio = 3.16; 95% confidence interval = 1.54-6.45; p = 0.001). There was no statistically significant difference in the median OS between patients harboring NOTCH1mut and those with the wild-type gene (9.4 vs 7.8 years, respectively, p = 0.7) (Figure 4D); in our series no other covariates (stage, FISH abnormalities, and IGHV status) were able to predict a better OS (data not shown). Longitudinal ddPCR analysis of sequential samples of CLL patients bearing NOTCH1mut was carried out in: a) 5 cases harboring unmutated IGHV (Cases #1 - #5); b) 1 case with IGHV mutated status (Case #6); c) 3 cases bearing a not productive IGHV rearrangement (Cases #7- #9); d) 1 case with no tested IGHV mutational status (Case #10) (Figure 5). All cases were treated and showed a statistically significant reduction of the NOTCH1mut allelic burden detected at diagnosis after treatment (median FA 11.67 % vs 0.09 %, p = 0.01) (Figure 6A). Among these cases, eight relapsed after the treatment; in these cases, at the time of the CLL relapse the NOTCH1mut allelic fraction was higher compared with the value observed in complete (CR) or partial remission (PR) (median FA 4.75% vs 0.43%, respectively, p = 0.007) (Figure 6B). In two cases in which CLL relapse did not occur (Cases #4 and #6) NOTCH1mut became undetectable by ddPCR analysis during follow-up.
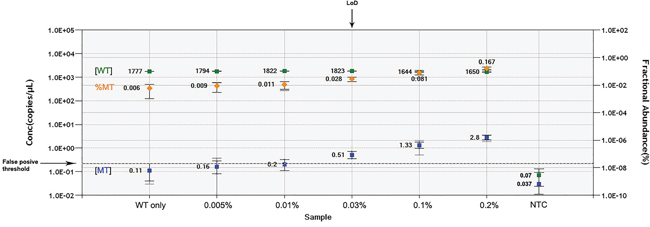
Figure 1: LOD determination. Wild-type (WT) template concentration in copies per μL (cpm) ( ), fractional abundance of mutant to WT template (
 ) and mutant template cpm (
 ) are reported for each dilution of pSC/NOTCH1_mut on the genomic WT background. The False positive threshold (dashed line) was determined as the upper limit of the mutant concentration error bars of the “WT only” control. The value of LOD was equal to the dilution value where the cpm of mutated target fell just above the threshold. NTC, no template control.
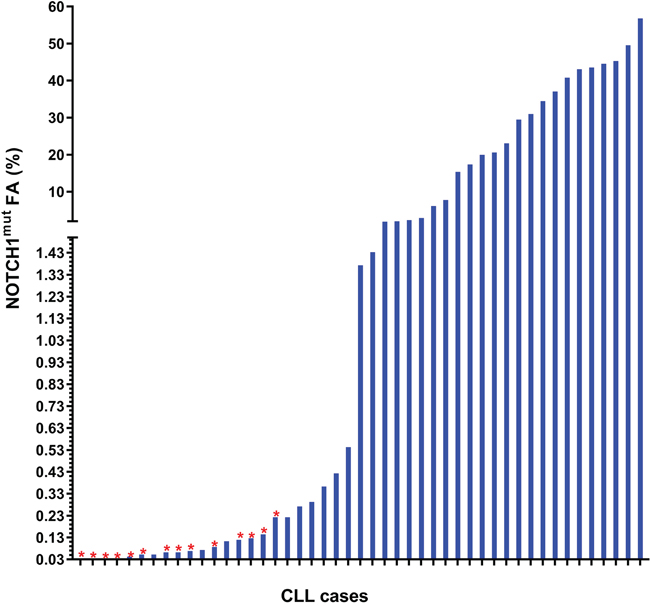
Figure 2: Frequency distribution of the NOTCH1mut FA in CLL patients resulting positive for mutations at ddPCR. The red star ( ) shows the cases resulting negative for NOTCH1mut by AS-PCR.
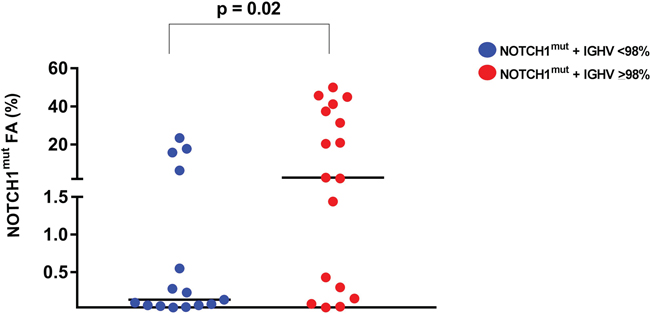
Figure 3: NOTCH1mut allelic burden in CLL patients. The allelic fraction of NOTCH1mut detected by ddPCR resulted higher in CLL patients with unmutated IGHV. Each dot represents a patient. The lines indicate the median for each group.
Table 1: Main features of CLL patients
NOTCH1wt (n = 41) |
NOTCH1mut (n = 47) |
p value |
|
|---|---|---|---|
Age, years: median (range) |
57 (40-80) |
62 (40-82) |
0.1 |
Sex, Male/Female |
27 (66%)/14 (34%) |
34 (72%)/13 (28%) |
0.6 |
Rai stage 0-1 |
24 (58%) |
24 (51%) |
0.5 |
IGHV homology ≥ 98% |
8 (25.8%) |
15 (46.8%) |
0.03 |
IGHV homology < 98% |
23 (74.2%) |
17 (53.2%) |
|
FISH abnormalities |
23 (74%) |
33 (80%) |
0.5 |
Normal FISH |
8 (26%) |
8 (20%) |
|
del13q14 as unique lesion |
8 (26%) |
10 (24%) |
0.7 |
No del13q14 as unique lesion |
15 (65%) |
23 (70%) |
|
+12 |
7 (31%) |
14 (34%) |
0.3 |
+12 neg |
24 (69%) |
27 (66%) |
|
del11q23 |
3 (9.6%) |
8 (19.5%) |
0.3 |
del11q23 neg |
28 (90.4%) |
33 (79.5%) |
|
del17p13 |
6 (19.3%) |
5 (12.1%) |
0.5 |
del17p13 neg |
25 (80.7%) |
36 (87.9%) |
|
Unfavorable aberrations |
9 (29%) |
12 (29.2%) |
0.9 |
No unfavourable aberrations |
22 (71%) |
29 (70.8%) |
|
AS-PCR +/- |
0 / 31 (100%) |
33 (70.2%)/14 (29.8%) |
|
Treated patients |
24 (59%) |
39 (83%) |
0.2 |
TTT (years) |
2.5 |
0.9 |
0.02 |
OS (years) |
7.84 |
9.46 |
0.2 |
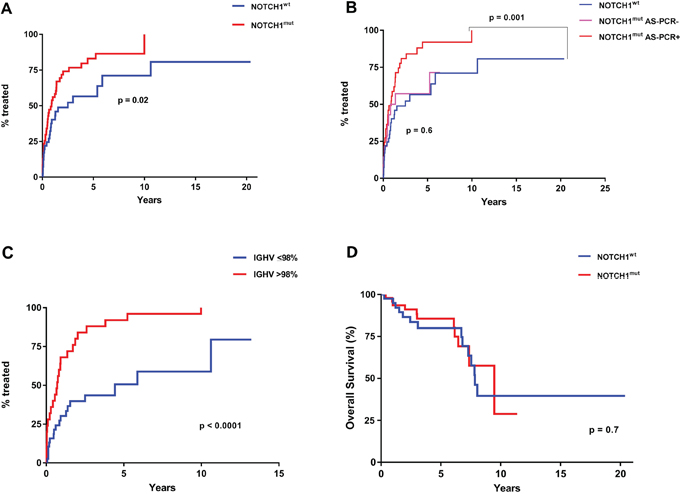
Figure 4: TTT and OS according to NOTCH1mut and IGHV mutational status. A. Comparison of TTT among patients carrying NOTCH1mut (red line) and those with NOTCH1wt (blue line) (p= 0.02 for NOTCH1mut vs NOTCH1wt) B. Comparison of TTT among CLL cases resulting positive for the detection of NOTCH1mut (red line) at ddPCR and AS-PCR, those positive at ddPCR and negative at AS-PCR (pink line), and cases carrying a NOTCH1wt gene (blue line) (p = 0.001 for NOTCH1mut cases detected by ddPCR and AS-PCR vs NOTCH1wt; p = 0.6 for NOTCH1mut detected by ddPCR but negative for AS-PCR vs NOTCH1wt. C. Comparison of TTT among patients carrying the mutated (blue line) or unmutated IGHV gene sequence (red line) (p < 0.0001). D. Comparison of OS among patients carrying NOTCH1mut (red line) and those with NOTCH1wt (blue line) (p= 0.7)
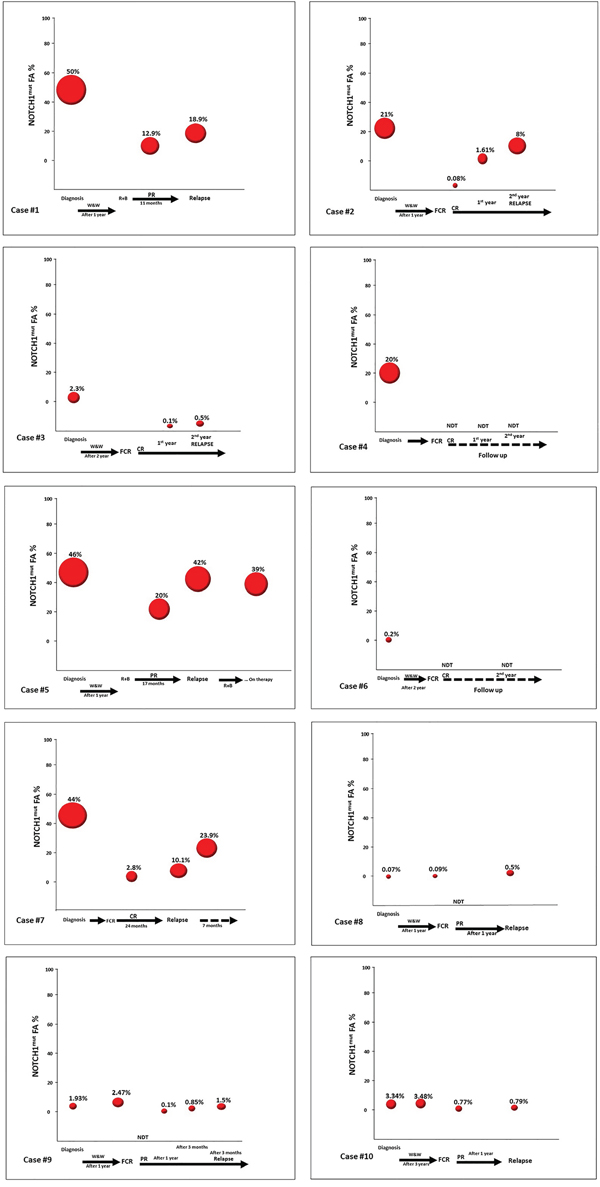
Figure 5: Longitudinal analysis of CLL patients harboring NOTCH1mut. A. The line graph represents the NOTCH1mut allelic burden modification for each case (10 patients) before (at diagnosis) and post treatment. B. The line graph represents the NOTCH1mut allelic burden modification for each case (8 patients) at the time of CR/PR and at CLL relapse.
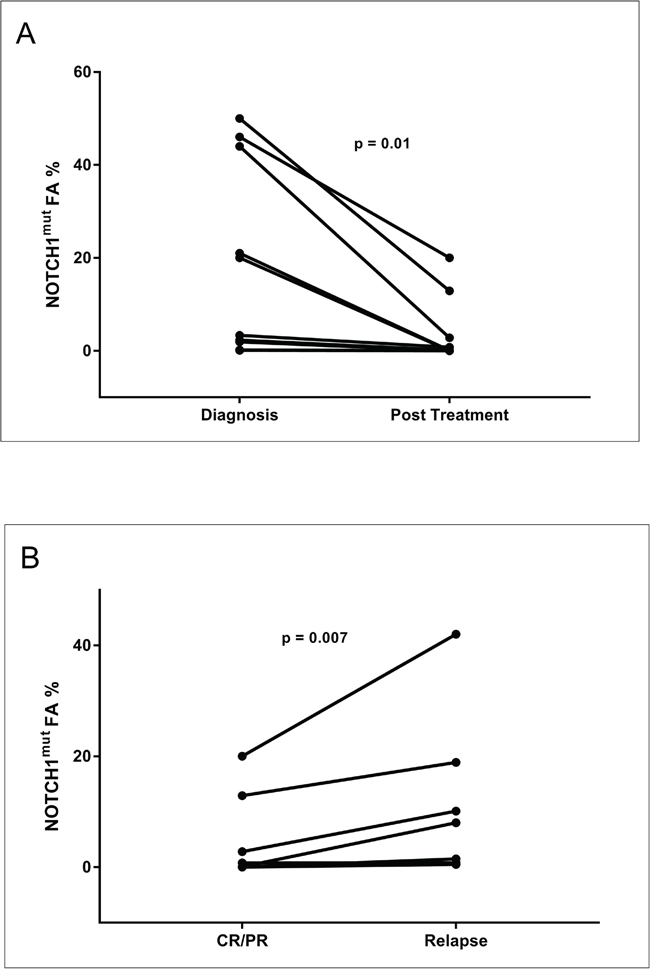
Figure 6: Longitudinal analysis of the NOTCH1mut FA variations in CLL patients. Graphical illustration of the kinetics of the NOTCH1 mut clone in 10 CLL patients longitudinally investigated by ddPCR. All patients were treated; all relapsed except Cases #4 and #6. W&W, watch and wait; FCR, fludarabine, cyclophosphamide, rituximab; BR, bendamustine, rituximab; CR, complete response according to the IWCLL-NCI criteria; PR, partial response according to IWCLL-NCI criteria.
DISCUSSION
The ddPCR technology is a third-generation PCR method that is being applied to various fields of medical diagnostics with promising results. ddPCR is easy to perform and does not require replicate analysis or the generation of standard curves for target quantification. In fact, in comparison with quantitative analog PCR, ddPCR has the potential to make quantitative analyses more reproducible, and precise quantitation might facilitate a variety of clinical tests. However, there are only few studies focused on the use of ddPCR in hematological malignancies [21–26]. In a recent report, NOTCH1mut were detected by NGS in 11% of monoclonal B cell lymphocytosis (MBL) and 13.4% of CLL Binet stage A patients [27]; moreover, this mutation was frequently observed at a low clonal level, particularly in MBL patients, and sequential analyses demonstrated that the NOTCH1mut generally did not appear during the disease course, and that the mutational burden in positive cases remained stable over time. Moreover, it has also been reported that among untreated early stage CLL patients the incidence of NOTCH1mut did not appear to increase over time [27–29]. These data are consistent with the view that NOTCH1mut are an early event, and that a fraction of NOTCH1 mutations may be restricted to small subclones that are not detectable by conventional sequencing at the time of CLL presentation. In our study, we employed a ddPCR assay which allows easy measurement of the absolute copies number of the NOTCH1mut allele. The increased sensitivity of our ddPCR assay revealed that the incidence of NOTCH1mut in CLL patients was much higher than expected. On the other hand, considering only the cases bearing a mutated allelic fraction value within the Sanger’s detection limit (10-20%) the frequency of NOTCH1mut in our series was in accordance with the previously reported values. As in other studies, our data confirmed the association of NOTCH1mut with IGHV-unmutated CLL [6, 15, 23–24]; moreover, our finding that among all the CLL patients with NOTCH1mut those with IGHV-unmutated had the higher mutated allelic burden seems worthy of note. This could mean that the prognostic potential of the NOTCH1mut may be intrinsically correlated with several biologic factors, other than IGHV mutational status, pertaining to the CLL patient. Although in our series the presence of NOTCH1mut was associated with a shorter TTT, this finding was not confirmed at multivariate analysis, where the IGHV mutational status appeared as the sole independent prognostic factor. This result was in accordance with some previous reports [8, 10, 18] but in contrast with others [7, 9, 17]. The discrepancy concerning the prognostic role of NOTCH1mut appears more comprehensible in light of our findings, that unveil the high incidence of NOTCH1mut associated with an extreme heterogeneity in CLL patients, in terms of the mutated allelic burden. In fact, when we considered, among all the NOTCH1mut cases, those resulting negative for mutations at AS-PCR as a distinct subgroup, there was no difference in terms of TTT compared to the NOTCH1wt patients group. Therefore, it seems reasonable to assume that the amount of mutated gene, rather than the mere presence of the mutation, associated with other factors (such as the IGHV mutational status) better defines the prognostic role of NOTCH1mut in CLL patients. Further data will be needed to support this hypothesis.
The sequential analysis results suggest some observations. Firstly, all cases with NOTCH1mut showed a decrease of the mutated allelic burden at the end of the induction treatment, when achieving a CR or PR; this fact appears very interesting because it suggests that NOTCH1mut may be a possible molecular marker of response to therapy, that is very easy to measure with the ddPCR approach. Secondly, in three cases (Cases #8, #9, and #10) (Figure 5) the NOTCH1mut allelic burden increased over time, from “watch and wait” up to the standard chemotherapy approach; in this context it is possible that ddPCR may be a useful tool in CLL patients candidates for the “watch and wait” strategy molecular monitoring, and more predictive than the classic clinical/laboratory parameters. Obviously, this latter consideration appears speculative and needs additional data to support such a use. Finally, all relapsed cases showed a NOTCH1mut allelic burden increase at the time of relapse. This finding further supports the hypothesis that monitoring NOTCH1mut by ddPCR could be employed as a marker of minimal residual disease. Moreover, it is noteworthy that in the two cases characterized by a continuous CR (Cases #4, #6) (Figure 5) the NOTCH1mut has remained undetectable during follow-up.
In conclusion, our ddPCR assay is a valid tool, and its high sensitivity revealed a much higher incidence of NOTCH1mut in CLL patients than expected. The NOTCH1mut prognostic significance remains to be fully clarified. Our findings suggest that NOTCH1mut allelic burden evaluation by ddPCR might identify patients in need of closer clinical follow-up during the “watch and wait” interval and after the standard chemotherapy approach.
MATERIALS AND METHODS
Patients and samples
Samples from 88 CLL patients at diagnosis were included in this study. All patients were diagnosed according to NCI criteria [30]. Table 1 summarizes the clinicobiologic characteristics of the cohort. The median age of the entire series was 60 years (range, 40–82 years); there were 61 males and 27 females. Median follow-up was 3.9 years. In 10 patients, longitudinal samples obtained at different CLL time-points (progression before treatment, after chemotherapy, at relapse) were also examined. The study was approved by the local ethics committee. All patients gave informed consent to participate in this study.
Molecular analysis
Genomic DNA of CLL patients was extracted from peripheral blood at diagnosis using the QIAamp DNA Blood Mini Kit (Qiagen), and quantified with a Qubit 2.0 Fluorometer (Life Technologies). At both CLL diagnosis and relapse, the fraction of tumor cells (CD5+CD19+) corresponded to 70%-98% as assessed by flow cytometry.
Sequence analysis of IGHV –IGHD–IGHJ rearrangements
PCR amplification and sequence analysis of IGHV–IGHD–IGHJ rearrangements were performed in 63 (71.5%) cases, as previously described [31].
AS-PCR
NOTCH1mut was investigated by allele-specific PCR (AS-PCR), as previously described [9]; the lower detection limit of this assay was established as 0.1% of the mutant allele burden in serial dilutions of DNA from a NOTCH1mut heterozygous sample and a NOTCH1 wild-type (WT) sample.
ddPCR mutation detection assay
ddPCR analysis performed by the QX200 (BioRad) system combines water-oil emulsion droplet technology with microfluidics. Each sample is partitioned into 20,000 droplets by a droplet generator and each droplet is amplified by PCR. Then, droplets are analyzed by a droplet reader, which counts the positive and negative fluorescent droplets to define the target concentration. The NOTCH1mut detection by ddPCR was conducted using the specific PrimePCR ddPCR Mutation Assays dHsaCP2500501 and dHsaCP2500500 (BioRad) according to the manufacturing protocol. ddPCR was performed by adding 5U of restriction enzyme HAE III (New England Biolabs) with 130ng of DNA template in a final volume of 20μl. After amplification, the 96-well PCR plate was loaded on the Bio-Rad QX200 droplet reader and ddPCR data were analyzed with QuantaSoft analysis software (version 1.7.4). The latter measures the number of positive and negative droplets for each probe (NOTCH1mut and NOTCH1wt) in each sample and calculates the fraction of positive droplets by a Poisson algorithm to determine the concentration of the target. Then, the software returns those data as the fractional abundance (FA) of mutant to wild type template. The FA is calculated as the percentage ratio between the number of mutant DNA molecules (a) and the number of mutant (a) plus wild type (b) molecules (fractional abundance: (a/a+b)).
Cloning of NOTCH1 mutant fragment
Genomic DNA isolated from a NOTCH1mut patient was amplified with the primers: NOTCHesF (5’-CAGCCAGCAAACATCCAGC-3’) and NOTCHesR (5’-AAAAGGCTCCTCTGGTCGG-3’). The PCR reaction was performed in a final volume of 25μl, containing 100ng of genomic DNA, 1X PCR Buffer, 1.6mM MgCl2, 0.2mM of each dNTP, 0.2μM of NOTCHesF primer, 0.2μM of NOTCHesR primer and 0.5U of Taq DNA Polymerase Recombinant (Invitrogen). Thermal conditions were : 94°C for 3’ (one cycle); 94°C for 30’’, 57°C for 30’’, 72°C for 30’’ (34 cycles); and final elongation at 72°C for 5’. Products were resolved on 1.5% agarose gels by electrophoresis. The product of 571bp was gel purified (QIAquick Gel Extraction Kit QIAGEN) prior to performing the cloning reaction. Cloning was conducted with the StrataClone PCR Cloning Kit (Agilent Technologies) according to the manufacturing protocol.
The positive white colonies were further screened by EcoR I (New England Biolabs) plasmid digestion to verify the presence of the 571bp insert, and by specific NOTCH1 AS-PCR to detect the mutation. Mutation carrying clones were also confirmed by Sanger sequencing and one was selected as the mutant template for LoD determination (named pSC/NOTCH1_mut).
ddPCR assay limit of detection
The limit of detection (LOD) is defined as the lowest mutant concentration that can be reliably distinguished from the WT only control. For determination of the LOD it is necessary to run a plate containing no template control (NTC) wells, WT only control wells and serial dilutions of positive control mutant template in a constant background of WT DNA. We prepared a serial dilution of pSC/NOTCH1_mut (0.005% - 0.2%) on a genomic WT background (2.000 copies per microliter about 130ng).
After ddPCR detection, the FA and concentration were calculated and plotted. The false positive threshold of the assay was determined as the upper limit of the mutant concentration error bars in the WT-only. LoD was calculated as the lowest mutant concentration where the lower limit of the error bars does not cross the false positive threshold. The first concentration value above the threshold represents the lowest statistically significant (p<0.05) detectable concentration.
Fluorescence in situ hybridization (FISH)
FISH analyses were performed using bacterial artificial chromosomes (Children’s Hospital Oakland Research Institute, Oakland, CA, USA), specific for 17p13, 11q22, 12q and 13q14 chromosomes (RP11-199F11, RP11-835M17, RP11-1100L3, and RP11-153K13, respectively) according to the University of California (Santa Cruz, CA, USA) database (http://genome.ucsc.edu/; February 2009 release). Chromosome preparations were hybridized in situ with probes labeled by nick translation, as previously described [32–33].
Statistical analysis
Clinical and biological features between groups were compared using the Fisher exact test for categorical data and the nonparametric Mann-Whitney U or t tests for continuous variables; continuous variables from related samples were compared using the Wilcoxon test. A p value <0.05 was considered significant. OS was calculated from the date of diagnosis to the date of death or last follow-up. TTT was calculated from the date of diagnosis to the date of first treatment or last follow-up, considering disease-unrelated deaths as competing events. The log-rank test was used to compare Kaplan-Meier curves of OS; the Gray test was used to compare cumulative incidence curves of TTT. Multivariate analyses of prognostic factors were modeled using Cox and Fine-Gray regression models as previously described [34]. Statistical analyses were carried out using GraphPad Prism version 7.0 for Windows (GraphPad Software, San Diego, CA) and XLSTAT version 2014. 5.03 (AddinsoftTM).
ACKNOWLEDGMENTS
The authors would like to thank Ms. MVC Pragnell, B.A. for language revision of the manuscript.
CONFLICTS OF INTEREST
The Authors declare no conflicts of interest.
FUNDING
This work was supported by “Fondazione Cassa di Risparmio di Puglia”.
REFERENCES
1. Hallek M. Chronic lymphocytic leukemia: 2013 update on diagnosis, risk stratification and treatment. Am J Hematol. 2013; 88: 803–816.
2. Mauro FR, Molica S, Laurenti L, Cortelezzi A, Carella AM, Zaja F, Chiarenza A, Angrilli F, Nobile F, Marasca R, Musolino C, Brugiatelli M, Piciocchi A, et al. Fludarabine plus alemtuzumab (FA) front-line treatment in young patients with chronic lymphocytic leukemia (CLL) and an adverse biologic profile. Leuk Res. 2014; 38:198-203.
3. Quesada V, Conde L, Villamor N, Ordóñez GR, Jares P, Bassaganyas L, Ramsay AJ, Beà S, Pinyol M, Martínez-Trillos A, López-Guerra M, Colomer D, Navarro A, et al. Exome sequencing identifies recurrent mutations of the splicing factor SF3B1 gene in chronic lymphocytic leukemia. Nat Genet. 2012; 44: 47–52.
4. Puente XS, Pinyol M, Quesada V, Conde L, Ordóñez GR, Villamor N, Escaramis G, Jares P, Beà S, González-Díaz M, Bassaganyas L, Baumann T, Juan M, López-Guerra M, et al. Whole-genome sequencing identifies recurrent mutations in chronic lymphocytic leukaemia. Nature. 2011; 475: 101–105.
5. Wang L, Lawrence MS, Wan Y, Stojanov P, Sougnez C, Stevenson K, Werner L, Sivachenko A, DeLuca DS, Zhang L, Zhang W, Vartanov AR, Fernandes SM, et al. SF3B1 and other novel cancer genes in chronic lymphocytic leukemia. N Engl J Med. 2011; 365: 2497–2506.
6. Fabbri G, Rasi S, Rossi D, Trifonov V, Khiabanian H, Ma J, Grunn A, Fangazio M, Capello D, Monti S, Cresta S, Gargiulo E, Forconi F, et al. Analysis of the chronic lymphocytic leukemia coding genome: role of NOTCH1 mutational activation. J Exp Med. 2011; 208: 1389–1401.
7. Rossi D, Rasi S, Fabbri G, Spina V, Fangazio M, Forconi F, Marasca R, Laurenti L, Bruscaggin A, Cerri M, Monti S, Cresta S, Famà R, et al. Mutations of NOTCH1 are an independent predictor of survival in chronic lymphocytic leukemia. Blood. 2012; 119: 521–529.
8. Baliakas P, Hadzidimitriou A, Sutton LA, Rossi D, Minga E, Villamor N, Larrayoz M, Kminkova J, Agathangelidis A, Davis Z, Tausch E, Stalika E, Kantorova B et al. Recurrent mutations refine prognosis in chronic lymphocytic leukemia. Leukemia. 2015; 29:329-36.
9. Sportoletti P, Baldoni S, Del Papa B, Aureli P, Dorillo E, Ruggeri L, Plebani S, Amico V, Di Tommaso A, Rosati E, Marconi P, Di Ianni M, Falzetti F. A revised NOTCH1 mutation frequency still impacts survival while the allele burden predicts early progression in chronic lymphocytic leukemia. Leukemia. 2014; 28:436-9.
10. Nadeu F, Delgado J, Royo C, Baumann T, Stankovic T, Pinyol M, Jares P, Navarro A, Martín-García D, Beà S, Salaverria I, Oldreive C, Aymerich M, et al. Clinical impact of clonal and subclonal TP53, SF3B1, BIRC3, NOTCH1, and ATM mutations in chronic lymphocytic leukemia. Blood. 2016; 127:2122-30
11. Rossi D, Rasi S, Spina V, Bruscaggin A, Monti S, Ciardullo C, Deambrogi C, Khiabanian H, Serra R, Bertoni F, Forconi F, Laurenti L, Marasca R, et al. Integrated mutational and cytogenetic analysis identifies new prognostic subgroups in chronic lymphocytic leukemia. Blood. 2013; 121: 1403–1412.
12. Rossi D, Rasi S, Spina V, Fangazio M, Monti S, Greco M, Ciardullo C, Famà R, Cresta S, Bruscaggin A, Laurenti L, Martini M, Musto P, et al. Different impact of NOTCH1 and SF3B1 mutations on the risk of chronic lymphocytic leukemia transformation to Richter syndrome. Br J Haematol. 2012; 158:426-9.
13. Del Poeta G, Dal Bo M, Del Principe MI, Pozzo F, Rossi FM, Zucchetto A, Bomben R, Degan M, Rasi S, Rossi D, Bulian P, Gaidano G, Amadori S, et al. Clinical significance of c.7544-7545 delCT NOTCH1 mutation in chronic lymphocytic leukaemia. Br J Haematol. 2013; 160: 415–418.
14. Fabbri G, Khiabanian H, Holmes AB, Wang J, Messina M, Mullighan CG, Pasqualucci L, Rabadan R, Dalla-Favera R. Genetic lesions associated with chronic lymphocytic leukemia transformation to Richter syndrome. J Exp Med. 2013; 210:2273-88.
15. Del Giudice I, Rossi D, Chiaretti S, Marinelli M, Tavolaro S, Gabrielli S, S, Laurenti L, Marasca R, Rasi S, Fangazio M, Guarini A, Gaidano G, Foà R. NOTCH1 mutations in +12 chronic lymphocytic leukemia (CLL) confer an unfavorable prognosis, induce a distinctive transcriptional profiling and refine the intermediate prognosis of +12 CLL. Haematologica. 2012; 97: 437–441.
16. Balatti V, Bottoni A, Palamarchuk A, Alder H, Rassenti LZ, Kipps TJ, Pekarsky Y, Croce CM. NOTCH1 mutations in CLL associated with trisomy 12. Blood. 2012; 119:329-31.
17. Oscier DG, Rose-Zerilli MJ, Winkelmann N, Gonzalez de Castro D, Gomez B, Forster J, Parker H, Parker A, Gardiner A, Collins A, Else M, Cross NC, Catovsky D, et al. The clinical significance of NOTCH1 and SF3B1 mutations in the UK LRF CLL4 trial. Blood. 2013;121:468-75.
18. Rasi S, Khiabanian H, Ciardullo C, Terzi-di-Bergamo L, Monti S, Spina V, Bruscaggin A, Cerri M, Deambrogi C, Martuscelli L, Biasi A, Spaccarotella E, De Paoli L, et al. Clinical impact of small subclones harboring NOTCH1, SF3B1 or BIRC3 mutations in chronic lymphocytic leukemia. Haematologica. 2016;101:e135-8.
19. Pinheiro LB, Coleman VA, Hindson CM, Herrmann J, Hindson BJ, Bhat S, Emslie KR: Evaluation of a droplet digital polymerase chain reaction format for DNA copy number quantification. Anal Chem. 2012; 84:1003e1011.
20. Sykes PJ, Neoh SH, Brisco MJ, Hughes E, Condon J, Morley AA. Biotechniques. 1992; 13:444–449.
21. Albano, F., Zagaria, A., Anelli, L., Coccaro, N., Tota, G., Brunetti, C., Minervini, CF., Impera, L., Minervini, A., Cellamare, A., Orsini, P., Cumbo, C., Casieri, P. et al. Absolute quantification of the pretreatment PML-RARA transcript defines the relapse risk in acute promyelocytic leukemia. Oncotarget. 2015; 6:13269–13277. doi: 10.18632/oncotarget.3773.
22. Drandi D, Kubiczkova-Besse L, Ferrero S, Dani N, Passera R, Mantoan B, Gambella M, Monitillo L, Saraci E, Ghione P, Genuardi E, Barbero D, Omedè P, et al. Minimal residual disease detection by droplet digital PCR in multiple myeloma, mantle cell lymphoma, and follicular lymphoma: a comparison with real-time PCR. J Mol Diagn. 2015; 17: 652–660.
23. Zagaria A, Anelli L, Coccaro N, Tota G, Casieri P, Cellamare A, Impera L, Brunetti C, Minervini A, Minervini CF, Delia M, Cumbo C, Orsini P, et al. BCR-ABL1 e6a2 transcript in chronic myeloid leukemia: biological features and molecular monitoring by droplet digital PCR. Virchows Archiv. 2015; 467:357–363.
24. Coccaro N, Tota G, Anelli L, Zagaria A, Casieri P, Cellamare A, Minervini CF, Minervini A, Cumbo C, Impera L, Brunetti C, Orsini P, Parciante E, et al. MYEOV gene overexpression in primary plasma cell leukemia with t(11;14)(q13;q32). Oncol Lett. 2016;12:1460-1464.
25. Della Starza I, Nunes V, Cavalli M, De Novi LA, Ilari C, Apicella V, Vitale A, Testi AM, Del Giudice I, Chiaretti S, Foà R, Guarini A. Comparative analysis between RQ-PCR and digital-droplet-PCR of immunoglobulin/T-cell receptor gene rearrangements to monitor minimal residual disease in acute lymphoblastic leukaemia. Br J Haematol. 2016;174:541-9.
26. Anelli L, Zagaria A, Coccaro N, Tota G, Minervini A, Casieri P, Impera L, Minervini CF, Brunetti C, Ricco A, Orsini P, Cumbo C, Specchia G, et al. Droplet digital PCR assay for quantifying of CALR mutant allelic burden in myeloproliferative neoplasms. Ann Hematol. 2016; 95:1559-60.
27. Lionetti M, Fabris S, Cutrona G, Agnelli L, Ciardullo C, Matis S, Ciceri G, Colombo M, Maura F, Mosca L, Gentile M, Recchia AG, Ilariucci F, et al. High-throughput sequencing for the identification of NOTCH1 mutations in early stage chronic lymphocytic leukaemia: biological and clinical implications. Br J Haematol. 2014; 165:629-39.
28. Jethwa A, Hullein J, Stolz T, Blume C, Sellner L, Jauch A, Sill M, Kater AP, Te Raa GD, Geisler C, van Oers M, Dietrich S, Dreger P, et al. Targeted resequencing for analysis of clonal composition of recurrent gene mutations in chronic lymphocytic leukaemia. Br J of Haematol. 2013; 163: 496–500.
29. Villamor N, Conde L, Martinez-Trillos A, Cazorla M, Navarro A, Bea S, Lopez C, Colomer D, Pinyol M, Aymerich M, Rozman M, Abrisqueta P, Baumann T, et al. (2013) NOTCH1 mutations identify a genetic subgroup of chronic lymphocytic leukemia patients with high risk of transformation and poor outcome. Leukemia. 2013; 27:1100–1106.
30. Hallek M, Cheson BD, Catovsky D, Caligaris-Cappio F, Dighiero G, Döhner H, Hillmen P, Keating MJ, Montserrat E, Rai KR, Kipps TJ. International Workshop on Chronic Lymphocytic Leukemia. et al. Guidelines for the diagnosis and treatment of chronic lymphocytic leukemia: a report from the International Workshop on Chronic Lymphocytic Leukemia updating the National Cancer Institute-Working Group 1996 guidelines. Blood. 2008; 111:5446–56.
31. Langerak AW, Davi F, Ghia P, Hadzidimitriou A, Murray F, Potter KN, Rosenquist R, Stamatopoulos K, Belessi C; European Research Initiative on CLL (ERIC). Immunoglobulin sequence analysis and prognostication in CLL: guidelines from the ERIC review board for reliable interpretation of problematic cases. Leukemia. 2011; 25:979-84.
32. Storlazzi CT, Albano F, Locunsolo C, Lonoce A, Funes S, Guastadisegni MC, Cimarosto L, Impera L, D’Addabbo P, Panagopoulos I, Specchia G, Rocchi M. t(3;12)(q26;q14) in polycythemia vera is associated with upregulation of the HMGA2 gene. Leukemia. 2006; 20:2190-2
33. Albano F, Anelli L, Zagaria A, Coccaro N, Minervini A, Rossi AR, Specchia G. Decreased TET2 gene expression during chronic myeloid leukemia progression. Leuk Res. 2011; 35:e220-2
34. Delgado J, Pereira A, Villamor N, Lopez-Guillermo A, Rozman C. Survival analysis in hematologic malignancies: recommendations for clinicians. Haematologica. 2014; 99:1410-1420.