
INTRODUCTION
Globally, lung cancer was the most common cancer and the leading cause of cancer-related deaths, particularly for males, in 2012 [1]. While early detection and new therapies have increased overall survival (OS) of most cancers, survival of patients with lung cancer has not been significantly improved, with a 5-year survival of 18% [2]. This low survival rate is partly because more than one-half of cases have been diagnosed at a late stage, with an even lower 5-year survival rate of 4% [2]. Non-small cell lung cancer (NSCLC) is the most frequent type, accounting for over 85% of all the cases, with a predicted 5-year survival rate of about 15.9% [3].
Prognostic assessment is important for the NSCLC therapeutic choice. Tumor- and patient-related factors are two major factors that are associated with OS of NSCLC patients [4]; the former includes primary site, histology and tumor stage, and the latter includes age, sex, performance status and environmental factors, such as nutrition and choice of treatment. Besides, many prognostic molecular markers have also been assessed in NSCLC. For example, expression levels of or mutations in ERCC1 [5], RRM1 [6] and BRCA1 [7] have been shown to have a predictive value for selection of patients who will benefit from platinum-based chemotherapy. Meanwhile, some drugs like gefitinib and crizotinib targeting EGFR and EML4-ALK mutations are recommended for patients with sensitizing mutations on the basis of an observed superior response rate, longer progression-free survival and better toxicity tolerance [4]. However, these factors remain insufficient at the personal level to determine the most appropriate therapeutic choice and clinical outcomes. Recently, genetic factors are considered to play an important role in lung cancer susceptibility [8] and prognosis [9–12]. Furthermore, it is estimated that genetic factors account for 20–95% of the variability in anti-cancer effects and toxicities [13]. Therefore, it is essential to identify the role of some genetic factors in lung cancer prognosis, which could lead to a comprehensive prognostic model for NSCLC.
The Notch signaling pathway regulates cell-cell communication, which involves gene regulation mechanisms that control cell proliferation, differentiation and apoptosis processes [14]. There are four receptors (Notch 1–4), five ligands (Delta-like 1, Delta-like 3, Delta-like 4, Jagged-1 and Jagged-2) and some downstream components in the Notch signaling pathway that can be activated by Notch ligands binding to their receptors. The combination of the ligands and the receptors can lead to translocation of the Notch intracellular domain (ICD) to the nucleus. Then, under the function of DNA-binding protein and transcriptional activators, ICD can activate the transcription of downstream helix-loop-helix (HLH) family genes, which can act as transcriptional repressors to inhibit cell differentiation process. Deregulation of the receptors or ligands involved in this pathway has been reported to be associated with pathogenesis of many human hematological malignancies and solid tumors [15]. High expression levels of NOTCH1 and NOTCH2 mRNA were found to be significantly associated with OS of ovarian cancer patients [16], and a 10-gene signature (FZD4, HES1, PSEN2, JAG2, PPARG, FOS, HEY1, CDC16, MFNG, and EP300) of the Notch pathway was identified to be associated with a high risk of recurrence of ovarian cancer [17]. Also, NOTCH1 overexpression might predict poorer survival and more aggressive behavior in patients with hepatocellular carcinoma [18]. In addition, Delta-like 4 (DLL4) and Jagged-1(JAG1) were reported to be involved in the process of tumor angiogenesis [19]. For NSCLC, high expression levels of NOTCH1 and NOTCH3 have been found to be significantly associated with poor prognosis in lung adenocarcinoma [20, 21], whereas DLL4 and HES1 were also positively associated with poor OS of NSCLC patients [22], suggesting that Notch signal has biological significance and therapeutic application in NSCLC.
To date, there are no reported studies using large-scale genome-wide association study (GWAS) datasets to investigate the role of genetic variants of genes in the Notch pathway in NSCLC survival. Therefore, we hypothesize that genetic variants in the Notch signaling pathway genes are associated with OS of NSCLC patients.
RESULTS
Multivariate analyses of associations between SNPs and NSCLC OS
The overall workflow of the present study is shown in Figure 1. Basic characteristics of 1,185 NSCLC patients from the PLCO study were described previously (Supplementary Table S1) [23]. We first performed multivariate Cox proportional hazards regression analysis to evaluate associations between 19,571 SNPs (i.e., 2,167 genotyped and 17,404 imputed SNPs) of the Notch signaling pathway genes (Supplementary Table S2) and NSCLC OS with adjustment of age, sex, smoking status, histology, tumor stage, chemotherapy, radiotherapy and surgery. Among of these SNPs, 2,103 SNPs were individually significantly associated with OS at P < 0.05 in an additive genetic model. After the corrections for multiple testing, 144 SNPs in 10 genes (ADAM12, CNTN1, CNTN6, DTX1, HDAC9, LNX1, NCOR2, RAB6A, TLE1 and E2F3) with false discovery rate (FDR) < 0.05 were selected for further analyses (Figure 2).
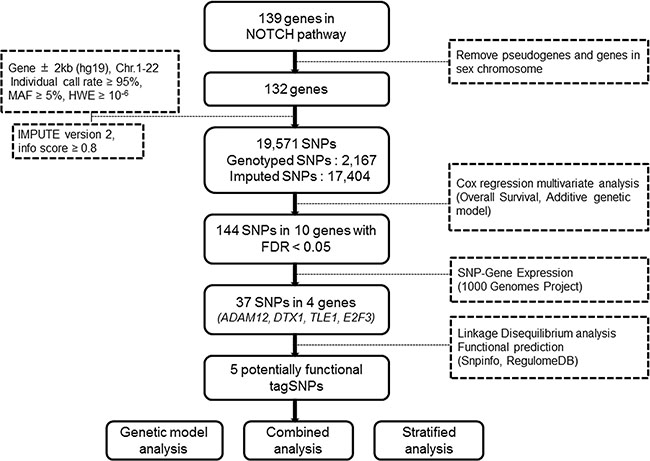
Figure 1: Research workflow chart.
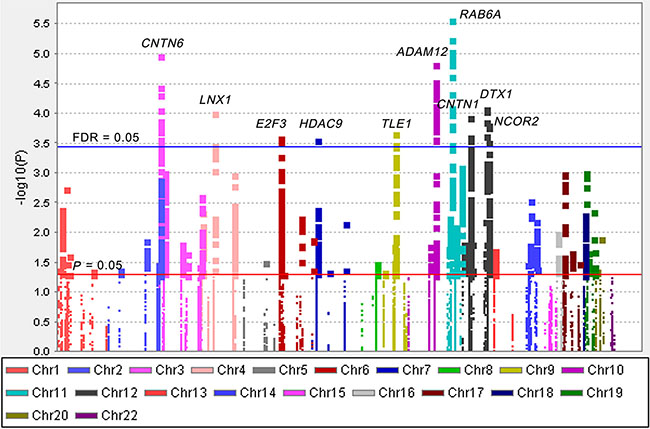
Figure 2: Manhattan plot of 19,571 SNPs of Notch pathway genes in the PLCO study. The statistical values across the autosomes for associations between 19,571 SNPs and overall survival are plotted as −log10 P values. The red horizontal line indicates P = 0.05 and the blue line indicates FDR = 0.05.
Functional SNPs selection
We then used the expression quantitative trait loci (eQTL) analyses to identify SNPs that were associated with mRNA expression levels of the corresponding genes. Of the 144 SNPs, 37 SNPs in four genes (ADAM12, DTX1, TLE1 and E2F3) with positive eQTL results were selected (Padditive < 0.05) (Supplementary Table S3). We then performed pairwise linkage disequilibrium (LD) analyses of the SNPs in ADAM12, DTX1 and TLE1 (only one SNP in E2F3) (Supplementary Figure S1). In ADAM12, the 24 SNPs were in high LD (all r2 > 0.8). In DTX1, there were moderate to high LD (r2 = 0.7–1.0) between the eight SNPs. For the four SNPs in TLE1, there was a high LD (r2 > 0.8) among rs199731120, rs72747302 and rs141894076, except for rs35970494 that had a low LD with the other three SNPs (r2 < 0.4). As a result, we chose five tagSNPs (i.e., rs10794069 in ADAM12, rs1732793 in DTX1, rs199731120 and rs35970494 in TLE1, and rs3806116 in E2F3) as the tagSNPs, based on the comprehensive results of P value and functional prediction (Snpinfo and RegulomeDB) (Table 1). All genotyped and imputed SNPs are shown in the regional association plots with an expansion of 500 KB in the flanks of the gene region, in which the selected five tagSNPs, as shown on the top of the plots, are each labeled in purple (Figure 3). Their physical locations on the genes are summarized in Supplementary Figure S2. As shown in Figure 4, we found that rs10794069 GG, rs199731120 CA/CA, and rs35970494 TC/TC genotypes were associated with increased levels of the corresponding mRNA expression (Padditive = 0.003, 0.001 and 0.012, respectively) (Figure 4A, 4C and 4D), whereas rs1732793 AA and rs3806116 TT genotypes were found to be associated with decreased mRNA expression levels (Padditive = 0.014 and 0.046, respectively) (Figure 4B and 4E).
Table 1: Summary of the five identified functional tagSNPs
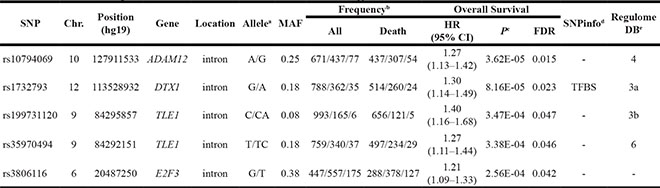
Abbreviations: HR, hazards ratio; CI, confidence interval; FDR, false discovery rate; Chr., chromosome; MAF, minor allele frequency; TFBS, transcription factor binding sites.
aReference/effect allele.
bMajor homozygote/heterozygote/rare homozygote.
cMultivariate Cox regression analyses were adjusted for age, sex, smoking status, histology, tumor stage, chemotherapy, radiotherapy, and surgery.
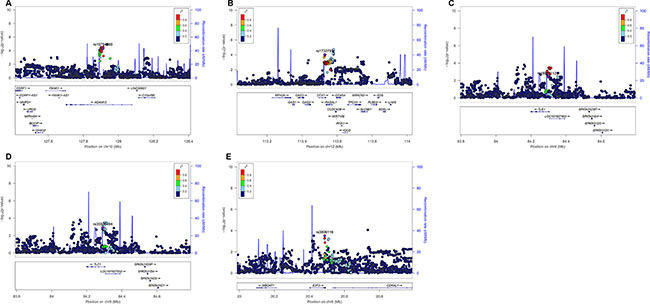
Figure 3: Regional association plots of the five tagSNPs. The left-hand Y-axis shows the -log10 transformation of P-value of individual SNPs, which is plotted against the chromosomal base-pair position with an expansion of 500 KB in the flanks of the gene region. The right-hand Y-axis shows the recombination rate estimated for European populations from HapMap Data Rel 22/phase II. (A) ADAM12 rs10794069; (B) DTX1 rs1732793; (C) TLE1 rs199731120; (D) TLE1 rs35970494; (E) E2F3 rs3806116.
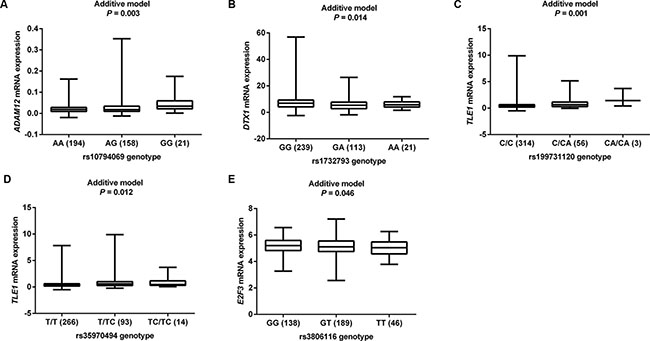
Figure 4: eQTL analyses of tagSNPs and corresponding gene mRNA expression. All the data were from 373 individuals of European descendants from 1000 Genomes Project. (A) ADAM12 rs10794069; (B) DTX1 rs1732793; (C) TLE1 rs199731120; (D) TLE1 rs35970494; (E) E2F3 rs3806116.
Five potentially functional tagSNPs and survival in NSCLC patients
Then, we performed survival analyses with different genetic models for each tagSNP using univariate and multivariate Cox regression analysis methods. As shown in Table 1, we found that under an additive genetic model, ADAM12 rs10794069 G, DTX1 rs1732793 A, TLE1 rs199731120 CA, TLE1 rs35970494 TC and E2F3 rs3806116 T variant alleles were associated with a poor NSCLC OS, with a variant-allele attributed hazard ratio (HR) of 1.27 [95% Confidence interval (95% CI) = 1.13–1.42, P = 3.62E-05], 1.30 (95% CI = 1.14–1.49, P = 8.16E-05), 1.40 (95% CI = 1.16–1.68, P = 3.47E-04), 1.27 (95% CI = 1.11–1.44, P = 3.38E-04), and 1.21 (95% CI = 1.09–1.33, P = 2.56E-04), respectively.
Table 2 shows the results from a dominant genetic model in multivariate analyses. Compared with the corresponding common homozygous genotypes, their variant genotypes were significantly associated with a poorer OS (HR = 1.35, 95% CI = 1.17–1.56, and P = 3.22E-05 for rs10794069 AG+GG; 1.31, 1.13–1.51, and 4.12E-04 for rs1732793 GA+AA; 1.42, 1.17–1.72, and 4.70E-04 for rs199731120 C/CA+CA/CA; 1.31, 1.12–1.53, and 5.64E-04 for rs35970494 T/TC+TC/TC; and 1.33, 1.15–1.54, and 1.72E-04 for rs3806116 GT+TT). To provide a visual effect, we also present the Kaplan-Meier (KM) survival curves for the associations between these risk genotypes and OS in Figure 5A–5E, showing that genotypes of rs10794069 AG+GG, rs1732793 GA+AA, rs199731120 C/CA+CA/CA, rs35970494 T/TC+TC/TC and rs3806116 GT+TT were associated with a poor OS of NSCLC patients (Log-rank test: P = 0.003, 0.037, 0.103, 0.060 and 0.197, respectively).
Table 2: Associations between tagSNPs in the Notch pathway genes and overall survival of NSCLC patients
Gene/SNP |
Genotype |
Frequency |
Univariate analysis |
Multivariate analysisa |
|||
|---|---|---|---|---|---|---|---|
All |
Death (%) |
HR (95% CI) |
P |
HR (95% CI) |
P |
||
ADAM12 rs10794069 A > G |
AA |
671 |
437 (65.1) |
1.00 |
1.00 |
||
AG |
437 |
307 (70.3) |
1.23 (1.06–1.43) |
0.006 |
1.33 (1.15–1.55) |
1.52E-04 |
|
GG |
77 |
54 (70.1) |
1.25 (0.95–1.66) |
0.117 |
1.47 (1.10–1.95) |
0.009 |
|
Trend test |
0.005 |
3.62E-05 |
|||||
AG+GG |
514 |
361 (70.2) |
1.23 (1.07–1.42) |
0.003 |
1.35 (1.17–1.56) |
3.22E-05 |
|
DTX1 rs1732793 G > A |
GG |
788 |
514 (65.2) |
1.00 |
1.00 |
||
GA |
362 |
260 (71.8) |
1.19 (1.02–1.38) |
0.025 |
1.27 (1.09–1.48) |
0.002 |
|
AA |
35 |
24 (68.6) |
0.99 (0.65–1.48) |
0.942 |
1.90 (1.26–2.88) |
0.003 |
|
Trend test |
0.092 |
8.16E-05 |
|||||
GA+AA |
397 |
284 (71.5) |
1.17 (1.01–1.35) |
0.038 |
1.31 (1.13–1.51) |
4.12E-04 |
|
TLE1 rs199731120 C > CA |
C/C |
993 |
656 (66.1) |
1.00 |
1.00 |
||
C/CA |
165 |
121 (73.3) |
1.17 (0.96–1.42) |
0.118 |
1.40 (1.15–1.71) |
0.001 |
|
CA/CA |
6 |
5 (83.3) |
1.29 (0.53–3.10) |
0.576 |
1.90 (0.78–4.61) |
0.156 |
|
Trend test |
0.101 |
3.47E-04 |
|||||
C/CA+CA/CA |
171 |
126 (73.7) |
1.17 (0.97–1.42) |
0.104 |
1.42 (1.17–1.72) |
4.70E-04 |
|
TLE1 rs35970494 T > TC |
T/T |
759 |
497 (65.5) |
1.00 |
1.00 |
||
T/TC |
340 |
234 (68.8) |
1.13 (0.96–1.32) |
0.134 |
1.29 (1.10–1.51) |
0.002 |
|
TC/TC |
37 |
29 (78.4) |
1.44 (0.99–2.10) |
0.055 |
1.54 (1.05–2.25) |
0.026 |
|
Trend test |
0.029 |
3.38E-04 |
|||||
T/TC+TC/TC |
377 |
263 (69.8) |
1.15 (0.99–1.34) |
0.060 |
1.31 (1.12–1.53) |
5.64E-04 |
|
E2F3 rs3806116 G > T |
GG |
447 |
288 (64.4) |
1.00 |
1.00 |
||
GT |
557 |
378 (67.9) |
1.06 (0.91–1.23) |
0.465 |
1.31 (1.12–1.53) |
0.001 |
|
TT |
175 |
127 (72.6) |
1.24 (1.01–1.53) |
0.041 |
1.40 (1.13–1.73) |
0.002 |
|
Trend test |
0.058 |
2.56E-04 |
|||||
GT+TT |
732 |
505 (69.0) |
1.10 (0.95–1.27) |
0.198 |
1.33 (1.15–1.54) |
1.72E-04 |
|
Number of risk genotypesb |
0 |
122 |
73 (59.8) |
1.00 |
1.00 |
||
1 |
331 |
206 (62.2) |
1.14 (0.87–1.49) |
0.338 |
1.62 (1.23–2.13) |
5.44E-04 |
|
2 |
353 |
241 (68.3) |
1.29 (0.99–1.67) |
0.059 |
1.96 (1.49–2.57) |
1.19E-06 |
|
3 |
225 |
158 (70.2) |
1.45 (1.10–1.92) |
0.009 |
2.33 (1.75–3.11) |
8.37E-09 |
|
4 |
75 |
56 (74.7) |
1.57 (1.11–2.23) |
0.011 |
2.84 (1.98–4.08) |
1.40E-08 |
|
5 |
19 |
17 (89.5) |
1.98 (1.17–3.35) |
0.011 |
3.40 (1.99–5.80) |
7.48E-06 |
|
Trend test |
1.05E-04 |
3.44E-13 |
|||||
0–1 |
453 |
279 (61.6) |
1.00 |
1.00 |
|||
2–5 |
672 |
472 (70.2) |
1.26 (1.09–1.46) |
0.002 |
1.56 (1.34–1.81) |
1.46E-08 |
|
Abbreviations: SNP, single nucleotide polymorphisms; NSCLC, non-small cell lung cancer; HR, hazards ratio; CI, confidence interval.
aMultivariate Cox regression analyses were adjusted by age, sex, smoking status, histology, tumor stage, chemotherapy, radiotherapy, and surgery.
bRisk genotypes included rs10794069 AG+GG, rs1732793 GA+AA, rs199731120 C/CA+CA/CA, rs35970494 T/TC+TC/TC, and rs3806116 GT+TT.
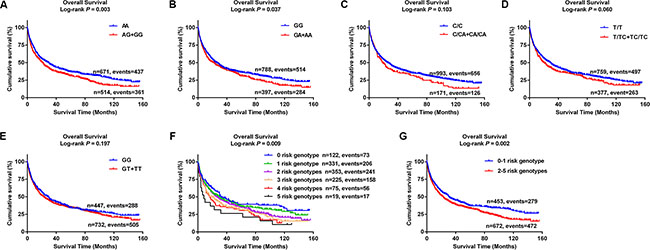
Figure 5: Kaplan-Meier (KM) survival curves for NSCLC patients of five tagSNPs and combined risk genotypes. (A) ADAM12 rs10794069; (B) DTX1 rs1732793; (C) TLE1 rs199731120; (D) TLE1 rs35970494; (E) E2F3 rs3806116; (F) Six groups of combined risk genotypes; (G) Two groups of combined risk genotypes.
Combined analyses of five tagSNPs
To evaluate the joint effect of the five tagSNPs on OS of NSCLC patients, we combined the genotypes of rs10794069 AG+GG, rs1732793 GA+AA, rs199731120 C/CA+CA/CA, rs35970494 T/TC+TC/TC and rs3806116 GT+TT (under a dominant genetic model) into a genetic score to define the combined risk genotypes. We firstly categorized all the patients into six groups: 0 to 5 risk genotypes. As a result, we found that there was a risk-genotype dose-response in the effect on OS associated with the genetic score (Ptrend = 3.44E-13) after adjustment for other host and clinical covariates (Table 2). Then, we dichotomized all the patients into a low-risk group (0–1 risk genotypes) and a high-risk group (2–5 risk genotypes). A similar result was observed that the high-risk group notably had 1.56 fold increased risk of death (95% CI = 1.34–1.81, P = 1.46E-08), compared with the low-risk group. KM curves were also provided to illustrate the association between the number of risk genotypes (the genetic score) and NSCLC OS (Figure 5F–5G).
Stratified analyses for the effect of combined risk genotypes on NSCLC OS
We then performed stratified analyses to evaluate whether the combined effect of risk genotypes as defined by the genetic score on NSCLC OS was affected by host and clinical characteristics, including age, sex, smoking status, histology, tumor stage, chemotherapy, radiotherapy and surgery. In the multivariate analyses, we found that patients with the high (2–5) risk genotypes showed significantly worse prognosis in most subgroups, except for never smoking group that had a much reduced number of observations (Supplementary Table S4). KM curves were also performed to clearly demonstrate the associations between the combined risk genotypes and NSCLC OS in the subgroups of each clinical characteristic (Supplementary Figure S3A–S3R). However, we found no difference between the subgroups of each clinical characteristic (P > 0.05) as assessed by the heterogeneity test (Supplementary Table S4).
DISCUSSION
The Notch signaling pathway controls and regulates cell proliferation, differentiation and apoptosis processes [14], and deregulation of this pathway has been reported to be associated with the development of various cancers, including cancers of the ovary [16, 17], liver [18], prostate [24], brain [25], kidney [26], colorectum [27], skin [28] and lung [20–22]. Therefore, alternations in the Notch pathway in cancer cells are increasingly being recognized. However, to the best of our knowledge, this is the first pathway analysis using the largest GWAS datasets for associations between SNPs of Notch pathway genes and NSCLC OS.
In the present study of genetic variants of 132 genes (after removal of one pseudogene and six genes in chromosome X) in the Notch signaling pathway and NSCLC OS using the published GWAS datasets, we identified ADAM12 rs10794069 A > G, DTX1 rs1732793 G > A, TLE1 rs199731120 C > CA, TLE1 rs35970494 T > TC and E2F3 rs3806116 G > T as predictors of NSCLC OS. Specifically, the risk alleles, rs10794069G, rs1732793A, rs199731120CA, rs35970494TC and rs3806116T as well as their combined risk genotypes were associated with a poorer OS in NSCLC patients, in a risk-genotype dose-response manner. Importantly, we found that these five SNPs were associated with their gene mRNA expression levels as well, which provides further supports for the biological plausibility of our findings. The five identified potentially functional SNPs highlighted the roles of four genes (ADAM12, DTX1, TLE1 and E2F3) in NSCLC patient survival. It has been well known that tumor, histology, different treatment strategies are related to prognosis of NSCLC. In the current study, we included these factors as covariates for survival analysis and also performed stratified analysis of these factors. However, no heterogeneity between subgroups was observed, and patients with the high genetic risk scores all showed an increased risk of death in each subgroup of these three factors.
ADAM12, located in the 10q26 chromosome region, encodes an enzyme called a disintegrin and metalloprotease 12 (ADAM12). The enzyme is a membrane-anchored protein that has been implicated in a variety of biological processes involving cell-cell and cell-matrix interactions. ADAM12 has been reported to be associated with development and progression of many cancers. For example, its gene expression was upregulated in breast cancer tissues, compared with that of normal tissues, and high levels of the ADAM12 protein were related with poor prognosis [29]. ADAM12 was also regarded as a new biomarker of ovarian cancer, because of its low expression levels in normal tissues and high expression levels in ovarian cancer tissues, and high expression levels were associated with a poor survival in aggressive ovarian cancer as well [30, 31]. One study suggested that the ADAM12 (uADAM12) protein was a potential non-invasive biomarker for gastric cancer due to its higher expression levels in urine samples from gastric cancer patients than that from healthy controls [32]. Other study reported that ADAM12 was highly expressed in small cell lung cancer (SCLC) and could be an effective marker for diagnosis and prognosis [33]. Taken together, ADAM12 acts as an oncogene that is associated with poor prognosis in many cancers. Consistent with this, in the present study, the rs10794069 GG variant genotype was associated with a poor NSCLC OS, likely by increasing ADAM12 mRNA expression in a variant allele dose-response manner. According to the ENCODE project data from UCSC, rs10794069 is located at the DNase I hypersensitive area, where shows considerable levels of H3K4Me1 enrichment. In this region, the chromatin has lost its condensed structure after histone modifications, exposing the DNA and making it accessible to transcription factors to enhance transcriptional activity. Therefore, it is likely that SNPs in this region may influence gene expression by mediating the transcriptional activity.
DTX1, located in the 12q24.13 chromosome region, encodes an enzyme called Deltex 1, which is also an E3 ubiquitin ligase. Depending on the cellular context, DTX1, a downstream gene in the Notch pathway, either acts as an oncogene to promote the Notch pathway by activating the downstream HLH family genes to inhibit cell differentiation or acts as a suppressed gene to inhibit this pathway by forming the Notch-Deltex-Kurz protein complexes that mediate Notch receptor degradation through a ubiquitination-dependent pathway [34, 35]. Here, we propose that DTX1 may act as a suppressed gene in NSCLC, because the rs1732793 AA variant genotype was associated with a poor NSCLC OS by decreasing DTX1 mRNA expression. Besides, the ENCODE project data from UCSC shows a certain level of H3K4Me1 enrichment in this region, which may be associated with transcriptional activity by affecting histone modifications. Meanwhile, Snpinfo function prediction online tool confirms that rs1732793 is located in the transcriptional factor binding site (TFBS) that influences the levels or timing of the gene expression by affecting transcriptional factors binding to the specific region of DNA sequences [36].
TLE1, located in the 9q21.32 chromosome region, encodes a protein called transducin-like enhancer protein 1 (TLE1), which is a transcriptional co-repressor that regulates the transcriptional activity of a number of genes. TLE1, as a putative lung-specific oncogene, was found to be overexpressed in a subset of aggressive and advanced human lung tumors [37]. For rs199731120 in TLE1, it is likely a TF binding sequence, which may affect corresponding gene expression. While for rs35970494, we found no additional functional evidence. In fact, in the present study, the rs199731120 CA/CA and rs35970494 TC/TC variant genotypes were both associated with a poor OS, possibly by increasing TLE1 mRNA expression, which is consistent with oncogenic activity of TLE1. However, more rigorous functional studies are needed to unravel the underlying biological mechanisms to validate our findings.
E2F3, located in the 6p22.3 chromosome region, encodes a transcription factor called E2F Transcription Factor 3 (E2F3), which, together with E2F1 and E2F2, constitutes the transcription activators of E2Fs family. As a potential regulatory co-factor in the Notch pathway, E2F3 is considered to participate in controlling cell cycle processes [38]. In differentiating cells, E2F1–3 function in a complex with Rb as repressors to inhibit E2F target activation and facilitate the exit from the cell cycle. The inactivation of Rb in differentiating cells resulted in a switch of E2F1–3 from repressors to activators, leading to the overactivation of E2F target genes and abnormal cell divisions [39]. In the present study, we propose that E2F3 may have a tumor suppression effect in NSCLC, because the rs3806116 TT was a risk genotype that was associated with a poor NSCLC OS by decreasing E2F3 mRNA expression. Except for the association with E2F3 mRNA expression, we did not find additional functional evidence about this SNP, and more functional studies are needed to validate our findings.
There are some limitations in the present study. Firstly, it is a pathway-based analysis of a published GWAS study. We extracted the genes for the Notch signaling pathway from three major publicly recognized datasets of MSigDB website: canonical pathway, GO biological process and GO molecular function, which may have excluded some important genes of this pathway. Secondly, our findings cannot be generalized to the general population, because we just used available GWAS datasets from Caucasian populations. Thirdly, only a few clinical variables were included in the current study, while other information, such as performance, nutrition status and details of combined therapies, was not available in the PLCO dataset for further analysis. Meanwhile, the information of somatic mutations, such as those of EGFR, ALK, or KRAS, was also not available in the PLCO dataset for the participants recruited between 1993 and 2001. Nevertheless, according to National Comprehensive Cancer Network (NCCN) (2016.v4), the mutation frequency of these genes is relatively low (EGFR, 10%; ALK, 2–7%; KRAS, 5–15%) in Europeans. For additional stratification analysis, we would need a much larger sample size, perhaps an even larger sample size for analyzing the interactions between these somatic mutations and SNPs on lung cancer. Finally, we were unable to explore the biological mechanisms by which the SNPs of Notch pathway genes influence NSCLC OS, because we did not have the access to the target lung cancer tissues from the study participants.
In conclusion, we evaluated associations between genetic variants of 132 genes in the Notch signaling pathway and NSCLC OS using the PLCO GWAS dataset. We identified that ADAM12 rs10794069, DTX1 rs1732793, TLE1 rs199731120, TLE1 rs35970494 and E2F3 rs3806116 were prognostic factors for OS in NSCLC patients. Indeed, the current study would be stronger, if the replication datasets with large sample sizes were available. In the future, we will look for both population replication and functional validation to test for our findings.
MATERIALS AND METHODS
Study populations
This study included 1,185 NSCLC patients participated in the Prostate, Lung, Colorectal and Ovarian (PLCO) Cancer Screening Trial, which is a randomized controlled study funded by the National Cancer Institute (NCI) [40]. For the PLCO database, a sample size of 148,000 men and women aged 55–74 from ten screening centers across the United States were enrolled between 1993 and 2001 [41]. All participants were followed for at least 13 years after enrollment [42]. The PLCO trial collected blood specimens from the first screening visit and gathered information about personal sociodemographic characteristics, family history of cancer, personal medical history, and smoking history [42]. Genomic DNA extracted from the blood samples was genotyped with Illumina HumanHap240Sv1.0, HumanHap300v1.1 and HumanHap550v3.0 (dbGaP accession: phs000093.v2.p2 and phs000336.v1.p1) [43, 44]. There were 1,185 Caucasian NSCLC patients with complete follow-up information and genotype data, which were made available in the PLCO database for survival analysis. The study protocol was reviewed and approved by the institutional review board of NCI and a written informed consent was obtained from each participant.
Gene and SNP selection
From the Molecular Signatures Database (MsigDB), 139 genes in the Notch signaling pathway were selected, which are a collection of annotated gene sets that can be analyzed by the gene set enrichment analysis (GSEA) software (Supplementary Table S2). One pseudogene and six genes in chromosome X were removed from the gene list. Then, we performed imputation of the remaining 132 genes with IMPUTE2 according to the 1000 Genomes Project CEU data (phase 1 release V3). As a result, 19,571 SNPs in 132 genes and their ± 2 kb flanking regions were obtained with the following quality control criteria: (1) genotyping rate ≥ 95%; (2) minor allelic frequency (MAF) ≥ 0.05; and (3) Hardy-Weinberg equilibrium (HWE) ≥ 1×10⁻⁶. Of these 19,571 SNPs, 2,167 SNPs were available from PLCO genotyping data (dbGaP accession: phs000093.v2.p2 and phs000336.v1.p1) [43–45], and the rest of 17,404 SNPs were imputed by using the reference data of 1000 Genomes Project [46].
The eQTL [47] analysis was performed to evaluate the associations between SNPs and mRNA expression levels of their genes by using the sequencing data from lymphoblastoid cells derived from 373 individuals of European descendants from 1000 Genomes Project as mentioned earlier. LD was evaluated by using the data of the same 373 European individuals. In the present study, we identified tagSNPs by using eQTL (Padditive ≤ 0.05) and LD (r2 ≥ 0.6) analysis. Some other online tools, including dbSNP annotation [48], Snpinfo [36], and RegulomeDB [49], were also used to identify potentially functional SNPs.
Statistical analysis
The NSCLC OS served as a prognostic measurement was estimated in the present study. The follow-up time was defined from NSCLC diagnosis to the last follow-up or the time of death. Associations between SNPs and OS were assessed by the multivariate Cox proportional hazards regression analysis (in an additive genetic model) with the GenABEL package of R [50] with adjustment for age, sex, smoking status, histology, tumor stage, chemotherapy, radiotherapy and surgery. Imputation was performed with IMPUTE2 according to the CEU data from 1000 Genomes project (phase 1 release V3). SNPs with info value ≥ 0.8 were used for further analysis. FDR method with a cut-off value of 0.05 was used for multiple testing corrections [51]. Kaplan-Meier curve and log-rank test were also used to estimate the effects of risk genotypes on the cumulative probability of OS. Meanwhile, the risk genotypes were summarized and combined to assess the association between the number of risk genotypes and NSCLC OS. The heterogeneity test of associations between subgroups in stratified analyses was performed by using the Chi-square-based Q-test.
Besides, Haploview [52] v4.2 was used to produce the Manhattan plot, and LocusZoom [53] was employed to construct the regional association plots by using the 1000 Genomes Project CEU data (phase I integrated release 3, March 2012). Linear regression analysis was applied to analyze associations between SNPs and corresponding gene expression by using PLINK 1.07. All statistical analyses were performed with SAS software (version 9.1.4; SAS Institute, Cary, NC, USA), if not specified otherwise.
Abbreviations
OS, overall survival; NSCLC, non-small cell lung cancer; SNPs, single nucleotide polymorphisms; FDR, false discovery rate; eQTL, expression quantitative trait loci; LD, linkage disequilibrium; HR, hazards ratio; CI, confidence interval; ICD, intracellular domain; HLH, helix-loop-helix; GWAS, genome-wide association study; PLCO, Prostate, Lung, Colorectal and Ovarian Cancer Screening Trial; NCI, National Cancer Institute; MsigDB, Molecular Signatures Database; GSEA, gene set enrichment analysis; MAF, minor allelic frequency; HWE, Hardy-Weinberg Equilibrium; ROC, receiver operating characteristic curve; AUC, area under the curve; KM, Kaplan-Meier; AJCC, American Joint Committee on Cancer; ADAM12, a disintegrin and metalloprotease 12; DTX1, deltex 1; TLE1, transducin-like enhancer protein 1; NCCN, National Comprehensive Cancer Network.
ACKNOWLEDGMENTS
We thank all the participants of the PLCO Cancer Screening Trial. We also thank the National Cancer Institute for providing the access to NCI’s data collected by the PLCO study. The statements contained herein are solely those of the authors and do not represent or imply concurrence or endorsement by NCI. The authors would also like to acknowledge dbGaP repository for providing the cancer genotyping datasets. The accession numbers for the datasets of lung cancer are phs000336.v1.p1 and phs000093.v2.p2. A list of contributing investigators and funding agencies for those studies can be found in the Supplementary Data.
CONFLICTS OF INTEREST
Authors declare no conflicts of interest.
GRANT SUPPORT
Qingyi Wei was supported by a start-up funds from Duke Cancer Institute, Duke University Medical Center and support from the Duke Cancer Institute as part of the P30 Cancer Center Support Grant (Grant ID: NIH CA014236).
REFERENCES
1. Torre LA, Bray F, Siegel RL, Ferlay J, Lortet-Tieulent J, Jemal A. Global cancer statistics, 2012. CA Cancer J Clin. 2015; 65:87–108.
2. Siegel RL, Miller KD, Jemal A. Cancer statistics, 2015. CA Cancer J Clin. 2015; 65:5–29.
3. Chen Z, Fillmore CM, Hammerman PS, Kim CF, Wong KK. Non-small-cell lung cancers: a heterogeneous set of diseases. Nat Rev Cancer. 2014; 14:535–546.
4. Goldstraw P, Ball D, Jett JR, Le Chevalier T, Lim E, Nicholson AG, Shepherd FA. Non-small-cell lung cancer. Lancet. 2011; 378:1727–1740.
5. Olaussen KA, Mountzios G, Soria JC. ERCC1 as a risk stratifier in platinum-based chemotherapy for nonsmall-cell lung cancer. Curr Opin Pulm Med. 2007; 13:284–289.
6. Zheng Z, Chen T, Li X, Haura E, Sharma A, Bepler G. DNA synthesis and repair genes RRM1 and ERCC1 in lung cancer. N Engl J Med. 2007; 356:800–808.
7. Rosell R, Skrzypski M, Jassem E, Taron M, Bartolucci R, Sanchez JJ, Mendez P, Chaib I, Perez-Roca L, Szymanowska A, Rzyman W, Puma F, Kobierska-Gulida G, et al. BRCA1: a novel prognostic factor in resected non-small-cell lung cancer. PLoS One. 2007; 2:e1129.
8. Timofeeva MN, Hung RJ, Rafnar T, Christiani DC, Field JK, Bickeboller H, Risch A, McKay JD, Wang Y, Dai J, Gaborieau V, McLaughlin J, Brenner D, et al. Influence of common genetic variation on lung cancer risk: meta-analysis of 14 900 cases and 29 485 controls. Hum Mol Genet. 2012; 21:4980–4995.
9. Glubb DM, Pare-Brunet L, Jantus-Lewintre E, Jiang C, Crona D, Etheridge AS, Mirza O, Zhang W, Seiser EL, Rzyman W, Jassem J, Auman T, Hirsch FR, et al. Functional FLT1 Genetic Variation is a Prognostic Factor for Recurrence in Stage I-III Non-Small-Cell Lung Cancer. J Thorac Oncol. 2015; 10:1067–1075.
10. Zhao X, Wang S, Wu J, Li X, Wang X, Gao Z, Wu W, Wang H, Wang J, Qian J, Ma K, Li H, Han B, et al. Association of TERT Polymorphisms with Clinical Outcome of Non-Small Cell Lung Cancer Patients. PLoS One. 2015; 10:e0129232.
11. Qian J, Liu H, Gu S, Wu Q, Zhao X, Wu W, Wang H, Wang J, Chen H, Zhang W, Wei Q, Jin L, Lu D. Genetic Variants of the MDM2 Gene Are Predictive of Treatment-Related Toxicities and Overall Survival in Patients With Advanced NSCLC. Clin Lung Cancer. 2015; 16:e37–53.
12. Hu L, Wu C, Zhao X, Heist R, Su L, Zhao Y, Han B, Cao S, Chu M, Dai J, Dong J, Shu Y, Xu L, et al. Genome-wide association study of prognosis in advanced non-small cell lung cancer patients receiving platinum-based chemotherapy. Clin Cancer Res. 2012; 18:5507–5514.
13. Ekhart C, Rodenhuis S, Smits PH, Beijnen JH, Huitema AD. An overview of the relations between polymorphisms in drug metabolising enzymes and drug transporters and survival after cancer drug treatment. Cancer Treat Rev. 2009; 35:18–31.
14. Yuan X, Wu H, Han N, Xu H, Chu Q, Yu S, Chen Y, Wu K. Notch signaling and EMT in non-small cell lung cancer: biological significance and therapeutic application. J Hematol Oncol. 2014; 7:87.
15. Takebe N, Nguyen D, Yang SX. Targeting notch signaling pathway in cancer: clinical development advances and challenges. Pharmacol Ther. 2014; 141:140–149.
16. Zhou X, Teng L, Wang M. Distinct prognostic values of four-Notch-receptor mRNA expression in ovarian cancer. Tumour Biol. 2015.
17. Chen F, Liu N. A 10-gene expression signature of Notch pathway predicts recurrence in ovarian carcinoma. Oncol Lett. 2015; 10:1704–1708.
18. Wu T, Jiao M, Jing L, Wang MC, Sun HF, Li Q, Bai YY, Wei YC, Nan KJ, Guo H. Prognostic value of Notch-1 expression in hepatocellular carcinoma: a meta-analysis. Onco Targets Ther. 2015; 8:3105–3114.
19. Qiu XX, Chen L, Wang CH, Lin ZX, Chen BJ, You N, Chen Y, Wang XF. The vascular Notch ligands delta-like ligand 4 (DLL4) and Jagged1 (JAG1) have opposing correlations with microvascularization but uniform prognostic effect in primary glioblastoma: a preliminary study. World Neurosurg. 2015.
20. Donnem T, Andersen S, Al-Shibli K, Al-Saad S, Busund LT, Bremnes RM. Prognostic impact of Notch ligands and receptors in nonsmall cell lung cancer: coexpression of Notch-1 and vascular endothelial growth factor-A predicts poor survival. Cancer. 2010; 116:5676–5685.
21. Ye YZ, Zhang ZH, Fan XY, Xu XL, Chen ML, Chang BW, Zhang YB. Notch3 overexpression associates with poor prognosis in human non-small-cell lung cancer. Med Oncol. 2013; 30:595.
22. Yuan X, Wu H, Xu H, Han N, Chu Q, Yu S, Chen Y, Wu K. Meta-analysis reveals the correlation of Notch signaling with non-small cell lung cancer progression and prognosis. Sci Rep. 2015; 5:10338.
23. Wang Y, Liu H, Ready NE, Su L, Wei Y, Christiani DC, Wei Q. Genetic variants in ABCG1 are associated with survival of non-small cell lung cancer patients. Int J Cancer. 2016.
24. Pedrosa AR, Graca JL, Carvalho S, Peleteiro MC, Duarte A, Trindade A. Notch signaling dynamics in the adult healthy prostate and in prostatic tumor development. Prostate. 2015.
25. Notch Signaling Exhibits a Tumor Suppressor Function in Gliomas. Cancer Discov. 2015.
26. Feng C, Xiong Z, Jiang H, Ding Q, Fang Z, Hui W. Genetic alteration in notch pathway is associated with better prognosis in renal cell carcinoma. BioFactors. 2015.
27. Weng MT, Tsao PN, Lin HL, Tung CC, Change MC, Chang YT, Wong JM, Wei SC. Hes1 Increases the Invasion Ability of Colorectal Cancer Cells via the STAT3-MMP14 Pathway. PLoS One. 2015; 10:e0144322.
28. Zhang W, Liu H, Liu Z, Zhu D, Amos CI, Fang S, Lee JE, Wei Q. Functional Variants in Notch Pathway Genes NCOR2, NCSTN, and MAML2 Predict Survival of Patients with Cutaneous Melanoma. Cancer Epidemiol Biomarkers Prev. 2015; 24:1101–1110.
29. Ma B, Ma Q, Jin C, Wang X, Zhang G, Zhang H, Seeger H, Mueck AO. ADAM12 expression predicts clinical outcome in estrogen receptor-positive breast cancer. Int J Clin Exp Pathol. 2015; 8:13279–13283.
30. Vlad C, Kubelac P, Onisim A, Irimie A, Achimas-Cadariu P. The role of CDCP1 (CUB domain-containing protein 1) and ADAM12 (a disintegrin and metalloproteinase 12) in ovarian cancer. J BUON. 2015; 20:673–679.
31. Cheon DJ, Li AJ, Beach JA, Walts AE, Tran H, Lester J, Karlan BY, Orsulic S. ADAM12 is a prognostic factor associated with an aggressive molecular subtype of high-grade serous ovarian carcinoma. Carcinogenesis. 2015; 36:739–747.
32. Shimura T, Dagher A, Sachdev M, Ebi M, Yamada T, Yamada T, Joh T, Moses MA. Urinary ADAM12 and MMP-9/NGAL complex detect the presence of gastric cancer. Cancer Prev Res (Phila). 2015; 8:240–248.
33. Li Z, Wang Y, Kong L, Yue Z, Ma Y, Chen X. Expression of ADAM12 is regulated by E2F1 in small cell lung cancer. Oncol Rep. 2015.
34. Cheng YC, Huang YC, Yeh TH, Shih HY, Lin CY, Lin SJ, Chiu CC, Huang CW, Jiang YJ. Deltex1 is inhibited by the Notch-Hairy/E(Spl) signaling pathway and induces neuronal and glial differentiation. Neural Dev. 2015; 10:28.
35. Zhang P, Yang Y, Nolo R, Zweidler-McKay PA, Hughes DP. Regulation of NOTCH signaling by reciprocal inhibition of HES1 and Deltex 1 and its role in osteosarcoma invasiveness. Oncogene. 2010; 29:2916–2926.
36. Xu Z, Taylor JA. SNPinfo: integrating GWAS and candidate gene information into functional SNP selection for genetic association studies. Nucleic Acids Res. 2009; 37:W600–605.
37. Yao X, Ireland SK, Pham T, Temple B, Chen R, Raj MH, Biliran H. TLE1 promotes EMT in A549 lung cancer cells through suppression of E-cadherin. Biochem Biophys Res Commun. 2014; 455:277–284.
38. Julian LM, Liu Y, Pakenham CA, Dugal-Tessier D, Ruzhynsky V, Bae S, Tsai SY, Leone G, Slack RS, Blais A. Tissue-specific targeting of cell fate regulatory genes by E2f factors. Cell Death Differ. 2015.
39. Chong JL, Wenzel PL, Saenz-Robles MT, Nair V, Ferrey A, Hagan JP, Gomez YM, Sharma N, Chen HZ, Ouseph M, Wang SH, Trikha P, Culp B, et al. E2f1-3 switch from activators in progenitor cells to repressors in differentiating cells. Nature. 2009; 462:930–934.
40. Mabie J, Riley T, Marcus PM, Black A, Rozjabek H, Yu K, Young M, Austin J, Rathmell J, Williams C, Prorok PC. Data Processing and Analytic Support in the PLCO Cancer Screening Trial. Rev Recent Clin Trials. 2015; 10:233–237.
41. Gohagan JK, Prorok PC, Greenwald P, Kramer BS. The PLCO Cancer Screening Trial: Background, Goals, Organization, Operations, Results. Rev Recent Clin Trials. 2015; 10:173–180.
42. Oken MM, Marcus PM, Hu P, Beck TM, Hocking W, Kvale PA, Cordes J, Riley TL, Winslow SD, Peace S, Levin DL, Prorok PC, Gohagan JK, et al. Baseline chest radiograph for lung cancer detection in the randomized Prostate, Lung, Colorectal and Ovarian Cancer Screening Trial. J Natl Cancer Inst. 2005; 97:1832–1839.
43. Tryka KA, Hao L, Sturcke A, Jin Y, Wang ZY, Ziyabari L, Lee M, Popova N, Sharopova N, Kimura M, Feolo M. NCBI’s Database of Genotypes and Phenotypes: dbGaP. Nucleic Acids Res. 2014; 42:D975–979.
44. Mailman MD, Feolo M, Jin Y, Kimura M, Tryka K, Bagoutdinov R, Hao L, Kiang A, Paschall J, Phan L, Popova N, Pretel S, Ziyabari L, et al. The NCBI dbGaP database of genotypes and phenotypes. Nat Genet. 2007; 39:1181–1186.
45. Landi MT, Chatterjee N, Yu K, Goldin LR, Goldstein AM, Rotunno M, Mirabello L, Jacobs K, Wheeler W, Yeager M, Bergen AW, Li Q, Consonni D, et al. A genome-wide association study of lung cancer identifies a region of chromosome 5p15 associated with risk for adenocarcinoma. Am J Hum Genet. 2009; 85:679–691.
46. Genomes Project C, Abecasis GR, Auton A, Brooks LD, DePristo MA, Durbin RM, Handsaker RE, Kang HM, Marth GT, McVean GA. An integrated map of genetic variation from 1,092 human genomes. Nature. 2012; 491:56–65.
47. Nica AC, Dermitzakis ET. Expression quantitative trait loci: present and future. Philos Trans R Soc Lond B Biol Sci. 2013; 368:20120362.
48. Phillips C. Online resources for SNP analysis: a review and route map. Mol Biotechnol. 2007; 35:65–97.
49. Boyle AP, Hong EL, Hariharan M, Cheng Y, Schaub MA, Kasowski M, Karczewski KJ, Park J, Hitz BC, Weng S, Cherry JM, Snyder M. Annotation of functional variation in personal genomes using RegulomeDB. Genome Res. 2012; 22:1790–1797.
50. Aulchenko YS, Ripke S, Isaacs A and van Duijn CM. GenABEL: an R library for genome-wide association analysis. Bioinformatics. 2007; 23:1294–1296.
51. Benjamini Y, Hochberg Y. Controlling the False Discovery Rate - a Practical and Powerful Approach to Multiple Testing. J Roy Stat Soc B Met. 1995; 57:289–300.
52. Barrett JC, Fry B, Maller J, Daly MJ. Haploview: analysis and visualization of LD and haplotype maps. Bioinformatics. 2005; 21:263–265.
53. Pruim RJ, Welch RP, Sanna S, Teslovich TM, Chines PS, Gliedt TP, Boehnke M, Abecasis GR, Willer CJ. LocusZoom: regional visualization of genome-wide association scan results. Bioinformatics. 2010; 26:2336–2337.