
INTRODUCTION
The c-Jun NH2-terminal kinase (JNK) is a member of the mitogen-activated protein (MAP) kinase group of signaling proteins, which is encoded by two ubiquitously expressed genes (Jnk1 and Jnk2) and by a tissue-specific gene (Jnk3), restricted to brain, heart and testis [1]. JNK plays a role in phosphorylating proteins and participates in a variety of biological processes, including migration, proliferation, differentiation and apoptosis, following responses to various stress stimuli [2-4]. Mice with deficiency of both Jnk1 and Jnk2 are embryonic lethal and exhibit defective neural tube closure caused by deregulated neural apoptosis [5, 6].
Although mice bearing homozygous disruption of any single Jnk gene are viable due to the compensative roles of JNKs, Jnk1-deficient mice display degeneration of anterior commissure and disorganized neuronal microtubules [7], as well as abnormal dendritic architecture [8], suggesting an indispensable role of JNK1 in neural development. In neurons, JNK1 is a major MAP2 (MT-associated protein 2) kinase, thus Jnk1 deficiency results in hypophosphorylation and reduced ability of MAP2 to promote tubulin polymerization, associated with degeneration of microtubules [7]. Furthermore, JNK1 is mainly responsible for phosphorylation of the stathmin family microtubule-destabilizing protein SCG10 and suppresses its microtubule depolymerizing activity, contributing to microtubule homeostasis and axodendritic growth during brain development [9]. Maintenance of dendrite homeostasis is important for normal neuronal physiology, and dysregulation of dendritic structure is a hallmark of schizophrenia, autism and mental retardation syndromes, such as Rett syndrome and Down’s syndrome, in which abnormality in length and branching of dendritic arbors is observed [10-14]. Therefore, understanding the mechanisms of dendrite formation and homeostasis, which is related to JNK1, may provide important clues to the etiology of such diseases.
Induced pluripotent stem cells (iPSCs), derived from somatic cells by reprogramming with defined exogenous transcription factors [15, 16] and/or small molecular compounds [17, 18], maintain features similar to those of embryonic stem cells (ESCs). iPSCs have the ability to self-renew and generate various cell types in the body, indicating true pluripotency [19-21]. Therefore, iPSCs may represent an alternative to ESCs as a cell resource applied in regenerative therapy and provide an applicable platform to mimic the pathogenic process of diseases [22-26]. Herein, we established Jnk1-deficient (Jnk1 KO, Jnk1-/-) iPSCs from Jnk1 KO mouse tail-tip fibroblasts (TTFs) in an attempt to model the neural disease development, and interestingly found impaired ability of Jnk1 KO iPSCs in undergoing neural differentiation in vitro and in vivo, especially with defects in generation of neural precursors, compared with wild-type (WT) iPSCs.
RESULTS
Jnk1 deficiency enhances early induction of iPSCs
First, we isolated and generated TTFs from Jnk1 KO and WT C57BL/6 mice, and confirmed their genotypes by western blot (Figure 1A). Then, we generated iPSCs from Jnk1 KO and WT TTFs by retroviral transduction with four Yamanaka factors, Oct4, Sox2, Klf4 and c-Myc (OSKM) [15, 27]. Cells began to aggregate around day 3 post-infection, and colony aggregates formed on day 5, followed by plating on inactivated MEFs as feeders. ESC-like colonies, with a round shape and distinct edge, formed on day 10, regardless of Jnk1 deficiency (Figure 1B). The primary iPS clones showed alkaline phosphatase (AP)-positive staining (Figure 1C), and the percentage of AP-positive clones exhibited no significant difference between Jnk1 KO and WT cells (Figure 1D). We also examined endogenous expression of pluripotency-associated genes, en-Oct4 and Nanog, during reprogramming by quantitative real-time PCR (qPCR) analysis (Figure 1E). Expression levels of en-Oct4 and Nanog did not differ between WT cells on day 5 of induction and TTFs, whereas Jnk1 KO cells expressed higher levels of endo-Oct4 and Nanog than did WT cells, suggesting that Jnk1 deficiency promotes endogenous pluripotent genes reactivating early during somatic cell reprogramming.
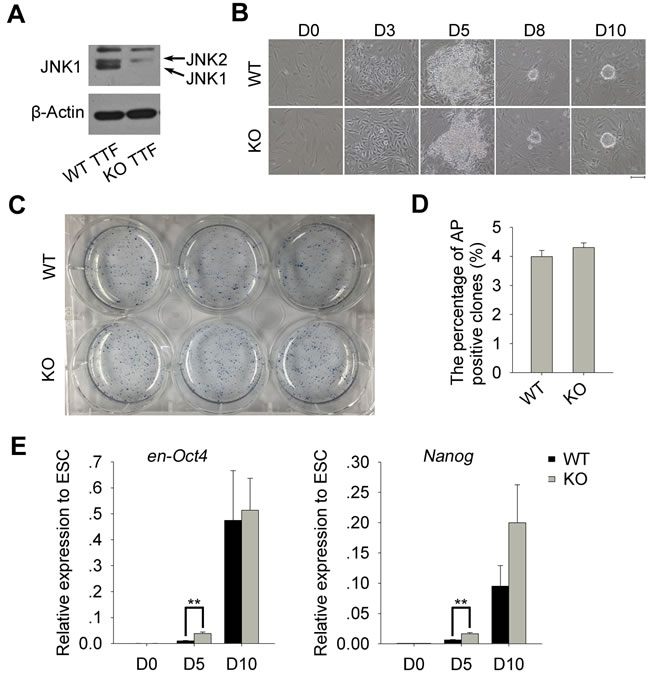
Figure 1: Derivation of iPSCs from Jnk1 KO and WT TTFs. A. Confirmation of JNK1 deficiency in Jnk1 KO TTFs by western blot. B. Morphological changes of TTFs during the induction of iPSCs and their primary ESC-like clones. Scale bar = 100 μm. C. The alkaline phosphatase (AP) staining of primary iPS clones derived from TTFs on day 13. D. Induction efficiency of primary iPS clones estimated by AP activity assay, based on number of cells (0.34×10⁴) per well plated on day 5. No statistical difference (P > 0.05) n = 3. E. Relative expression levels of reactivated endogenous pluripotency-associated genes, en-Oct4 and Nanog, during reprogramming by qPCR analysis. N33 ESCs served as positive control. **P < 0.01, n = 4.
Jnk1 KO iPSCs exhibit pluripotent stem cell properties
We obtained stably passaged iPSC lines generated from Jnk1 KO and WT TTFs. These stable iPSCs maintained characteristics of ESCs in morphology, displaying large nuclei and nucleoli under higher magnification with clear compact clonal boundaries, distinct from feeder fibroblasts (Figure 2A). Jnk1 deficiency was confirmed in Jnk1 KO iPSCs by western blot (Figure 2B). Jnk1 KO iPSCs and WT iPSCs expressed similar high levels of endogenous Oct4 (en-Oct4) and Nanog shown by qPCR analysis (Figure 2C). The pluripotency of Jnk1 KO and WT iPSC clones also was confirmed by immunofluorescence assay, showing Oct4 and Nanog in the nuclei, and SSEA1 on the cell surface (Figure 2D). Furthermore, Jnk1 KO iPSCs displayed proliferation progression similar to that of WT iPSCs by cell-cycle analysis (Figure 2E), so did other Jnk1 KO and WT iPSC lines (Supplementary Figure 1). These data suggested that Jnk1 does not affect expression of pluripotency genes and proliferation of iPSCs.
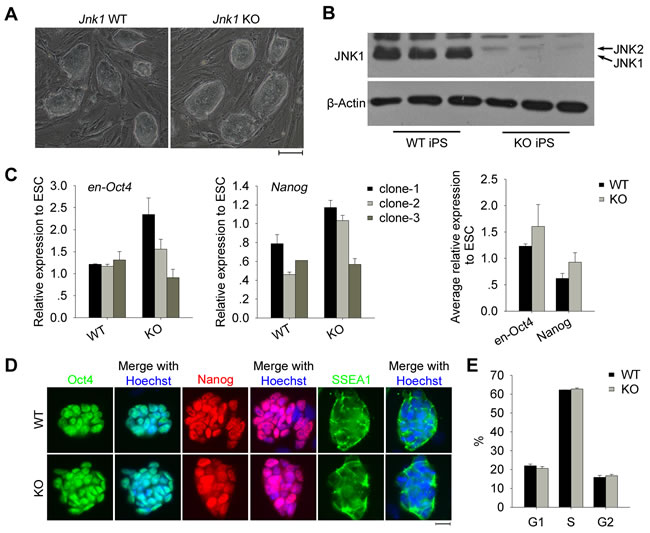
Figure 2: Characterization of Jnk1 KO iPSCs. A. Morphology of Jnk1 KO iPSCs and WT iPSCs. Scale bar = 100 μm. B. Confirmation of JNK1 deficiency in Jnk1 KO iPSCs by western blot. C. Relative expression levels of endogenous pluripotency-associated genes (en-Oct4 and Nanog) in iPSCs at passage 7 by qPCR analysis. N33 ESCs served as positive control. D. Immunofluorescence staining of pluripotency markers (Oct4, Nanog and SSEA1) in Jnk1 KO and WT iPSCs. Scale bar = 20 μm. E. Cell-cycle analysis by flow cytometry showed no significant difference between Jnk1 KO and WT iPSCs. n = 3.
Jnk1 KO iPSCs can differentiate into three embryonic germ layers in vitro and in vivo
To examine the developmental potential of Jnk1 KO iPSCs, we performed in vitro differentiation by standard embryoid body (EB) formation assay. Differentiation of Jnk1 KO and WT iPSCs via EB formation both yielded cells representing three embryonic germ layers as indicated by tissue-specific immunofluorescence staining of βIII-Tubulin (neurons, ectoderm), AFP (liver, endoderm) and α-SMA (cardiac muscle, mesoderm) (Figure 3A). The in vivo differentiation was tested by teratoma formation following transplantation into nude mice, and Jnk1 KO and WT iPSCs all formed teratomas (Figure 3B). The size and weight of teratomas derived from Jnk1 KO iPSCs were larger and heavier than those of WT iPSCs (Figure 3C), suggesting that Jnk1 KO iPSCs may have higher cell growth and proliferation in vivo differentiation. The teratomas of Jnk1 KO and WT iPSCs all displayed representative derivatives of three germ layers, including epidermis (ectoderm), cartilage (mesoderm) and gland epithelium (endoderm; Figure 3D). These in vitro and in vivo characterizations demonstrated that Jnk1 KO iPSCs closely resemble WT iPSCs in terms of pluripotency and differentiation potential.
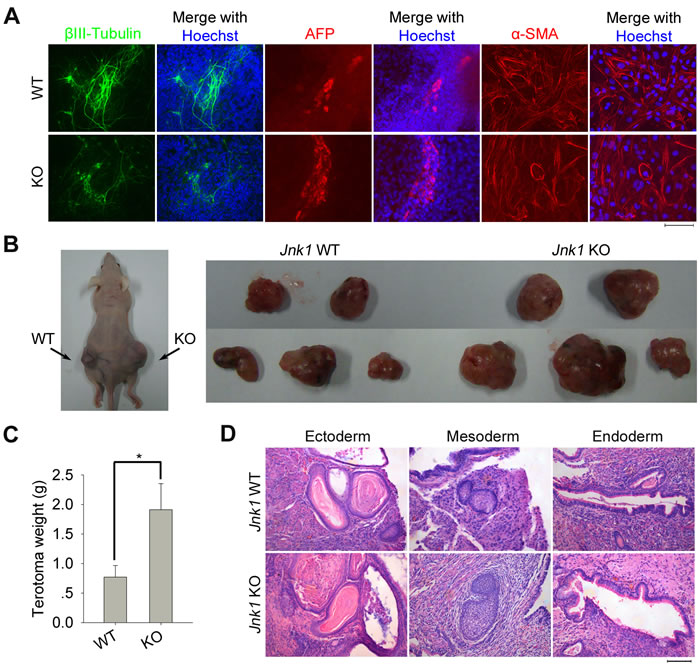
Figure 3: Differentiation of Jnk1 KO iPSCs in vitro and in vivo. A. Differentiation in vitro of Jnk1 KO and WT iPSCs by embryoid body (EB) formation. The differentiated derivatives consist of cells representing three embryonic germ layers as indicated by immunofluorescence staining of markers for ectoderm (βIII-Tubulin), endoderm (AFP) and mesoderm (α-SMA). Scale bar = 100 μm. B. Differentiation in vivo of Jnk1 KO and WT iPSCs by teratoma formation test following injection into nude mice. Black arrows indicate teratomas on the back of nude mice. C. The teratomas formed from Jnk1 KO iPSCs showed heavier than those of WT iPSCs by statistics. *P < 0.05, n = 5. D. Hematoxylin and eosin staining of teratoma tissues derived from Jnk1 KO and WT iPSCs. All teratomas consist of representative derivatives of three germ layers, including epidermis (ectoderm), cartilage (mesoderm) and gland epithelium (endoderm).
Jnk1 KO iPSCs exhibit defects in neural differentiation in vitro and particularly in generation of neural precursors
Using standard in vitro differentiation test by EB formation, we observed no noticeable effects of Jnk1 deficiency on size of EBs on day 4 (Figure 4A). We also measured expression of three embryonic germ layer marker genes at various time points during EB differentiation by qPCR analysis. Jnk1 deficiency did not impact expression levels of Sox17 and Gata4 (endoderm), nor that of T (Brachyury) and Flk1 (mesoderm; Supplementary Figure 2A and 2B). Furthermore, expression levels of Fgf5 (ectoderm) also showed no significant difference between Jnk1 KO EBs and WT EBs (Supplementary Figure 2C). However, Jnk1 deficiency resulted in significantly decreased expression of neural marker genes, Nestin and βIII-Tubulin (Figure 4B), consistent with immunostaining data of βIII-Tubulin shown above (Figure 3A). We also performed immunofluorescence analysis of Nestin in other Jnk1 KO iPSC and WT iPSC lines. Consistently, compared with WT iPSCs, which efficiently formed neural rosettes of Nestin on day 15, Jnk1 KO iPSCs exhibited reduced Nestin rosettes in EB differentiation (Figure 4C).
To further confirm the role of Jnk1 in neural differentiation, we generated a relatively homogenous population of neural precursors from both Jnk1 KO iPSCs and WT iPSCs based on a method of adherent monoculture published previously [28]. Expression of Nestin, marker of neural stem cells/precursors [29, 30], and Ngn2, which promotes neuronal differentiation of neural progenitor cells [31], was significantly reduced on day 4 during neural induction of Jnk1 KO iPSCs compared with that of WT iPSCs, by qPCR analysis (Figure 4D). In contrast to compact colonies of WT neural precursors expressing Nestin, Jnk1 KO iPSCs failed to efficiently form neural precursor colonies, with only sporadical expression of Nestin revealed by immunofluorescence microscopy (Figure 4E). These data indicate that Jnk1 deficiency reduces differentiation into neural precursors in vitro. We also measured expression of genes, JunD and Fra2, which are involved in JNK signalling pathway [32-34], by qPCR analysis (Supplementary Figure 3). The decreased expression of JunD and Fra2 during neural induction of Jnk1 KO iPSCs, suggested that JNK1 pathway was involved in the differentiation of iPSCs into early stage neural precursors.
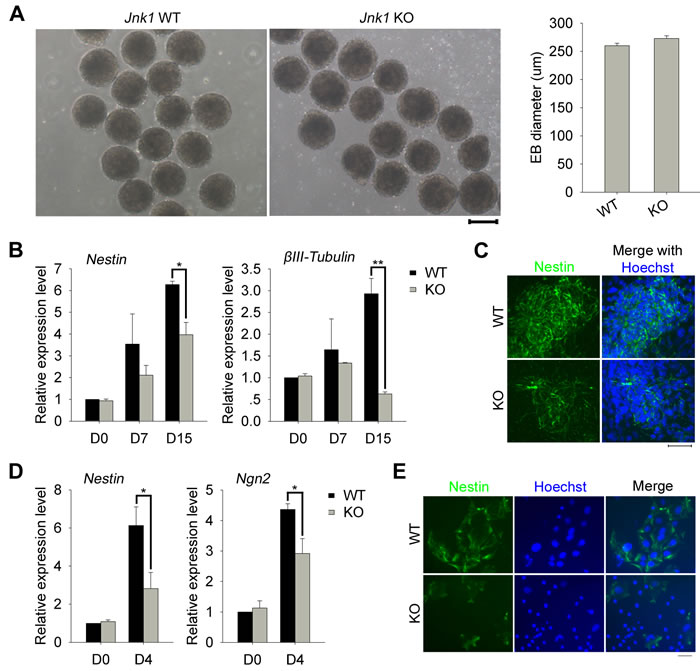
Figure 4: Jnk1 KO iPSCs exhibited defects in neural differentiation in vitro. A. Embryoid body (EB) formation of Jnk1 KO and WT iPSCs on day 4, and average size of EBs was calculated by ImageJ software. Scale bar = 200 μm. n = 40. B. Neural marker genes, Nestin and βIII-Tubulin, showed reduced expression in differentiation from Jnk1 KO iPSCs by qPCR analysis. n = 3. C. Immunofluorescence analysis of Nestin on day 15, using other Jnk1 KO iPSC and WT iPSC lines, confirmed reduced Nestin rosettes in the differentiation of Jnk1 KO iPSCs. Scale bar = 50 μm. D. qPCR analysis showed decreased expression levels of Nestin and Ngn2 on day 4 of neural induction from Jnk1 KO iPSCs compared with those of WT iPSCs. n = 4. E. Immunofluorescence analysis of Nestin on day 8 indicated impairment of forming neural precursor colonies from Jnk1 KO iPSCs. Scale bar = 50 μm. *P < 0.05, **P < 0.01, compared with WT controls.
Jnk1 KO iPSCs show impaired development of neural precursors in vivo
To validate the findings obtained by neural differentiation in vitro, we also tested neural differentiation in vivo by teratoma formation. The rosette neuroepitheliums in teratomas derived from Jnk1 KO iPSCs, exhibited a significantly decreased average size compared to that of WT iPSCs (Figure 5A and 5B). WT iPSCs efficiently generated regular large neural rosettes shown by immunofluorescence of Nestin, whereas Jnk1 KO iPSCs developed to smaller, irregular or uncompact neural rosettes (Figure 5C). Moreover, the percentage of Nestin positive cells in Nestin expressed areas of teratomas, derived from Jnk1 KO iPSCs, was reduced compared to that of WT iPSCs (Figure 5D), further supporting the notion that Jnk1 deficiency reduces formation of neural precursors in neuroepitheliums.
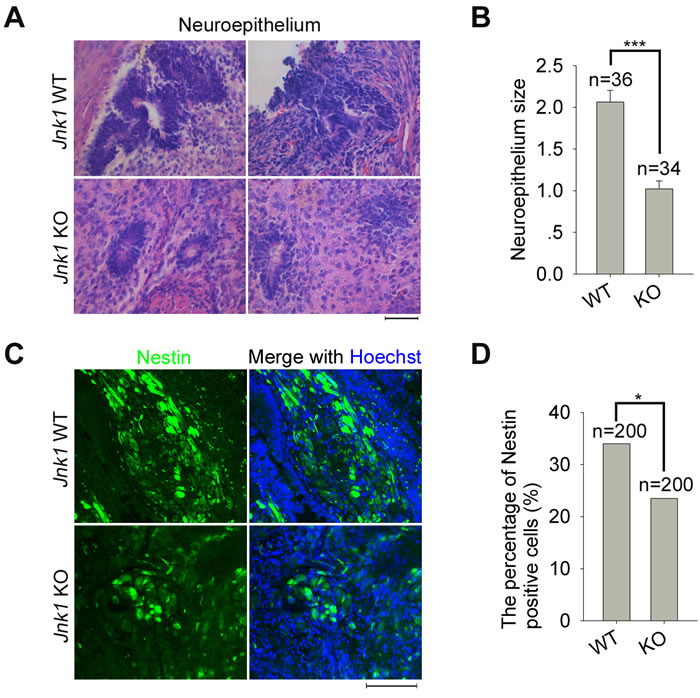
Figure 5: Jnk1 KO iPSCs showed impaired ability in development of neural precursors in vivo. A. Morphology of neuroepitheliums in teratomas generated from Jnk1 KO and WT iPSCs. Scale bar = 50 μm. B. The average size of neuroepitheliums calculated by ImageJ software showed decreased significantly in teratomas of Jnk1 KO iPSCs compared to those of WT iPSCs. n, number of neuroepitheliums counted. C. Immunofluorescence analysis of Nestin in teratomas of Jnk1 KO iPSCs and WT iPSCs. Scale bar = 100 μm. D. The percentage of Nestin positive cells in Nestin expressed areas reduced in teratomas of Jnk1 KO iPSCs. n, number of cells counted, based on 10 images of each group. χ2 test. *P < 0.05, ***P < 0.001, compared with WT controls.
DISCUSSION
We have established Jnk1 KO iPSCs from TTFs for modeling neural differentiation defects. The implication of iPSC induction from adult cells (here TTFs) is that these cells are readily accessible and thus can better fit to the purpose of clinical application, unlike embryonic fibroblasts (MEFs) which have to be isolated from fetus. A previous report showed that Jnk1 KO MEFs exhibit greater potency in increasing AP-positive iPSC colonies compared to that of WT MEFs [35]. The percentage of AP-positive clones induced from TTFs remained no significant difference between Jnk1 KO cells and WT cells. However we find that endogenous Oct4 and Nanog are reactivated earlier and expressed higher in the induction of Jnk1 KO iPSCs compared with that of WT iPSCs. These data together suggest a negative role of Jnk1 in iPSC reprogramming. A most recent report shows that RNAi mediated downregulation of JNK1 results in complete abrogation of hiPSC colony formation and emergence of partially reprogrammed colonies which are lost during the maturation stage of reprogramming [36]. In addition to the species differences, knockout in our cells completely deletes Jnk1, whereas shRNA-mediated knock-down strategy only partly reduces JNK1 expression and also may bring off-target effects.
Interestingly, we find that Jnk1 KO iPSCs suffer from defects in neural differentiation, especially in generation of neural precursors, although they possess normal pluripotent stem cell properties. Earlier, JNK also was found not required for self-renewal or proliferation of mouse ESCs, but required for lineage-specific differentiation [2, 37]. The cell number of embryoid bodies (EBs) derived from Jnk1 KO ESCs was similar to that of WT ESCs on day 3 of EB formation, but increased on day 8, suggesting a stage-specific role of Jnk1 in proliferation and that Jnk1 deficiency may enhance proliferation at late stage of differentiation [37]. We also find that the size of EBs does not differ between Jnk1 KO and WT cells on day 4 of differentiation, yet teratomas derived from Jnk1 KO iPSCs are larger than those of WT iPSCs by 4 weeks.
JNK binds to a large set of active promoters, which are enriched with binding motifs for the transcription factor NF-Y, and phosphorylates their histone H3 Ser10 (H3S10) during the conversion of stem cells into neurons, enhancing expression of target genes and neural differentiation [38]. Previous report indicated inhibited neurogenesis in Jnk1-deficient ESCs, with reduced expression of neuron marker, neurofilament light chain (NFLC) [39]. We find neural precursor/stem cell differentiation defects of Jnk1 KO iPSCs as shown by reduced expression levels of Nestin, marker of neural precursors [29, 30], and impaired rosette formation, indicating that Jnk1 deficiency inhibits the development of neural precursors. Furthermore, from the UCSC Genome Browser on Mouse, the promoter of Nestin possesses the JNK-bound NF-Y-like motif, suggesting that Jnk1 can increase the transcription of Nestin by activating its promoter activity.
In conclusion, by iPSC technology to model diseases using adult mouse cells with Jnk1 deficiency, we unexpectedly find a novel positive role of Jnk1 in the development of neural precursors/stem cells. While Jnk1 is dispensable for pluripotency maintaining and self-renewal of iPSCs, Jnk1 KO iPSCs exhibited defects in neural differentiation, especially generation of neural precursors, both in vitro and in vivo, providing a new model to further study the pathogenesis of JNK1-related neural diseases. However, the neural differentiation of Jnk1 KO iPSCs in our study remains at primary stage, which needs further lineage-directed differentiation into mature neurons to model the diseases.
MATERIALS AND METHODS
iPSC induction
The care and use of mice for this research were based on the guidelines and protocols for the animal research approved by the Institutional Animal Care and Use Committee (IACUC) of Nankai University.
Isolation and generation of Jnk1 KO and WT TTFs from C57BL/6 adult mouse tail-tips were performed as described previously [40]. iPSCs were induced by transduction with four Yamanaka factors using a standard protocol [41], with slight modification. Reprogrammed pluripotent cells can be isolated from genetically unmodified somatic donor cells solely based on morphological criteria [42]. Briefly, Plat-E cells were seeded at 5×10⁶ cells per 100-mm dish. On the next day, pMXs-based retroviral vectors (pMXs-Oct4, Sox2, Klf4 and c-Myc) were introduced into Plat-E cells using lipo-2000 transfection reagent according to the manufacturer’s recommendations. Viruses were collected through 0.45 μm filter membrane at 48 h and 72 h after transfection. For iPSC induction, TTFs were seeded at 4×10⁴ cells per well of six-well dish 24 h before infection, and were infected by fresh collected viruses twice at 24 h interval. From day 0 to day 2 post-infection, cells were cultured in ESC medium containing knock-out DMEM (Invitrogen) supplemented with 20% FBS (Hyclone), 1000 U/ml mouse leukemia inhibitory factor (LIF; ESG1107, Millipore), 0.1 mM non-essential amino acids, 0.1 mM b-mercaptoethanol, 1 mM L-glutamine, penicillin (100 U/ml) and streptomycin (100 mg/ml). And then 20% FBS was replaced with 20% knock-out serum replacement (Invitrogen) in medium to better reprogram cells. Five days after infection, the cells were passaged on MEF feeders and the medium was changed daily. Thirteen days after infection, ESC-like colonies were picked and passaged using standard protocols. For alkaline phosphatase (AP) assay, 3400 cells were plated in a six-well plate, and the positive colonies assessed using the Vector Blue Kit (SK-5300, Vector Laboratories).
iPSC and ESC culture
N33 ESC line was derived from C57BL/6 mice [40] and served as positive control. The ESC and iPSC culture medium consisted of knock-out DMEM (Invitrogen) with 20% FBS (Hyclone), 1000 U/ml mouse LIF (ESG1107, Millipore), 0.1 mM non-essential amino acids, 0.1 mM β-mercaptoethanol, 1 mM L-glutamine, penicillin (100 U/ml) and streptomycin (100 mg/ml). For culture of iPSCs and ESCs, the medium was changed daily, and cells were routinely passaged every two days.
Directed neural lineage differentiation
The directed neural lineage differentiation from iPSCs based on adherent monoculture was performed as described previously [28] with slight modification. Undifferentiated iPSCs were trypsin digested and plated onto 0.1% gelatin-coated six-well dish at a density of 1-2×10⁴/cm2 in normal iPSC culture medium. On the next day (day 0), when cells adhered to the dish, the medium was changed to N2B27 medium, which is a 1:1 mixture of DMEM/F12 (11330032, Life technologies) supplemented with N2 (17502048, Life technologies) and Neurobasal medium (12348017, Life technologies) supplemented with B27 (12587010, Life technologies), and added with 50 μg/ml bovine serum albumin (BSA; Sigma). Medium was renewed every two days.
Embryoid body formation test
iPSCs were removed off feeders twice based on their differences in the adherence to the bottom of dish. The cells were diluted to 4×10⁴ per milliliter and every 30 ml was pipetted to form a hanging drop on the cover of 100-mm dish. Embryoid bodies (EBs) formed on day 4, and then were transferred to six-well plates for adherent culture. EBs were fixed for immunofluorescence staining using markers of three embryonic germ layers on day 15.
Teratoma test
1×10⁶ iPSCs were injected subcutaneously into about 6-week-old immunodeficient nude mice. About 4 weeks after injection, the mice were humanely sacrificed, and the teratomas were excised, fixed in 4% paraformaldehyde, dehydrated in gradient ethanol, embedded in paraffin, and sectioned for histological examination by haematoxylin and eosin staining.
Gene expression analysis by quantitative real-time PCR
Total RNA was purified using a RNA mini kit (Qiagen), treated with DNase I (Qiagen), and the cDNA was generated from 2 g RNA using Oligo(dT) 18 primer (Takara) and M-MLV Reverse Transcriptase (Invitrogen). Real-time quantitative PCR reactions were set up in duplicate with the FS Universal SYBR Green Master (Roche) and carried out on an iCycler MyiQ2 Detection System (BIO-RAD). All reactions were carried out by amplifying target genes and internal control gene (GAPDH) in the same plate. The amplification was performed for primary denaturation at 95 °C for 10 min, then 40 cycles of denaturation at 95 °C for 15 s, annealing and elongation at 58 °C for 1 min, and the last cycle under 55-95 °C for dissociation curve. Relative quantitative evaluation of target gene was determined by comparing the threshold cycles. Primers were confirmed their specificity with dissociation curves. Most primers were designed using the IDT DNA website and primers used are listed in Supplementary Table S1.
Western blot
Cells were washed twice in PBS, collected, and lysed in cell lysis buffer on ice for 30 min and then sonicated for 1 min at 60 of amplitude with 2 s intervals. After centrifugation at 10,000 g, 4 °C for 10 min, supernatant was transferred into new tubes. The concentration of the protein sample was measured by bicinchoninic acid, and then protein samples were boiled in SDS Sample Buffer at 99 °C for 10 min. 20 μg total proteins of each cell extracts were resolved by 10% Bis-Tris SDS-PAGE and transferred to polyvinylidene difluoride membranes (PVDF; Millipore). Nonspecific binding was blocked by incubation in 5% skim milk in TBST at room temperature for 2 h. Blots were then probed with primary antibodies, JNK1 (SGA0288, Sungene) and β-Actin (P30002, Abmart) by overnight incubation at 4 °C in 5% skim milk in TBST. Immunoreactive bands were then probed for 2 h at room temperature with the appropriate horseradish peroxidase (HRP)-conjugated secondary antibodies, anti-Rabbit IgG-HRP (NA934V, GE Healthcare). Protein bands were detected by Chemiluminescent HRP substrate (WBKLS0500, Millipore).
Immunofluorescence microscopy
Cells or tissue sections were washed twice in PBS, fixed in freshly prepared 3.7% paraformaldehyde for 30 min at 4 °C, washed once in PBS and permeabilized in 0.1% Triton X-100 in blocking solution (3% goat serum plus 0.1% BSA in PBS) for 30 min at room temperature, then washed once in PBS, and left in blocking solution for 2 h. Cells were incubated overnight at 4 °C with primary antibodies against Oct4 (sc5279, Santa Cruz), Nanog (ab80892, Abcam), SSEA-1 (MAB4301, Millipore), βIII-Tubulin (CBL412, Chemicon), alpha 1-fetoprotein (AFP; DAK-N1501, Dako), alpha smooth muscle actin (α-SMA; ab5694-100, Abcam) and Nestin (MAB353, Millipore). Then cells were washed three times (each for 15 min) with blocking solution, and incubated for 2 h with secondary antibodies at room temperature. Goat Anti-Mouse IgG (H+L) FITC (115-095-003, Jackson) and Goat Anti-Rabbit IgG (H+L) Alexa Fluor® 594 (111-585-003, Jackson), diluted 1:200 with blocking solution, were used. Samples were washed, and counterstained with 0.5 mg/ml Hoechst 33342 (H1398, MP) in Vectashield mounting medium. Fluorescence was detected and imaged using a Zeiss Axio-Imager Z1 fluorescence microscope.
Cell-cycle analysis
Single-cell suspensions were prepared by trypsinization and washed once in cold PBS. iPSCs were fixed in ice-cold 70% (vol/vol) ethanol and incubated overnight at 4 °C. Following RNase A treatment, total DNA was stained with propidium iodide (Beyotime) at 37 °C for 30 min. Cells were analyzed with a Flow Cytometer (BD FACS Calibur) and the data were processed using FlowJo.
Statistical analysis
All results were analyzed by student’s t-test or χ2 test (specially mentioned) and the resulting P-values were shown. Significant differences were defined as *P < 0.05, **P < 0.01, or ***P < 0.001. The results were shown as mean ± SEM.
ACKNOWLEDGMENTS
This work was supported by the MOST National Key Basic Research Program (2012CB911202), Program of International S&T Cooperation (2014DFA30450), and National Natural Science Foundation of China (31271587).
CONFLICTS OF INTEREST
The authors declare no conflicts of interest.
REFERENCES
1. Davis RJ. Signal transduction by the JNK group of MAP kinases. Cell. 2000; 103: 239-252.
2. Binetruy B, Heasley L, Bost F, Caron L, and Aouadi M. Concise review: regulation of embryonic stem cell lineage commitment by mitogen-activated protein kinases. Stem Cells. 2007; 25: 1090-1095.
3. Pearson G, Robinson F, Beers Gibson T, Xu BE, Karandikar M, Berman K, and Cobb MH. Mitogen-activated protein (MAP) kinase pathways: regulation and physiological functions. Endocr Rev. 2001; 22: 153-183.
4. Kyriakis JM and Avruch J. Mammalian mitogen-activated protein kinase signal transduction pathways activated by stress and inflammation. Physiol Rev. 2001; 81: 807-869.
5. Kuan CY, Yang DD, Samanta Roy DR, Davis RJ, Rakic P, and Flavell RA. The Jnk1 and Jnk2 protein kinases are required for regional specific apoptosis during early brain development. Neuron. 1999; 22: 667-676.
6. Sabapathy K, Jochum W, Hochedlinger K, Chang L, Karin M, and Wagner EF. Defective neural tube morphogenesis and altered apoptosis in the absence of both JNK1 and JNK2. Mech Dev. 1999; 89: 115-124.
7. Chang L, Jones Y, Ellisman MH, Goldstein LS, and Karin M. JNK1 is required for maintenance of neuronal microtubules and controls phosphorylation of microtubule-associated proteins. Dev Cell. 2003; 4: 521-533.
8. Bjorkblom B, Ostman N, Hongisto V, Komarovski V, Filen JJ, Nyman TA, Kallunki T, Courtney MJ, and Coffey ET. Constitutively active cytoplasmic c-Jun N-terminal kinase 1 is a dominant regulator of dendritic architecture: role of microtubule-associated protein 2 as an effector. J Neurosci. 2005; 25: 6350-6361.
9. Tararuk T, Ostman N, Li W, Bjorkblom B, Padzik A, Zdrojewska J, Hongisto V, Herdegen T, Konopka W, Courtney MJ, and Coffey ET. JNK1 phosphorylation of SCG10 determines microtubule dynamics and axodendritic length. J Cell Biol. 2006; 173: 265-277.
10. Rosoklija G, Toomayan G, Ellis SP, Keilp J, Mann JJ, Latov N, Hays AP, and Dwork AJ. Structural abnormalities of subicular dendrites in subjects with schizophrenia and mood disorders: preliminary findings. Arch Gen Psychiatry. 2000; 57: 349-356.
11. Kaufmann WE and Moser HW. Dendritic anomalies in disorders associated with mental retardation. Cereb Cortex. 2000; 10: 981-991.
12. Broadbelt K, Byne W, and Jones LB. Evidence for a decrease in basilar dendrites of pyramidal cells in schizophrenic medial prefrontal cortex. Schizophr Res. 2002; 58: 75-81.
13. Zoghbi HY. Postnatal neurodevelopmental disorders: meeting at the synapse? Science. 2003; 302: 826-830.
14. Mukaetova-Ladinska EB, Arnold H, Jaros E, Perry R, and Perry E. Depletion of MAP2 expression and laminar cytoarchitectonic changes in dorsolateral prefrontal cortex in adult autistic individuals. Neuropathol Appl Neurobiol. 2004; 30: 615-623.
15. Takahashi K and Yamanaka S. Induction of pluripotent stem cells from mouse embryonic and adult fibroblast cultures by defined factors. Cell. 2006; 126: 663-676.
16. Wernig M, Meissner A, Foreman R, Brambrink T, Ku M, Hochedlinger K, Bernstein BE, and Jaenisch R. In vitro reprogramming of fibroblasts into a pluripotent ES-cell-like state. Nature. 2007; 448: 318-324.
17. Huangfu D, Maehr R, Guo W, Eijkelenboom A, Snitow M, Chen AE, and Melton DA. Induction of pluripotent stem cells by defined factors is greatly improved by small-molecule compounds. Nat Biotechnol. 2008; 26: 795-797.
18. Hou P, Li Y, Zhang X, Liu C, Guan J, Li H, Zhao T, Ye J, Yang W, Liu K, Ge J, Xu J, Zhang Q, et al. Pluripotent stem cells induced from mouse somatic cells by small-molecule compounds. Science. 2013; 341: 651-654.
19. Jaenisch R and Young R. Stem cells, the molecular circuitry of pluripotency and nuclear reprogramming. Cell. 2008; 132: 567-582.
20. Zhao XY, Li W, Lv Z, Liu L, Tong M, Hai T, Hao J, Guo CL, Ma QW, Wang L, Zeng F, and Zhou Q. iPS cells produce viable mice through tetraploid complementation. Nature. 2009; 461: 86-90.
21. Boland MJ, Hazen JL, Nazor KL, Rodriguez AR, Gifford W, Martin G, Kupriyanov S, and Baldwin KK. Adult mice generated from induced pluripotent stem cells. Nature. 2009; 461: 91-94.
22. Pomp O and Colman A. Disease modelling using induced pluripotent stem cells: status and prospects. Bioessays. 2013; 35: 271-280.
23. Takahashi K and Yamanaka S. Induced pluripotent stem cells in medicine and biology. Development. 2013; 140: 2457-2461.
24. Cherry AB and Daley GQ. Reprogrammed cells for disease modeling and regenerative medicine. Annu Rev Med. 2013; 64: 277-290.
25. Liu GH, Qu J, Suzuki K, Nivet E, Li M, Montserrat N, Yi F, Xu X, Ruiz S, Zhang W, Wagner U, Kim A, Ren B, et al. Progressive degeneration of human neural stem cells caused by pathogenic LRRK2. Nature. 2012; 491: 603-607.
26. Fu L, Xu X, Ren R, Wu J, Zhang W, Yang J, Ren X, Wang S, Zhao Y, Sun L, Yu Y, Wang Z, Yang Z, et al. Modeling xeroderma pigmentosum associated neurological pathologies with patients-derived iPSCs. Protein Cell. 2016; 7: 210-221.
27. Wang F, Yin Y, Ye X, Liu K, Zhu H, Wang L, Chiourea M, Okuka M, Ji G, Dan J, Zuo B, Li M, Zhang Q, et al. Molecular insights into the heterogeneity of telomere reprogramming in induced pluripotent stem cells. Cell Res. 2012; 22: 757-768.
28. Ying QL, Stavridis M, Griffiths D, Li M, and Smith A. Conversion of embryonic stem cells into neuroectodermal precursors in adherent monoculture. Nat Biotechnol. 2003; 21: 183-186.
29. Lendahl U, Zimmerman LB, and McKay RD. CNS stem cells express a new class of intermediate filament protein. Cell. 1990; 60: 585-595.
30. Ramasamy S, Narayanan G, Sankaran S, Yu YH, and Ahmed S. Neural stem cell survival factors. Arch Biochem Biophys. 2013; 534: 71-87.
31. Imayoshi I and Kageyama R. bHLH factors in self-renewal, multipotency, and fate choice of neural progenitor cells. Neuron. 2014; 82: 9-23.
32. Ventura JJ, Kennedy NJ, Lamb JA, Flavell RA, and Davis RJ. c-Jun NH(2)-terminal kinase is essential for the regulation of AP-1 by tumor necrosis factor. Mol Cell Biol. 2003; 23: 2871-2882.
33. Shaulian E and Karin M. AP-1 as a regulator of cell life and death. Nat Cell Biol. 2002; 4: E131-136.
34. Karin M. The regulation of AP-1 activity by mitogen-activated protein kinases. J Biol Chem. 1995; 270: 16483-16486.
35. Yao K, Ki MO, Chen H, Cho YY, Kim SH, Yu DH, Lee SY, Lee KY, Bae K, Peng C, Lim do Y, Bode AM, and Dong Z. JNK1 and 2 play a negative role in reprogramming to pluripotent stem cells by suppressing Klf4 activity. Stem Cell Res. 2014; 12: 139-152.
36. Neganova I, Shmeleva E, Munkley J, Chichagova V, Anyfantis G, Anderson R, Passos J, Elliott DJ, Armstrong L, and Lako M. JNK/SAPK Signaling Is Essential for Efficient Reprogramming of Human Fibroblasts to Induced Pluripotent Stem Cells. Stem Cells. 2016; 34: 1198-1212.
37. Xu P and Davis RJ. c-Jun NH2-terminal kinase is required for lineage-specific differentiation but not stem cell self-renewal. Mol Cell Biol. 2010; 30: 1329-1340.
38. Tiwari VK, Stadler MB, Wirbelauer C, Paro R, Schubeler D, and Beisel C. A chromatin-modifying function of JNK during stem cell differentiation. Nat Genet. 2012; 44: 94-100.
39. Amura CR, Marek L, Winn RA, and Heasley LE. Inhibited neurogenesis in JNK1-deficient embryonic stem cells. Mol Cell Biol. 2005; 25: 10791-10802.
40. Huang J, Wang F, Okuka M, Liu N, Ji G, Ye X, Zuo B, Li M, Liang P, Ge WW, Tsibris JC, Keefe DL, and Liu L. Association of telomere length with authentic pluripotency of ES/iPS cells. Cell Res. 2011; 21: 779-792.
41. Okita K, Ichisaka T, and Yamanaka S. Generation of germline-competent induced pluripotent stem cells. Nature. 2007; 448: 313-317.
42. Meissner A, Wernig M, and Jaenisch R. Direct reprogramming of genetically unmodified fibroblasts into pluripotent stem cells. Nat Biotechnol. 2007; 25: 1177-1181.