
INTRODUCTION
Subunits of SWI/SNF are frequently inactivated in a variety of cancer types [1, 2]. In particular, AT-rich interactive domain-containing protein 1A (ARID1A) is the most frequently mutated SWI/SNF subunit in cancer [2], with the highest mutation frequency in gynecologic cancers, i.e. ovarian clear cell carcinomas, ovarian endometrioid carcinomas, and endometrial endometrioid carcinomas [3–7]. Recent studies demonstrated that ARID1A has tumor suppressive functions, such as regulation of epithelial-mesenchymal transition, p53 activity, the PI3K pathway, EZH2 targets, and DNA repair [8–13]. Although it has been demonstrated that ARID1A deficiency leads to sensitization to several inhibitors [10, 11, 13], therapeutic strategies that target ARID1A-mutant cancers remain limited.
Compared with normal cells, cancer cells have higher levels of intracellular reactive oxygen species (ROS) due to aberrant metabolic activity, oncogene activation, and the tumor microenvironment [14–17]. Although a moderate increase in ROS level can promote cell proliferation and survival [18–21], high ROS levels lead to activation of senescence and cell death [22–25]. To prevent intracellular levels of ROS from reaching toxic levels, cancer cells are dependent on an up-regulated antioxidant system and sensitive to further increases in ROS levels [14–16]. Several studies have demonstrated that treatment with agents that increase ROS can inhibit growth and induce apoptosis in cancer cells [26–29]. However, what predicts the sensitivity of cancer cells to ROS-inducing agents is not completely clear.
Previous studies demonstrated that SWI/SNF is required for oxidative stress resistance in different model organisms. In Caenorhabditis elegans, SWI/SNF is a co-factor for DAF-16 and required for DAF-16 functions, including longevity and resistance to oxidative stress [30]. In Saccharomyces cerevisiae, a genetic screen revealed that deletion of several SWI/SNF subunits resulted in increased sensitivity to oxidative stress [31]. Given that SWI/SNF is evolutionary conserved across several species, it is possible that SWI/SNF is also required for oxidative stress resistance in mammalian cells.
In this study, we sought to determine whether loss of ARID1A expression leads to increased sensitivity to a particular drug. We analyzed the Genomics of Drug Sensitivity in Cancer (GDSC) database [32] and found that ARID1A-mutant cancer cell lines were more sensitive to the ROS-inducing agent elesclomol than were ARID1A-wildtype cancer cell lines. Using gynecologic cancer cells, we validated that ARID1A deficiency led to increased sensitivity to treatment with elesclomol. Subsequently, we found that loss of ARID1A was associated with increased oxidative stress in vitro and in ovarian clear cell carcinoma patient samples. Taken together, our findings suggest that ARID1A protects cells against oxidative stress and ROS-inducing agents may be used to target ARID1A-mutant gynecologic cancer cells.
RESULTS
ARID1A-mutant cancer cell lines are more sensitive than ARID1A-wildtype cancer cell lines to treatment with the ROS-inducing agent elesclomol
To identify drug targets for ARID1A-mutant cancer cells, we analyzed the publicly available GDSC drug database [32] and compared the drug sensitivities of ARID1A-mutant and ARID1A-wildtype cancer cell lines. The GDSC database contains drug responses of more than 700 cancer cell lines of different cancer types to about 140 drugs. First, we determined the ARID1A mutation statuses of all the cancer cell lines using the Cancer Cell Line Encyclopedia database [33]. We excluded cell lines with no mutation or copy number alteration data from further analysis. We placed the remaining cell lines into ARID1A-wildtype (no detectable ARID1A mutations, n = 347) and ARID1A-mutant (ARID1A nonsense mutations, frameshift mutations, or deep deletions, n = 74) groups. We also excluded cell lines with ARID1A missense mutations, in-frame insertions/deletions, or splicing mutations from further analysis because the effect of these mutations on ARID1A protein expression and function is unclear.
The majority of drugs that exhibited significant differences (P < 0.05) in sensitivity between ARID1A-mutant and ARID1A-wildtype cancer cell lines were enriched in 1) inhibitors of the PI3K/AKT pathway (AZD8055, NVP-BEZ235, MK-2206, and GDC-0941) or 2) agents that induce DNA damage or inhibit the DNA damage response (cisplatin, KU-55933, and NU-7441) (Table 1). We noted that these enrichments are consistent with previously published data that ARID1A deficiency resulted in increased sensitivity to PI3K/AKT inhibitors [10] and agents that induce DNA double-strand breaks [12, 13].
Table 1: Drugs that exhibited significantly lower IC50 values in ARID1A-mutant cancer cell lines than in ARDI1A-wildtype cancer cell lines
Rank |
Drug |
Drug target |
T-test |
P-value |
FDR (BH) |
|---|---|---|---|---|---|
1 |
Elesclomol |
Induced ROS accumulation |
-5.0349 |
0.001996 |
0.1317 |
2 |
AZD8055 |
mTORC1/2 |
-4.9625 |
0.001996 |
0.1317 |
3 |
NVP-BEZ235 |
PI3K (class 1) and mTORC1/2 |
-3.4664 |
0.009980 |
0.2196 |
4 |
EHT 1864 |
Rac GTPases |
-3.2140 |
0.003992 |
0.1756 |
5 |
MK-2206 |
AKT1/2 |
-2.9551 |
0.007984 |
0.2196 |
6 |
GW 441756 |
NTRK1 |
-2.9503 |
0.009980 |
0.2196 |
7 |
KU-55933 |
ATM |
-2.8451 |
0.013970 |
0.2635 |
8 |
NU-7441 |
DNAPK |
-2.6382 |
0.015970 |
0.2635 |
9 |
GDC0941 |
PI3K (class 1) |
-2.6177 |
0.021960 |
0.3220 |
10 |
Cisplatin |
DNA cross-linker |
-2.2678 |
0.037920 |
0.4172 |
11 |
BIBW2992 |
EGFR and ERBB2 |
-2.2154 |
0.031940 |
0.3832 |
Abbreviations: FDR, false discovery rate; BH, Benjamini-Hochberg procedure.
Interestingly, we found that elesclomol, which potently induces ROS formation by disrupting the electron transport chain in the mitochondria [34], exhibited the greatest difference in sensitivity between the ARID1A-mutant and ARID1A-wildtype cancer cell lines (Table 1). As it has not been demonstrated that ARID1A is required to protect cells against oxidative stress in mammalian cells, we decided to focus on elesclomol for further validation.
Elesclomol inhibits growth and induces apoptosis more potently in ARID1A-mutant than ARID1A-wildtype ovarian cancer lines
To validate the findings from the GDSC database, we examined a panel of 14 ovarian and endometrial cancer cell lines. We first determined ARID1A mutation statuses in these cell lines using the Cancer Cell Line Encyclopedia database [33], DNA sequencing, and western blot analysis (Table 2 and Figure 1a). We found that the ARID1A-mutant cancer cell lines had significantly lower IC50s of elesclomol than did the ARID1A-wildtype cancer cell lines (P = 0.034) (Figures 1b and 1c). Interestingly, we noted that ARID1A-wildtype COV362 cells were very sensitive to treatment with elesclomol, which may be due to harboring a truncating mutation in BRCA1. A previous study has demonstrated that loss of BRCA1 results in increased ROS accumulation and sensitivity to oxidative stress in breast cancer cells [35]. Treatment with elesclomol at 10 and 20 nM also induced apoptosis more potently in ARID1A-mutant cancer cells than in ARID1A-wildtype cancer cells (P = 0.0227 and P = 0.0057, respectively) (Figure 1d). We confirmed that elesclomol exerted its effects through increasing ROS as addition of the antioxidant N-acetyl-L-cysteine (NAC) could abrogate the effects of elesclomol (Figure 2). Taken together, these results demonstrated that ARID1A-mutant cancer cell lines are more sensitive to treatment with elesclomol.
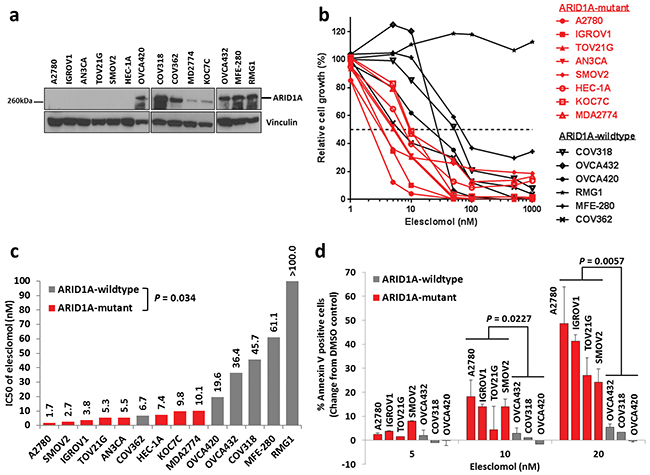
Figure 1: ARID1A-mutant cancer cell lines are more sensitive to treatment with the ROS-inducing agent elesclomol than ARID1A-wildtype cells. a. Western blot analysis of ARID1A protein expression in a panel of 14 endometrial and ovarian cancer cell lines. b. Cell growth of endometrial and ovarian cancer cell lines treated with elesclomol for 72 h as measured using the WST-1 assay. Cell growth was quantified relative to DMSO treated controls. c. IC50 values of elesclomol in the cell lines in b. d. Apoptosis of ARID1A-mutant and ARID1A-wildtype cells treated with elesclomol for 72 h as measured using annexin-V and PI staining.
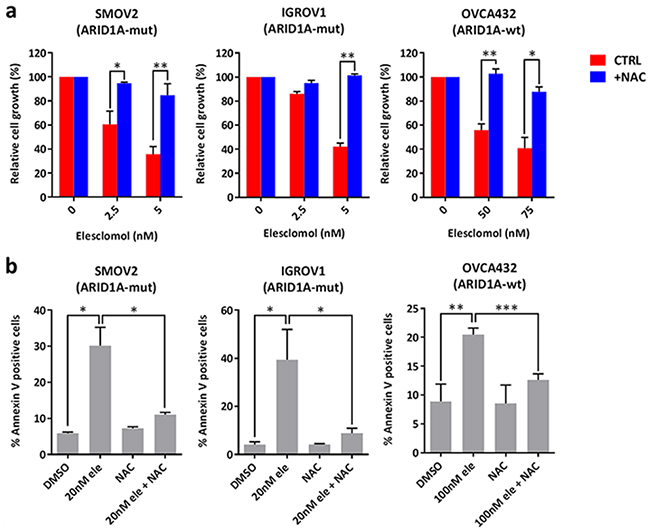
Figure 2: Treatment with elesclomol inhibits cancer cell growth and induces apoptosis by increasing ROS levels. a. Cell growth of SMOV2, IGROV1, and OVCA432 ovarian cancer cells treated with elesclomol in the presence or absence of the antioxidant NAC for 72 h. Cell growth was measured using the WST-1 assay and quantified relative to DMSO treated controls. b. Apoptosis of SMOV2, IGROV1, and OVCA432 ovarian cancer cells treated with elesclomol (ele) for 72 h in the presence or absence of NAC for 72 h as measured using annexin-V and PI staining. *P < 0.05; **P < 0.01; ***P < 0.001.
Table 2: ARID1A mutation statuses and ARID1A protein expression in a panel of ovarian and endometrial cancer cell lines
Cell line |
Cancer type |
ARID1A mutation |
ARID1A protein expression |
|---|---|---|---|
A2780 |
Ovarian |
Q1430*a, R1721fsa |
Absent |
IGROV1 |
Ovarian |
M274fsa,b, G1847fsa,b |
Absent |
AN3CA |
Endometrial |
G1848fsa |
Absent |
TOV21G |
Ovarian |
Q548fsa,b, N756fsa,b |
Absent |
SMOV2 |
Ovarian |
G1740fsb |
Absent |
HEC-1A |
Endometrial |
Q404Ha, Q1761Ca, Q1835*a, Q2115*a |
Absent |
KOC7C |
Ovarian |
G276fsb, P1326fsb, A1517fsb |
Absent |
MDA2774 |
Ovarian |
Q1947*b |
Absent |
COV362 |
Ovarian |
Wild-typea |
Present |
OVCA420 |
Ovarian |
ND |
Present |
COV318 |
Ovarian |
Wild-typea |
Present |
OVCA432 |
Ovarian |
ND |
Present |
MFE-280 |
Endometrial |
Wild-typea |
Present |
RMG1 |
Ovarian |
Wild-typea,b |
Present |
Abbreviation: aMutation status identified in the Cancer Cell Line Encyclopedia database. bMutation status identified in Sanger sequencing performed in this study. ND, not determined. Fs, frame-shift mutation. *, non-sense mutation.
Knockdown of ARID1A expression increases the sensitivity of ovarian cancer cells to treatment with elesclomol
Next, we asked that whether loss of ARID1A expression is responsible for increased sensitivity to treatment with elesclomol. We found that depletion of ARID1A using siRNA in ARID1A-wildtype RMG1 and OVCA432 ovarian cancer cells resulted in increased sensitivity to elesclomol (Figure 3a). Although RMG1 cells were intrinsically highly resistant to treatment with elesclomol, depletion of ARID1A sensitized the cells to elesclomol in the micro-molar range (Figure 3a). In addition, we found that knockdown of the SWI/SNF core subunits BRG1 and SNF5 also resulted in increased sensitivity to elesclomol in RMG1 cells (Figure 3b). Down-regulation of ARID1A, BRG1, and SNF5 expression by siRNA were confirmed by western blot (Figure 3c).
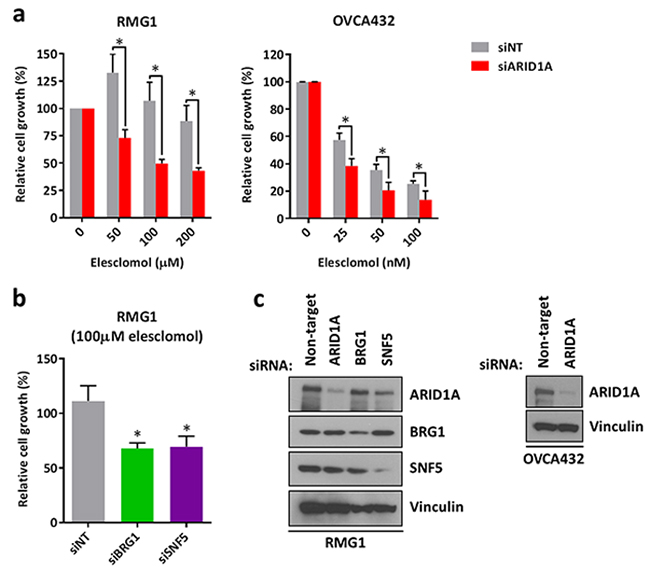
Figure 3: Knockdown of ARID1A expression in ARID1A-wildtype ovarian cancer cells results in increased sensitivity to treatment with elesclomol. a. Cell growth of ARID1A-wildtype RMG1 and OVCA432 cells transfected with ARID1A and non-target siRNA for 24 h and treated with elesclomol for 72 h. b. Cell growth of RMG1 cells after transfection with BRG1, SNF5, and non-target siRNA and treatment as in a. c. Western blot analysis of RMG1 and OVCA432 cells after transfection with ARID1A, BRG1, SNF5, and non-target siRNA for 48 h. Cell growth was measured using the WST-1 assay and quantified relative to DMSO treated controls. *P < 0.05.
To show that this effect was not limited to elesclomol, we also examined the sensitivity of these cells to treatment with another ROS-inducing agent, piperlongumine [27]. We found that ARID1A depletion in RMG1 cells also led to sensitization of the cells to piperlongumine (Supplementary Figure S1a and S1b). Similar to elesclomol, we found that piperlongumine inhibited growth by increasing ROS as treatment with NAC reversed the anti-proliferative effects of the drug (Supplementary Figure S1c).
Re-expression of ARID1A increases the resistance of ovarian cancer cells to treatment with elesclomol
To complement the siRNA experiments, we transiently re-expressed ARID1A in ARID1A-mutant TOV21G ovarian cancer cells and found that ARID1A re-expression resulted in increased resistance of the cells to treatment with elesclomol (Figure 4a and 4b). Western blot analysis confirmed that ARID1A was re-expressed in TOV21G cells after transfection with the pCI-neo-ARID1A vector (Figure 4c).
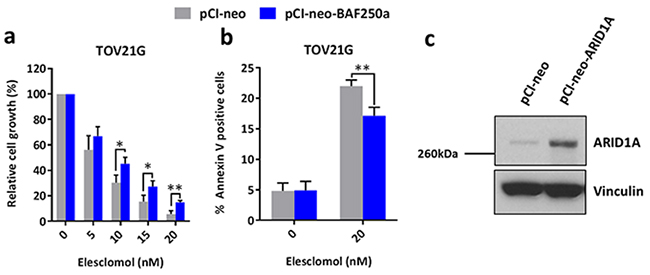
Figure 4: Re-expression of ARID1A in ARID1A-mutant ovarian cancer cells results in increased resistance to treatment with elesclomol. a. Cell growth of ARID1A-mutant TOV21G cells after transfection with the pCI-neo-ARID1A and pCI-neo control vectors for 48 h and treatment with elesclomol for 72 h. Cell growth was measured using the WST-1 assay and quantified relative to DMSO treated controls. b. Apoptosis of TOV21G cells after transfection and treatment as described in a as measured using annexin-V and PI staining. c. Western blot analysis showing the re-expression of ARID1A in TOV21G cells. *P < 0.05; **P < 0.01.
Depletion of ARID1A leads to increased intracellular ROS level and cell proliferation
Next, we asked that whether ARID1A affects intracellular ROS levels. We found that depletion of ARID1A resulted in an increase in intracellular ROS levels in RMG1 and OVCA432 cells by measuring 2′,7′-dichlorofluorescin diacetate (DCFDA) fluorescence (Figure 5a). We asked if the increase in intracellular ROS affects cell growth in ARID1A-knockdown cells. Upon ARID1A depletion, cell growth in RMG1 and OVCA432 cells was increased by 23% and 90% respectively (Figure 5b). Addition of NAC was able to fully inhibit the increase in cell growth upon ARID1A depletion in RMG1 cells and partially in OVCA432 cells (Figure 5b). These data suggests that up-regulation of ROS has growth promoting effects upon ARID1A depletion.
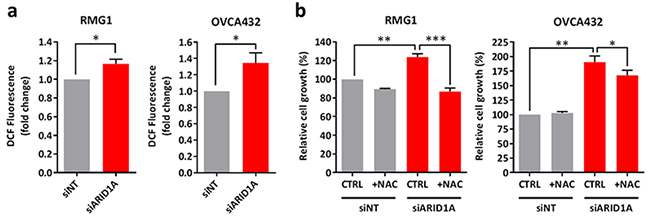
Figure 5: Knockdown of ARID1A expression in ARID1A-wildtype ovarian cancer cells results in increased intracellular ROS levels and cell growth. a. Measurement of ROS levels in ARID1A-wildtype RMG1 and OVCA432 cells transfected with ARID1A and non-target siRNA for 72 h using DCFDA. b. Cell growth of RMG1 and OVCA432 cells after transfection with ARID1A and non-target siRNA for 24 h and treatment with the antioxidant NAC for 72 h. Cell growth was measured using the WST-1 assay and quantified relative to DMSO treated non-target control. *P < 0.05; **P < 0.01; ***P < 0.001.
Ovarian clear cell carcinoma patient samples with low expression of ARID1A display higher levels of oxidative stress
To demonstrate the biological significance of our in vitro findings, we examined the expression of 8-hydroxyguanosine (8OHdG) as a marker of oxidative stress in ovarian clear cell carcinoma patient samples. Representative images are shown in Figure 6. We found that samples with lower expression of ARID1A (Figure 6, samples 5-8) were associated with higher expression of 8OHdG compared to samples with higher expression of ARID1A (Figure 6, samples 1-4). Together with our in vitro data, these results show that loss of ARID1A is associated with increased oxidative stress.
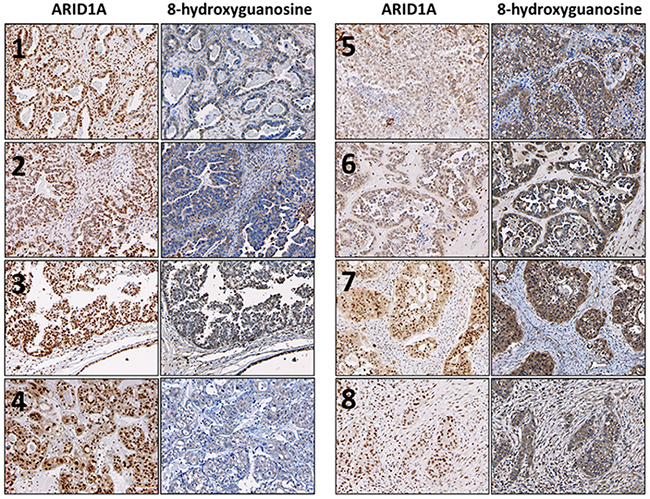
Figure 6: Ovarian clear cell carcinoma patient samples with low expression of ARID1A exhibit increased oxidative stress. Expression of ARID1A and 8OHdG were determined using immunohistochemistry. Robust nuclear staining of ARID1A was observed for samples 1-4. Robust cytoplasmic and nuclear staining of 8OHdG was observed for samples 5-8. Photos were taken at 100×.
DISCUSSION
ROS has important roles in tumor development and progression [10, 14–16]. Although it has been demonstrated that ARID1A has important tumor suppressive functions in cancer [8–13], whether ARID1A regulates ROS has not been reported. In the present study, we demonstrate for the first time that loss of ARID1A leads to accumulation of ROS in gynecologic cancer cells. Consistent with our in vitro findings, we found that ovarian clear cell carcinoma patient samples with low ARID1A expression exhibited increased oxidative stress. We also found that the increase in ROS is fully required for growth promotion upon ARID1A depletion in RMG1 and partially required in OVCA432 cells. An increase in ROS levels can activate signaling pathways, transcription factors, and growth promotion [18–21, 36, 37], however, excessive ROS can cause oxidative damage to macromolecules and cell death [26, 38]. Therefore, we propose a model in which ARID1A loss leads to an increase in ROS that promotes cell growth, but renders the cells vulnerable to further oxidative stress. Further studies will be required to identify ROS-regulating genes that are affected by loss of ARID1A.
In our study, we also found that depletion of the SWI/SNF core subunits BRG1 and SNF5 also led to increased sensitivity to elesclomol in RMG1 cells, suggesting that other subunits of SWI/SNF are required for protection against oxidative stress. Previous studies also support this notion. In the Supplementary Data of the study of Du et al., knockdown of BRG1 led to increased sensitivity to H2O2 in lymphoblasts [39]. In C. elegans, SWSN-1, SWSN-3, and SWSN-8 (orthologs of human BAF155/170, BAF57, and ARID1A respectively) are co-factors of DAF-16 and required for DAF-16 mediated oxidative stress resistance [30]. A genetic screen in S. cerevisiae found that deletion of SNF2 (ortholog of human BRG1), SNF5, SNF6, and SWI3 (ortholog of human BAF155/170) resulted in increased sensitivity to oxidative stress [31]. As SWI/SNF subunits other than ARID1A are also frequently inactivated in cancer [1, 2], cancer cells with SWI/SNF mutations may be more sensitive to oxidative stress and ROS-inducing agents may be used to target these cancers.
Interestingly, previous studies have found that antioxidant activity is up-regulated in ovarian clear cell carcinomas. HNF1β, which is highly expressed in ovarian clear cell carcinomas, was found to reduce intracellular ROS levels and enhance oxidative stress resistance [40]. In addition, the NRF2 antioxidant pathway is activated in ovarian clear cell carcinomas, possibly due to mutations in the NRF2 negative regulator KEAP1 [41]. It is possible that up-regulation of the antioxidant system is required to combat the increase in ROS caused by loss of ARID1A. As up-regulation of antioxidant activity is associated with poor survival and resistance to chemotherapy [41–44], therefore, further understanding in how ARID1A regulates ROS levels and its possible co-operation with antioxidant pathways will be clinically relevant.
In summary, we found that loss of ARID1A leads to higher levels of ROS and sensitivity to the ROS-inducing agent elesclomol. Our study suggests a novel therapeutic strategy for ARID1A-mutant gynecologic cancer cells by inducing oxidative stress.
MATERIALS AND METHODS
Comparison of drug sensitivities in ARID1A-mutant cancer cell lines and ARID1A-wildtype cancer cell lines using the GDSC database
The drug sensitivities of cancer cell lines were downloaded from the GDSC database (release 4, March 2013) [32]. Mutation statuses and copy numbers of ARID1A in cancer cell lines were obtained from the Cancer Cell Line Encyclopedia database using the cBioPortal for Cancer Genomics (www.cbioportal.org) [33]. Cell lines with no mutation or copy number alteration data were excluded from further analysis. Based on ARID1A mutational status, cell lines were placed into ARID1A-wildtype (no detectable ARID1A mutations, n = 347) or ARID1A-mutant (ARID1A nonsense mutations, frameshift mutations, or deep deletions, n = 74) groups. In addition, cells lines with missense mutations, in-frame insertions/deletions, or splicing mutations in ARID1A were excluded from further analysis because the effect of these mutations ARID1A expression and function are unclear.
To detect differences in drug sensitivity between ARID1A-mutant and ARID1A-wildtype cell lines, permutation tests were performed using the marker selection function of the GENE-E matrix visualization and analysis platform (www.broadinstitute.org/cancer/software/GENE-E/). For each drug, a test statistic was calculated to assess the difference in drug response between ARID1A-mutant and ARID1A-wildtype cell lines. Next, the significance of the test statistic score was estimated in 1000 permutations. Multiple hypothesis testing was corrected by computing both the false discovery rate and the family-wise error rate. A two-tailed t-test was used to calculate significance. A negative t-test score plus a significant P-value suggested that ARID1A-mutant cancer cell lines were more sensitive to the corresponding drug than ARID1A-wildtype cancer cell lines.
Cell culture
All cell lines were cultured in RPMI-1640 medium, supplemented with 10% FBS and 1% penicillin/streptomycin unless otherwise stated. RMG1 and TOV21G ovarian cancer cells and HEC-1A endometrial cancer cells were purchased from the American Type Culture Collection (Manassas, VA, USA). HEC-1A cells were cultured in McCoy’s 5A medium. MDA2774 ovarian cancer cells were a gift from Dr. Ralph Freedman (The University of Texas MD Anderson Cancer Center). OVCA420 and OVCA432 ovarian cancer cells were gifts from Dr. Robert Bast (MD Anderson). AN3CA endometrial cancer cells were purchased from the MD Anderson Characterized Cell Line Core and cultured in Eagle’s minimum essential medium. A2780, COV318, and COV362 ovarian cancer cells and MFE-280 endometrial cancer cells were purchased from the European Collection of Cell Cultures. COV318 and COV362 cells were cultured in Dulbecco’s modified Eagle’s medium supplemented with 2 mM L-glutamine. MFE-280 cells were cultured in 40% RPMI-1640 medium and 40% minimum essential medium (with Earle’s salts) supplemented with 2 mM L-glutamine, 20% FBS, and 1× insulin-transferrin-sodium selenite. SMOV2 and KOC7C ovarian cancer cells were gifts from Dr. Hiroaki Itamochi (Tottori University, Tottori City, Japan). IGROV1 ovarian cancer cells were a gift from Dr. Susan Holbeck (National Cancer Institute). All cell lines were cultured at 37 °C in 5% CO2 and were tested negative for mycoplasma. The cell lines were maintained for 20-30 passages.
PCR amplification of ARID1A
Genomic DNA was harvested from cells using the PureLink Genomic DNA mini kit (Life Technologies, Carlsbad, CA, USA) following the manufacturer’s protocol. The sequences of PCR primers and PCR cycling conditions used to amplify exons 1-20 of ARID1A were previously described [4]. PCR was performed in 50 μL reactions containing MyTaq Red Mix (Bioline, Taunton, MA, USA), 1.5 μM of forward primer, 1.5 μM of reverse primer, 6% DMSO and 20 ng of DNA. PCR reactions were purified using the PureLink PCR purification kit (Life Technologies). Purified PCR products were sent to the MD Anderson Sequencing and Microarray Core for Sanger sequencing.
Western blot analysis
Cells were washed twice in ice-cold PBS and scraped on ice in ice-cold RIPA buffer (Sigma-Aldrich, St. Louis, MO, USA) supplemented with protease inhibitor cocktail (Sigma-Aldrich). Protein lysates were collected after centrifuging the cells at 13,000 rpm for 10 min at 4 °C. For each sample, 25 μg of protein was loaded onto a SDS-PAGE gel. After transferring the protein to a nitrocellulose membrane, the membrane was incubated with primary antibodies against ARID1A (Sigma-Aldrich), BRG1 (Cell Signaling Technology, Danvers, MA, USA), SNF5 (Cell Signaling Technology), and vinculin (Cell Signaling Technology). Then, the membrane was incubated with anti-rabbit horseradish peroxidase-conjugated secondary antibody (Cell Signaling Technology). The bands on the membrane were visualized using enhanced chemiluminescence plus western blotting reagent (Amersham Biosciences, Little Chalfont, UK).
Chemicals
Elesclomol and piperlongumine were purchased from Selleck Chemicals (Houston, TX, USA) and reconstituted in DMSO. NAC was purchased from Sigma-Aldrich and reconstituted in dH2O. Working solutions were made fresh before each experiment.
Cell growth assays
Cells were plated in 96-well plates for 24 h before the addition of drugs. After 72 h of treatment with the drugs, cell growth was measured using WST-1 reagent (Roche, Indianapolis, IN, USA) according to the manufacturer’s protocol. Dose-response curves were constructed using the Prism software program (version 6, GraphPad Software, La Jolla, CA, USA) and IC50 values were interpolated from the graphs.
Annexin V staining
Cells were treated with the indicated drugs for 72 h and collected by centrifugation at 1,000 rpm for 5 min at 4 °C. The cells were washed in ice-cold PBS and resuspended in annexin binding buffer (10 mM HEPES, 140 mM NaCl, 2.5 mM CaCl2, pH 7.4; Life Technologies). For each sample, 1 × 10⁵ cells were stained in 100 μL of annexin binding buffer with 5 μL of annexin V-APC (BD Pharmingen, San Diego, CA, USA) for 15 min at room temperature in the dark. Prior to analysis, 400 μL of annexin binding buffer and 100 ng/mL propidium iodide (BD pharmingen) were added to each sample. For each sample, at least 10,000 cells were analyzed using a Gallios Flow Cytometer (Beckman Coulter, Brea, CA, USA). Cells were gated to include single cells only. Data analysis was performed using the Kaluza Analysis software (version 1.3, Beckman Coulter). The annexin V-positive cells included both annexin V/PI double-positive and annexin V-positive/PI-negative cell populations.
siRNA transfection
Cells were transfected with 20 nM siGENOME SMARTpool ARID1A, SNF5, and BRG1 siRNAs (Dharmacon, Lafayette, CO, USA) and Lipofectamine RNAiMAX (Life Technologies) according to the manufacturer’s protocol. Control cells were transfected with siGENOME non-targeting siRNA pool #2 (Dharmacon). For cell growth assays, cells were transfected for 24 h and then treated with the indicated drugs for 72 h.
Re-expression of ARID1A
The pCI-neo-ARID1A vector was a gift from Dr. Weidong Wang (National Institutes of Health) and has been described previously [45]. Due to several non-synonymous mutations in the ARID1A open reading frame in the original vector, mutagenesis was carried out in the Custom Cloning Core at Emory University to restore the ARID1A open reading frame to the wild-type sequence. Cells were plated in a 6-well plate and transfected with 2 μg of pCI-neo-ARID1A vector and Lipofectamine 3000 (Life Technologies) according to the manufacturer’s instructions. Control cells were transfected with empty pCI-neo vector. Twenty-four hours after transfection, cells were trypsinized and re-plated for subsequent experiments.
Cellular ROS assay
Cells were harvested by trypzinisation and washed with ice-cold PBS. For each sample, 5 × 10⁵ cells were stained with 10 μM DCFDA (Sigma-Aldrich) in 1 mL of PBS and incubated for 30 min at 37 °C in the dark. The cells were gently mixed every 10 min to prevent them from setting at the bottom. Stained cells were collected by centrifugation and resuspended in 500 μL of PBS. Prior to analysis, 2 μg/mL of DAPI (Life Technologies) was added to each sample. For each sample, at least 20,000 cells were analyzed using a Gallios Flow Cytometer and the cells were gated to include live and single cells only. The Kaluza Anlaysis Software was used to analyze the mean fluorescence.
Immunohistochemistry staining
Paraffin-embedded sections from patients with ovarian clear cell carcinomas were obtained from the archives of the Department of Pathology at The University of Texas MD Anderson Cancer Center. All cases were reviewed and confirmed as ovarian clear cell carcinomas by a gynecologic pathologist (J.S.C.). All tissue specimens were collected and archived previously under protocols approved by the institutional review board. Immunohistochemistry staining of the sections was performed as previously described [46]. Slides were stained with anti-8OHdG (1:200, EMD Millipore) and anti-ARID1A antibodies (1:100, Sigma-Aldrich).
Statistical analysis
Values are presented as the means and error bars represented the standard deviation. Unless otherwise stated, P-values were determined using the Student t-test. P-values of <0.05 were considered significant.
ACKNOWLEDGMENTS
This study was partly supported by a Pilot Study Award from The Marsha Rivkin Center for Ovarian Cancer Research and the Molbeck Ovarian Clear Cell Carcinoma Fund. We thank the MD Anderson Sequencing and Microarray Facility for sequencing all of the polymerase chain reaction products generated in this study and the MD Anderson Flow Cytometry and Cellular Imaging Facility for flow cytometry analyses, which were supported by the NCI/NIH under award numbers CA016672(SMF) and P30CA016672.
CONFLICTS OF INTEREST
The authors declare no conflict of interest.
REFERENCES
1. Shain AH and Pollack JR. The spectrum of SWI/SNF mutations, ubiquitous in human cancers. PLoS One. 2013; 8:e55119.
2. Kadoch C, Hargreaves DC, Hodges C, Elias L, Ho L, Ranish J and Crabtree GR. Proteomic and bioinformatic analysis of mammalian SWI/SNF complexes identifies extensive roles in human malignancy. Nat Genet. 2013; 45:592-601.
3. Wiegand KC, Shah SP, Al-Agha OM, Zhao Y, Tse K, Zeng T, Senz J, McConechy MK, Anglesio MS, Kalloger SE, Yang W, Heravi-Moussavi A, Giuliany R, Chow C, Fee J, Zayed A, et al. ARID1A mutations in endometriosis-associated ovarian carcinomas. N Engl J Med. 2010; 363:1532-1543.
4. Jones S, Wang TL, Shih Ie M, Mao TL, Nakayama K, Roden R, Glas R, Slamon D, Diaz LA, Jr., Vogelstein B, Kinzler KW, Velculescu VE and Papadopoulos N. Frequent mutations of chromatin remodeling gene ARID1A in ovarian clear cell carcinoma. Science. 2010; 330:228-231.
5. Wiegand KC, Lee AF, Al-Agha OM, Chow C, Kalloger SE, Scott DW, Steidl C, Wiseman SM, Gascoyne RD, Gilks B and Huntsman DG. Loss of BAF250a (ARID1A) is frequent in high-grade endometrial carcinomas. J Pathol. 2011; 224:328-333.
6. Guan B, Mao TL, Panuganti PK, Kuhn E, Kurman RJ, Maeda D, Chen E, Jeng YM, Wang TL and Shih Ie M. Mutation and loss of expression of ARID1A in uterine low-grade endometrioid carcinoma. Am J Surg Pathol. 2011; 35:625-632.
7. Cancer Genome Atlas Research N, Kandoth C, Schultz N, Cherniack AD, Akbani R, Liu Y, Shen H, Robertson AG, Pashtan I, Shen R, Benz CC, Yau C, Laird PW, Ding L, Zhang W, Mills GB, et al. Integrated genomic characterization of endometrial carcinoma. Nature. 2013; 497:67-73.
8. Yan HB, Wang XF, Zhang Q, Tang ZQ, Jiang YH, Fan HZ, Sun YH, Yang PY and Liu F. Reduced expression of the chromatin remodeling gene ARID1A enhances gastric cancer cell migration and invasion via downregulation of E-cadherin transcription. Carcinogenesis. 2014; 35:867-876.
9. Guan B, Wang TL and Shih Ie M. ARID1A, a factor that promotes formation of SWI/SNF-mediated chromatin remodeling, is a tumor suppressor in gynecologic cancers. Cancer Res. 2011; 71:6718-6727.
10. Samartzis EP, Gutsche K, Dedes KJ, Fink D, Stucki M and Imesch P. Loss of ARID1A expression sensitizes cancer cells to PI3K- and AKT-inhibition. Oncotarget. 2014; 5:5295-5303. doi: 10.18632/oncotarget.2092.
11. Bitler BG, Aird KM, Garipov A, Li H, Amatangelo M, Kossenkov AV, Schultz DC, Liu Q, Shih Ie M, Conejo-Garcia JR, Speicher DW and Zhang R. Synthetic lethality by targeting EZH2 methyltransferase activity in ARID1A-mutated cancers. Nat Med. 2015; 21:231-238.
12. Watanabe R, Ui A, Kanno S, Ogiwara H, Nagase T, Kohno T and Yasui A. SWI/SNF Factors Required for Cellular Resistance to DNA Damage Include ARID1A and ARID1B and Show Interdependent Protein Stability. Cancer Res. 2014; 74:2465-2475.
13. Shen J, Peng Y, Wei L, Zhang W, Yang L, Lan L, Kapoor P, Ju Z, Mo Q, Shih IM, Uray IP, Wu X, Brown PH, Shen X, Mills GB and Peng G. ARID1A Deficiency Impairs the DNA Damage Checkpoint and Sensitizes Cells to PARP Inhibitors. Cancer Discov. 2015.
14. Trachootham D, Alexandre J and Huang P. Targeting cancer cells by ROS-mediated mechanisms: a radical therapeutic approach? Nat Rev Drug Discov. 2009; 8:579-591.
15. Cairns RA, Harris IS and Mak TW. Regulation of cancer cell metabolism. Nat Rev Cancer. 2011; 11:85-95.
16. Gorrini C, Harris IS and Mak TW. Modulation of oxidative stress as an anticancer strategy. Nat Rev Drug Discov. 2013; 12:931-947.
17. Sabharwal SS and Schumacker PT. Mitochondrial ROS in cancer: initiators, amplifiers or an Achilles’ heel? Nat Rev Cancer. 2014; 14:709-721.
18. Lee SR, Yang KS, Kwon J, Lee C, Jeong W and Rhee SG. Reversible inactivation of the tumor suppressor PTEN by H2O2. J Biol Chem. 2002; 277:20336-20342.
19. Kwon J, Lee SR, Yang KS, Ahn Y, Kim YJ, Stadtman ER and Rhee SG. Reversible oxidation and inactivation of the tumor suppressor PTEN in cells stimulated with peptide growth factors. Proc Natl Acad Sci U S A. 2004; 101:16419-16424.
20. Giannoni E, Buricchi F, Raugei G, Ramponi G and Chiarugi P. Intracellular reactive oxygen species activate Src tyrosine kinase during cell adhesion and anchorage-dependent cell growth. Mol Cell Biol. 2005; 25:6391-6403.
21. Cao J, Schulte J, Knight A, Leslie NR, Zagozdzon A, Bronson R, Manevich Y, Beeson C and Neumann CA. Prdx1 inhibits tumorigenesis via regulating PTEN/AKT activity. EMBO J. 2009; 28:1505-1517.
22. Takahashi A, Ohtani N, Yamakoshi K, Iida S, Tahara H, Nakayama K, Nakayama KI, Ide T, Saya H and Hara E. Mitogenic signalling and the p16INK4a-Rb pathway cooperate to enforce irreversible cellular senescence. Nat Cell Biol. 2006; 8:1291-1297.
23. Ramsey MR and Sharpless NE. ROS as a tumour suppressor? Nat Cell Biol. 2006; 8:1213-1215.
24. Garrido C, Galluzzi L, Brunet M, Puig PE, Didelot C and Kroemer G. Mechanisms of cytochrome c release from mitochondria. Cell Death Differ. 2006; 13:1423-1433.
25. Ogrunc M, Di Micco R, Liontos M, Bombardelli L, Mione M, Fumagalli M, Gorgoulis VG and d’Adda di Fagagna F. Oncogene-induced reactive oxygen species fuel hyperproliferation and DNA damage response activation. Cell Death Differ. 2014; 21:998-1012.
26. Trachootham D, Zhou Y, Zhang H, Demizu Y, Chen Z, Pelicano H, Chiao PJ, Achanta G, Arlinghaus RB, Liu J and Huang P. Selective killing of oncogenically transformed cells through a ROS-mediated mechanism by beta-phenylethyl isothiocyanate. Cancer Cell. 2006; 10:241-252.
27. Raj L, Ide T, Gurkar AU, Foley M, Schenone M, Li X, Tolliday NJ, Golub TR, Carr SA, Shamji AF, Stern AM, Mandinova A, Schreiber SL and Lee SW. Selective killing of cancer cells by a small molecule targeting the stress response to ROS. Nature. 2011; 475:231-234.
28. Harris IS, Treloar AE, Inoue S, Sasaki M, Gorrini C, Lee KC, Yung KY, Brenner D, Knobbe-Thomsen CB, Cox MA, Elia A, Berger T, Cescon DW, Adeoye A, Brustle A, Molyneux SD, et al. Glutathione and thioredoxin antioxidant pathways synergize to drive cancer initiation and progression. Cancer Cell. 2015; 27:211-222.
29. Cottini F, Hideshima T, Suzuki R, Tai YT, Bianchini G, Richardson PG, Anderson KC and Tonon G. Synthetic lethal approaches exploiting DNA damage in aggressive myeloma. Cancer Discov. 2015.
30. Riedel CG, Dowen RH, Lourenco GF, Kirienko NV, Heimbucher T, West JA, Bowman SK, Kingston RE, Dillin A, Asara JM and Ruvkun G. DAF-16 employs the chromatin remodeller SWI/SNF to promote stress resistance and longevity. Nat Cell Biol. 2013; 15:491-501.
31. Thorpe GW, Fong CS, Alic N, Higgins VJ and Dawes IW. Cells have distinct mechanisms to maintain protection against different reactive oxygen species: oxidative-stress-response genes. Proc Natl Acad Sci U S A. 2004; 101:6564-6569.
32. Yang W, Soares J, Greninger P, Edelman EJ, Lightfoot H, Forbes S, Bindal N, Beare D, Smith JA, Thompson IR, Ramaswamy S, Futreal PA, Haber DA, Stratton MR, Benes C, McDermott U, et al. Genomics of Drug Sensitivity in Cancer (GDSC): a resource for therapeutic biomarker discovery in cancer cells. Nucleic Acids Res. 2013; 41:D955-961.
33. Barretina J, Caponigro G, Stransky N, Venkatesan K, Margolin AA, Kim S, Wilson CJ, Lehar J, Kryukov GV, Sonkin D, Reddy A, Liu M, Murray L, Berger MF, Monahan JE, Morais P, et al. The Cancer Cell Line Encyclopedia enables predictive modelling of anticancer drug sensitivity. Nature. 2012; 483:603-607.
34. Blackman RK, Cheung-Ong K, Gebbia M, Proia DA, He S, Kepros J, Jonneaux A, Marchetti P, Kluza J, Rao PE, Wada Y, Giaever G and Nislow C. Mitochondrial electron transport is the cellular target of the oncology drug elesclomol. PLoS One. 2012; 7:e29798.
35. Gorrini C, Baniasadi PS, Harris IS, Silvester J, Inoue S, Snow B, Joshi PA, Wakeham A, Molyneux SD, Martin B, Bouwman P, Cescon DW, Elia AJ, Winterton-Perks Z, Cruickshank J, Brenner D, et al. BRCA1 interacts with Nrf2 to regulate antioxidant signaling and cell survival. J Exp Med. 2013; 210:1529-1544.
36. Gao P, Zhang H, Dinavahi R, Li F, Xiang Y, Raman V, Bhujwalla ZM, Felsher DW, Cheng L, Pevsner J, Lee LA, Semenza GL and Dang CV. HIF-dependent antitumorigenic effect of antioxidants in vivo. Cancer Cell. 2007; 12:230-238.
37. Leslie NR, Bennett D, Lindsay YE, Stewart H, Gray A and Downes CP. Redox regulation of PI 3-kinase signalling via inactivation of PTEN. EMBO J. 2003; 22:5501-5510.
38. Sayin VI, Ibrahim MX, Larsson E, Nilsson JA, Lindahl P and Bergo MO. Antioxidants accelerate lung cancer progression in mice. Science translational medicine. 2014; 6:221ra215.
39. Du W, Rani R, Sipple J, Schick J, Myers KC, Mehta P, Andreassen PR, Davies SM and Pang Q. The FA pathway counteracts oxidative stress through selective protection of antioxidant defense gene promoters. Blood. 2012; 119:4142-4151.
40. Amano Y, Mandai M, Yamaguchi K, Matsumura N, Kharma B, Baba T, Abiko K, Hamanishi J, Yoshioka Y and Konishi I. Metabolic alterations caused by HNF1beta expression in ovarian clear cell carcinoma contribute to cell survival. Oncotarget. 2015; 6:26002-26017. doi: 10.18632/oncotarget.4692.
41. Konstantinopoulos PA, Spentzos D, Fountzilas E, Francoeur N, Sanisetty S, Grammatikos AP, Hecht JL and Cannistra SA. Keap1 mutations and Nrf2 pathway activation in epithelial ovarian cancer. Cancer Res. 2011; 71:5081-5089.
42. Jiang T, Chen N, Zhao F, Wang XJ, Kong B, Zheng W and Zhang DD. High levels of Nrf2 determine chemoresistance in type II endometrial cancer. Cancer Res. 2010; 70:5486-5496.
43. Homma S, Ishii Y, Morishima Y, Yamadori T, Matsuno Y, Haraguchi N, Kikuchi N, Satoh H, Sakamoto T, Hizawa N, Itoh K and Yamamoto M. Nrf2 enhances cell proliferation and resistance to anticancer drugs in human lung cancer. Clin Cancer Res. 2009; 15:3423-3432.
44. Shibata T, Kokubu A, Gotoh M, Ojima H, Ohta T, Yamamoto M and Hirohashi S. Genetic alteration of Keap1 confers constitutive Nrf2 activation and resistance to chemotherapy in gallbladder cancer. Gastroenterology. 2008; 135:1358-1368, 1368 e1351-1354.
45. Nie Z, Xue Y, Yang D, Zhou S, Deroo BJ, Archer TK and Wang W. A specificity and targeting subunit of a human SWI/SNF family-related chromatin-remodeling complex. Mol Cell Biol. 2000; 20:8879-8888.
46. Song H, Kwan SY, Izaguirre DI, Zu Z, Tsang YT, Tung CS, King ER, Mok SC, Gershenson DM and Wong KK. PAX2 Expression in Ovarian Cancer. Int J Mol Sci. 2013; 14:6090-6105.