
Introduction
Colorectal cancer is the fourth most common cancer in both sexes and the second leading cause of cancer-related death worldwide, and metastatic colorectal cancer (mCRC) is associated with a poor prognosis [1]. mCRC with wild-type RAS (RAS-WT), which accounts for more than half of cases, is dependent on the epidermal growth factor receptor (EGFR) signal pathway [2]. There is evidence that treatment with anti-EGFR mAbs cetuximab or panitumumab improves the overall survival rate of RAS-WT patients [3-5]. Nevertheless, only two-thirds of RAS-WT patients respond to these therapies, suggesting that other biomarkers besides RAS still need to be researched [6, 7].
Amphiregulin (AREG) and epiregulin (EREG), which are ligands of EGFR, are overexpressed in colorectal cancer at both the mRNA and protein levels [1, 8-11]. Ligand-induced EGFR activation plays a key role in tumor proliferation, invasion, and migration through the RAS-RAF-MAPK and PI3K-AKT-mTOR pathways [12], and ligand binding results in EGFR activation in cell lines [13, 14]. In addition, knock-out of the AREG or EREG genes reduces the therapeutic efficacy of cetuximab [11]. Thus, AREG and EREG might be predictive biomarkers in mCRC. [15]
High ligand mRNA expression typically correlates with favorable outcomes in patients receiving cetuximab or panitumumab treatment [9, 15-24]. Some studies found that high AREG and EREG mRNA levels in tumors act as independent favorable prognostic factors [17, 21], while other studies [18, 22, 23, 25] reported that only EREG expression acts as an independent prognostic marker in mCRC patients18,22,23,25. Variation in study designs and sample sizes may contribute to this discrepancy [26]. Furthermore, most investigations only included patients treated with anti-EGFR, and thus have not been able to differentiate between prognostic and predictive effects. The direct impact of AREG and EREG levels on patient survival remains inconclusive. Here, we conducted a systematic review of the literature and used meta-analysis to investigate the prognostic utility of EGFR ligand expression, including both AREG and EREG, in mCRC patients. The relationship between EGFR ligand expression and RAS state was also evaluated to exclude potential pathway-related interactions.
Results
Patient demographics and clinical characteristics
Biomarker analyses for 2167 mCRC patients were included in this systematic review of nine published studies, three of which were RCTs (Figure 1 and Table 1). Six of the articles restricted their analyses to the impact of AREG mRNA expression on overall survival (OS), while eight evaluated EREG expression. Seven articles assessed the effects of both AREG and EREG expression on progression-free survival (PFS). Some studies used the minimum p-value method to select high and low mRNA expression cutoffs [9, 19, 21, 23, 25, 26], while other studies used receiver operating characteristics (ROC) [17, 22, 24]. Eight studies used anti-EGFR mAb therapy alone or in combination with chemotherapy, and one study used only chemotherapy. Seven studies evaluated cetuximab and one study evaluated panitumumab. Six studies restricted analysis to KRAS-WT tumors, and three studies restricted analysis to KRAS-WT and NRAS-WT tumors. Table 1 summarizes the background therapy details and the p-values for high vs. low AREG/EREG expression; histopathological details are shown in Supplementary Table 1.
Table 1: Summary of studies included in meta-analysis
Author(Publication |
Trial phase |
Therapy(trial) |
ITT |
p value of HR AREG high vs low |
p value of HR EREG high vs low |
Jadad score |
||
OS |
PFS |
OS |
PFS |
|||||
Khambata-Ford(2007) |
phase 2 |
cetuximab |
110 |
NR |
<0.001 |
NR |
0.0002 |
3 |
Jacobs(2009) |
phase 2 |
CT+cetuximab |
220 |
<0.0001 |
<0.001 |
<0.0001 |
<0.001 |
4 |
Saridaki(2011) |
phase 2 |
CT+cetuximab |
112 |
0.013 |
0.018 |
0.004 |
0.002 |
4 |
Pentheroudakis(2013) |
phase 2 |
CT+cetuximab |
226 |
0.0002 |
NR |
0.0009 |
NR |
3 |
Strimpakos(2013) |
phase 2 |
CT+cetuximab |
222 |
< .0001 |
NR |
0.006 |
NR |
3 |
Cushman(2015) |
phase 3 RCT |
CT±cetuximab(CALGB 80203) |
238 |
0.923 |
0.144 |
0.012 |
0.016 |
5 |
Llovet(2015) |
phase 2 |
CT+cetuximab |
105 |
0.05 |
0.001 |
0.053 |
0.09 |
3 |
Seligmann(2016) |
phase 3 RCT |
CT±panitumumab(PICCOLO) |
696 |
0.18 |
0.50 |
0.001 |
0.16 |
5 |
Stahler(2016) |
phase 3 RCT |
CT(FIRE 1) |
238 |
0.11 |
0.03 |
<0.001 |
0.002 |
4 |
CT, chemotherapy; ITT, overall intention-to-treat population; HR, hazard ratio; AREG, amphiregulin; ERGE, epiregulin; High, high expression; low, low expression. NR, not reported in the publication
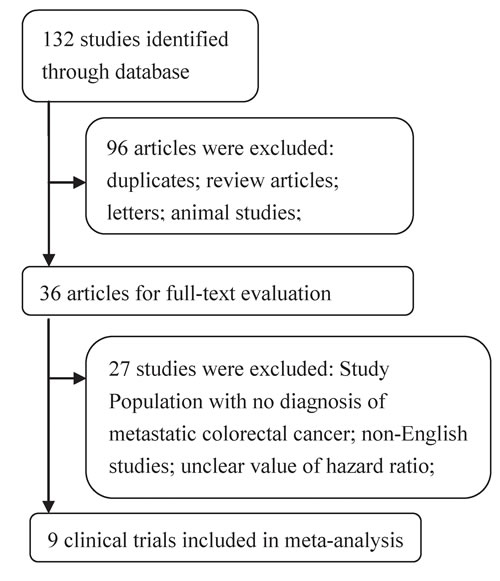
Figure 1: Flow chart depicting the study selection process.
Effects of AREG and EREG expression on OS in mCRC
In prognostic analyses, high AREG and EREG mRNA levels in tumors were associated with prolonged OS. High AREG mRNA expression was associated with longer OS compared to low AREG expression (HR = 0.71, 95% CI: 0.53-0.94, p = 0.0029; Figure 2). Similarly, high EREG expression compared to low EREG expression had longer OS. (HR = 0.61, 95% CI: 0.47-0.79, p < 0.0001; Figure 3).
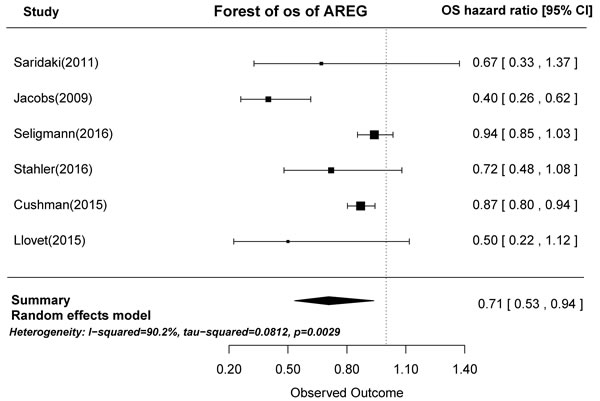
Figure 2: Forest plot of overall survival in high and low tumor AREG mRNA expression subgroups.
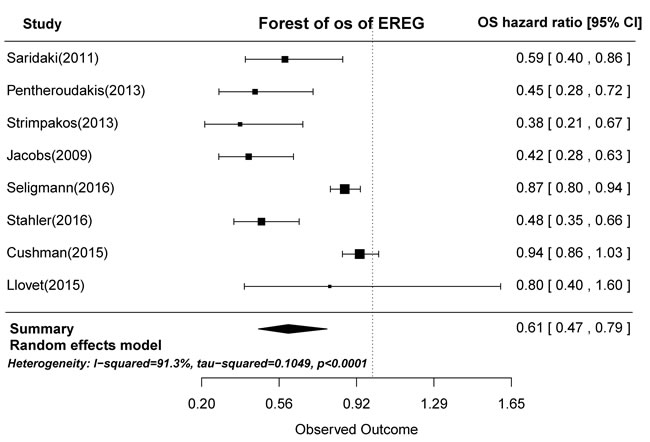
Figure 3: Forest plot of overall survival in high and low tumor EREG mRNA expression subgroups.
Effects of AREG and EREG expression on PFS in mCRC
Based on the gene expression results of the seven articles examined, tumors with high AREG expression were associated with longer PFS than those with low AREG expression (HR = 0.62, 95% CI: 0.45-0.84, p < 0.0001; Figure 4). Similarly, high EREG expression was associated with longer PFS than low EREG expression (HR = 0.65, 95% CI: 0.51-0.83, p = 0.0001; Figure 5).
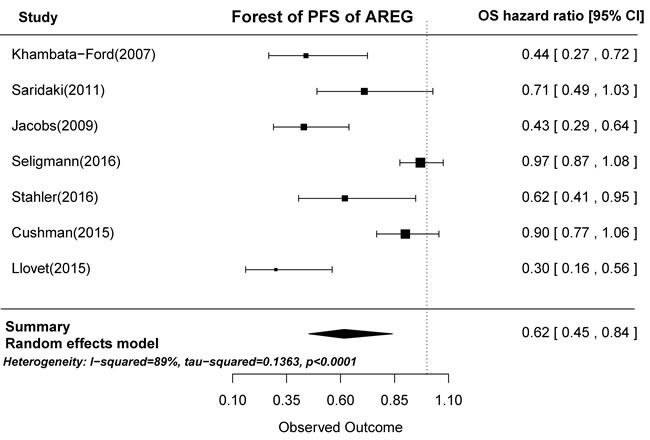
Figure 4: Forest plot of progression-free survival in high and low tumor AREG mRNA expression subgroups.
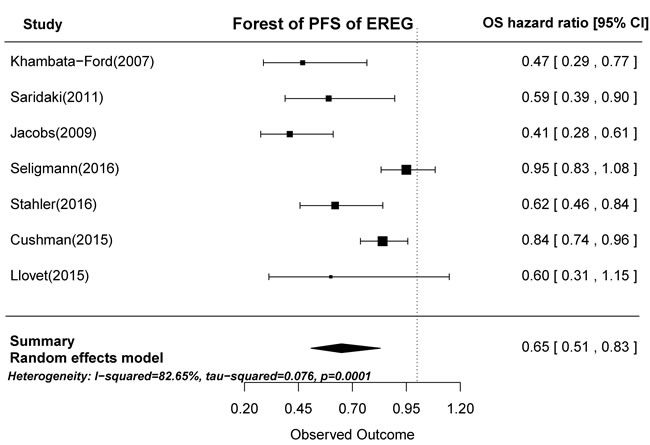
Figure 5: Forest plot of progression-free survival in high and low tumor EREG mRNA expression subgroups.
Effects of AREG and EREG expression depending on RAS state in mCRC
RAS mutations were detected in 556 of 1553 patients (36.4%). In RAS-WT patients treated with anti-EGFR therapy, high AREG expression was associated with both longer PFS (HR = 0.85, 95% CI: 0.76-0.95, p = 0.0005) and longer OS (HR = 0.37, 95% CI; 0.16-0.86; p = 0.02). OS, but not PFS (p = 0.06), was also longer in patients with high EREG expression compared to those with low EREG expression (HR = 0.54, 95% CI: 0.31-0.940, p = 0.03). OS and PFS in patients with RAS-MT were not associated with AREG or EREG expression. These results, shown in Table 2, indicate that AREG and EREG levels should be considered when evaluating the effects of anti-EGFR therapy in RAS-WT mCRC patients.
Table 2: Meta-analysis for ligand expression effect of overall survival and progression-free survival in patients with metastatic CRC assigned to RAS state
Subgroup |
survival |
Gene |
N |
HR(95%CI) |
P-value |
Heterogeneity,tau2; P; I2 |
RAS WT |
OS |
AREG |
4 |
0.37(0.16-0.86) |
0.02 |
0.65;<0.001;90.19% |
EREG |
4 |
0.54(0.31-0.94) |
0.03 |
0.26; <0.001; 86.31% |
||
PFS |
AREG |
3 |
0.85(0.76-0.95) |
0.005 |
0;0.14;0.02% |
|
EREG |
4 |
0.72(0.51-1.01) |
0.06 |
0.09;0.0116;88.36% |
||
RAS MT |
OS |
AREG |
2 |
1.09(0.91-1.36) |
0.37 |
0;0.5458;0% |
EREG |
2 |
1.07(0.9-1.24) |
0.4 |
0;0.9239;0% |
||
PFS |
AREG |
1 |
0.93 (0.77–1.13) |
0.46 |
NA |
|
EREG |
2 |
0.95(0.82-1.10) |
0.48 |
0;0.9072;0% |
WT, wild type; MT, mutation type; OS, overall survival; PFS, progression-free survival; AREG, amphir,egulin; ERGE, epiregulin; N, number of included studies; HR, hazard ratio; NA, not applicable
Publication bias
No evidence of publication bias was identified in OS in subgroups defined by high and low tumor EREG mRNA expression using a contour-enhanced funnel plot (Supplementary Figure 1) or Begg’s test (Z = 0.25, p-value = 0.805).
Discussion
EGFR and its ligands play central roles in the development of epithelial tumors, including colorectal cancers [27]. However, the predictive value of AREG and EREG tumor mRNA levels is currently disputed. Most analyses focusing on AREG and EREG have been conducted in cohorts of patients who received cetuximab and did not include control patient groups that did not receive EGFR-targeting therapy [9, 15-24]. The present investigation was motivated by the lack of meta-analysis data regarding associations between expression of the EGFR ligands AREG and EREG and prognosis in mCRC.
This meta-analysis included nine cohorts: eight studies used anti-EGFR mAb therapy alone or in combination with chemotherapy, and one study used only chemotherapy. We found that high AREG and EREG mRNA expression in primary tumors was associated with prolonged OS in mCRC patients. High AREG and EREG mRNA expression was also associated with longer PFS. These results suggest that AREG and EREG expression are independent prognostic markers in mCRC patients, whether or not chemotherapy is accompanied by anti-EGFR mAb therapy.
We evaluated AREG and EREG mRNA expression in mCRC, whereas previous studies examined AREG and EREG protein levels [8, 28, 29]. Tissue and pretreatment serum levels of AREG and EREG protein were negatively correlated with clinicopathological characteristics, such as depth of tumor invasion, distant metastases, and nerve invasion. Thus, determining the levels of these ligands might help identify patients who require adjuvant treatment and intensive follow-up [8, 29]. However, AREG and EREG levels were also inversely proportional to total skin toxicity grades, suggesting the need for a new dose-modulation strategy for anti-EGFR antibodies [28]. Finally, Hobor and Loupakis reported increased levels of circulating EGFR ligands in mCRC patients treated with cetuximab and irinotecan at the time of disease progression, suggesting a potential role for these ligands in acquired resistance to drug treatment [12, 30, 31]. Here, we found specifically that ligand mRNA expression in the primary tumor was related to survival in mCRC patients.
Some studies have shown that ligand-induced EGFR activation results from autocrine or paracrine stimulation. EREG organizes epidermal structure by regulating keratinocyte proliferation and differentiation. A previous report revealed that EREG plays an autocrine role in the proliferation of human epithelial cells [32]. AREG is a major autocrine factor in human keratinocytes, and its expression is developmentally regulated in human skin epithelium and mesenchyme during morphogenesis [33]. Ligand binding triggers the homo- or heterodimerization of EGFR receptors, which then activates mitogenic and anti-apoptotic signaling cascades [34, 35]. AREG- and EREG-induced upregulation of EGFR is not only a key mediator of intestinal neoplastic transformation, but also a positive predictor of sensitivity to EGFR inhibition in CRC [36-39].
In this meta-analysis, AREG/EREG mRNA overexpression was associated with longer OS in RAS-WT patients who received cetuximab or panitumumab treatment. In addition, AREG overexpression was associated with longer PFS in RAS-WT patients. Therefore, AREG and EREG mRNA expression might be predictive biomarkers for the success of anti-EGFR therapy in RAS-WT patients, indicating the presence of ligand-driven autocrine oncogenic EGFR signaling [27, 28]. Blocking this AREG/EREG-induced activation of EGFR might promote cancer cell death. In contrast, this pathway might be redundant or irrelevant, perhaps due to a low level of activation by AREG and EREG, in cancer cells, thus rendering the blockade of EGFR by cetuximab ineffective. Furthermore, AREG and EREG did not have predictive value in patients with KRAS mutations, indicating that other oncogenic intracellular signaling pathways, including non-RAS-RAF-MAPK pathways, are activated in KRAS-MT mCRC [40].
Limitations that apply to meta-analysis studies in general, including differences in study populations, analytic techniques, and randomization, should be considered when interpreting these results. Additionally, AREG and EREG levels vary greatly among patients, and appropriate cutoff points for high vs. low expression should be investigated further using independent datasets. Prospective, randomized, and controlled studies using validated assays and optimized cutoff points will help clarify the value of AREG and EREG as predictive biomarkers in the clinical setting.
This study demonstrated for the first time the utility of high EREG and AREG mRNA expression within primary tumors as an independent favorable prognostic biomarker for mCRC patients. In addition, our results suggest that anti-EGFR mAb therapy might be particularly beneficial in RAS-WT patients with high AREG and EREG expression. These results suggest that further examination of these ligands in controlled trials is warranted.
materials and Methods
Search strategy and study selection
We searched the EMBASE, PubMed, and Cochrane Library databases for research published on or prior to March 15, 2016 using the following search terms (treated as Mesh terms or free text): (“colorectal cancer”, or “Colorectal Neoplasms” or “metastatic colorectal cancer” or “advanced colorectal cancer”) and (“Amphiregulin” or “AREG mRNA, human” or “Epiregulin” or “EREG mRNA, human”). We also searched the clinical trial registration website (ClinicalTrials.gov) to obtain information on registered clinical trials. This study is a meta-analysis and did not involve subjects; therefore, ethical approval was not required.
The following criteria were included for study selection: (1) patients were diagnosed with metastatic colorectal cancer according to pathological material and imaging; (2) mCRC patients were treated with standard therapy, either alone or in combination with anti-EGFR antibody; (3) studies had follow-up data on OS or PFS outcomes; (4) studies assessed hazard ratios associated with differences in AREG and/or EREG mRNA expression in mCRC patients; and (5) studies were prospective. Studies were excluded if they did not provide sufficient quantitative data regarding AREG and/or EREG expression status. Study selection was conducted according to the Preferred Reporting Items for Systematic Reviews and Meta-Analyses statement (Supplementary Material Appendix A1).
Data extraction and quality assessment
Data extraction was conducted by two independent investigators (CJ and ZJ), with any discrepancies resolved by a third investigator (YHJ). For each study, the following information was extracted: year of publication, first author’s name, treatment arm, trial phase, and p-value of HRs calculated between high and low AREG or EREG mRNA expression groups and OS or PFS.
The quality of all included trails was assessed using the Jadad scale, and scores ranged from 0 to 5, with a high score indicating a high-quality study [41].
Date synthesis and statistical analysis
The primary summary measures were hazard ratio (HR) and 95% confidence interval (CI). HR and 95% CI were extracted from each study to calculate the overall HRs and 95% CIs. Heterogeneity among trials was assessed by using the Q statistic and I2 tests. Heterogeneity was considered statistically significant when Pheterogeneity < 0.1 or I2>40%. If heterogeneity existed, the data was analyzed using a random-effects model; if heterogeneity did not exist, a fixed-effects model was used [12, 42]. Statistical tests with p-values < 0.05 were considered significant. Contour-enhanced meta-analysis funnel plots and Begg’s test were performed to assess publication bias [43, 44]. All statistical analyses were performed with R software, version 3.0.3 (The R Foundation for Statistical Computing,http://www.r-project.org).
Conflicts of Interest
There are no financial/commercial conflicts of interest involving any of the authors of this study.
References
1. Siegel R, Ma J, Zou Z and Jemal A. Cancer statistics, 2014. CA: a cancer journal for clinicians. 2014; 64:9-29.
2. Sartore-Bianchi A, Bencardino K, Di Nicolantonio F, Pozzi F, Funaioli C, Gambi V, Arena S, Martini M, Lamba S, Cassingena A, Schiavo R, Bardelli A and Siena S. Integrated molecular dissection of the epidermal growth factor receptor (EGFR) [corrected] oncogenic pathway to predict response to EGFR-targeted monoclonal antibodies in metastatic colorectal cancer. Targeted oncology. 2010; 5:19-28.
3. Cunningham D, Humblet Y, Siena S, Khayat D, Bleiberg H, Santoro A, Bets D, Mueser M, Harstrick A, Verslype C, Chau I and Van Cutsem E. Cetuximab monotherapy and cetuximab plus irinotecan in irinotecan-refractory metastatic colorectal cancer. The New England journal of medicine. 2004; 351:337-345.
4. Douillard JY, Oliner KS, Siena S, Tabernero J, Burkes R, Barugel M, Humblet Y, Bodoky G, Cunningham D, Jassem J, Rivera F, Kocakova I, Ruff P, Blasinska-Morawiec M, Smakal M, Canon JL, et al. Panitumumab-FOLFOX4 treatment and RAS mutations in colorectal cancer. The New England journal of medicine. 2013; 369:1023-1034.
5. Patel GS and Karapetis CS. Personalized treatment for advanced colorectal cancer: KRAS and beyond. Cancer management and research. 2013; 5:387-400.
6. Heinemann V, von Weikersthal LF, Decker T, Kiani A, Vehling-Kaiser U, Al-Batran SE, Heintges T, Lerchenmuller C, Kahl C, Seipelt G, Kullmann F, Stauch M, Scheithauer W, Hielscher J, Scholz M, Muller S, et al. FOLFIRI plus cetuximab versus FOLFIRI plus bevacizumab as first-line treatment for patients with metastatic colorectal cancer (FIRE-3): a randomised, open-label, phase 3 trial. The Lancet Oncology. 2014; 15:1065-1075.
7. Schwartzberg LS, Rivera F, Karthaus M, Fasola G, Canon JL, Hecht JR, Yu H, Oliner KS and Go WY. PEAK: a randomized, multicenter phase II study of panitumumab plus modified fluorouracil, leucovorin, and oxaliplatin (mFOLFOX6) or bevacizumab plus mFOLFOX6 in patients with previously untreated, unresectable, wild-type KRAS exon 2 metastatic colorectal cancer. Journal of clinical oncology. 2014; 32:2240-2247.
8. Li XD, Miao SY, Wang GL, Yang L, Shu YQ and Yin YM. Amphiregulin and epiregulin expression in colorectal carcinoma and the correlation with clinicopathological characteristics. Onkologie. 2010; 33:353-358.
9. Khambata-Ford S, Garrett CR, Meropol NJ, Basik M, Harbison CT, Wu S, Wong TW, Huang X, Takimoto CH, Godwin AK, Tan BR, Krishnamurthi SS, Burris HA, 3rd, Poplin EA, Hidalgo M, Baselga J, et al. Expression of epiregulin and amphiregulin and K-ras mutation status predict disease control in metastatic colorectal cancer patients treated with cetuximab. Journal of clinical oncology. 2007; 25:3230-3237.
10. Oliveras-Ferraros C, Vazquez-Martin A, Queralt B, Adrados M, Ortiz R, Cufi S, Hernandez-Yague X, Guardeno R, Baez L, Martin-Castillo B, Perez-Martinez MC, Lopez-Bonet E, De Llorens R, Bernado L, Brunet J and Menendez JA. Interferon/STAT1 and neuregulin signaling pathways are exploratory biomarkers of cetuximab (Erbitux(R)) efficacy in KRAS wild-type squamous carcinomas: a pathway-based analysis of whole human-genome microarray data from cetuximab-adapted tumor cell-line models. International journal of oncology. 2011; 39:1455-1479.
11. Oliveras-Ferraros C, Cufi S, Queralt B, Vazquez-Martin A, Martin-Castillo B, de Llorens R, Bosch-Barrera J, Brunet J and Menendez JA. Cross-suppression of EGFR ligands amphiregulin and epiregulin and de-repression of FGFR3 signalling contribute to cetuximab resistance in wild-type KRAS tumour cells. British journal of cancer. 2012; 106:1406-1414.
12. Zintzaras E and Ioannidis JP. Heterogeneity testing in meta-analysis of genome searches. Genetic epidemiology. 2005; 28:123-137.
13. Johnson GR, Saeki T, Gordon AW, Shoyab M, Salomon DS and Stromberg K. Autocrine action of amphiregulin in a colon carcinoma cell line and immunocytochemical localization of amphiregulin in human colon. The Journal of cell biology. 1992; 118:741-751.
14. Dong J, Opresko LK, Dempsey PJ, Lauffenburger DA, Coffey RJ and Wiley HS. Metalloprotease-mediated ligand release regulates autocrine signaling through the epidermal growth factor receptor. Proceedings of the National Academy of Sciences of the United States of America. 1999; 96:6235-6240.
15. Yoshida M, Shimura T, Sato M, Ebi M, Nakazawa T, Takeyama H and Joh T. A novel predictive strategy by immunohistochemical analysis of four EGFR ligands in metastatic colorectal cancer treated with anti-EGFR antibodies. Journal of cancer research and clinical oncology. 2013; 139:367-378.
16. Baker JB, Dutta D, Watson D, Maddala T, Munneke BM, Shak S, Rowinsky EK, Xu LA, Harbison CT, Clark EA, Mauro DJ and Khambata-Ford S. Tumour gene expression predicts response to cetuximab in patients with KRAS wild-type metastatic colorectal cancer. British journal of cancer. 2011; 104:488-495.
17. Jacobs B, De Roock W, Piessevaux H, Van Oirbeek R, Biesmans B, De Schutter J, Fieuws S, Vandesompele J, Peeters M, Van Laethem JL, Humblet Y, Penault-Llorca F, De Hertogh G, Laurent-Puig P, Van Cutsem E and Tejpar S. Amphiregulin and epiregulin mRNA expression in primary tumors predicts outcome in metastatic colorectal cancer treated with cetuximab. Journal of clinical oncology. 2009; 27:5068-5074.
18. Jonker DJ, Karapetis CS, Harbison C, O’Callaghan CJ, Tu D, Simes RJ, Malone DP, Langer C, Tebbutt N, Price TJ, Shapiro J, Siu LL, Wong RPW, Bjarnason G, Moore MJ, Zalcberg JR, et al. Epiregulin gene expression as a biomarker of benefit from cetuximab in the treatment of advanced colorectal cancer. British journal of cancer. 2013; 110:648-655.
19. Pentheroudakis G, Kotoula V, De Roock W, Kouvatseas G, Papakostas P, Makatsoris T, Papamichael D, Xanthakis I, Sgouros J, Televantou D, Kafiri G, Tsamandas AC, Razis E, Galani E, Bafaloukos D, Efstratiou I, et al. Biomarkers of benefit from cetuximab-based therapy in metastatic colorectal cancer: interaction of EGFR ligand expression with RAS/RAF, PIK3CA genotypes. BMC cancer. 2013; 13:49.
20. Yamada M, Ichikawa Y, Yamagishi S, Momiyama N, Ota M, Fujii S, Tanaka K, Togo S, Ohki S and Shimada H. Amphiregulin is a promising prognostic marker for liver metastases of colorectal cancer. Clin Cancer Res. 2008; 14:2351-2356.
21. Strimpakos A, Pentheroudakis G, Kotoula V, De Roock W, Kouvatseas G, Papakostas P, Makatsoris T, Papamichael D, Andreadou A, Sgouros J, Zizi-Sermpetzoglou A, Kominea A, Televantou D, Razis E, Galani E, Pectasides D, et al. The prognostic role of ephrin A2 and endothelial growth factor receptor pathway mediators in patients with advanced colorectal cancer treated with cetuximab. Clinical colorectal cancer. 2013; 12:267-274 e262.
22. Stahler A, Heinemann V, Giessen-Jung C, Crispin A, Schalhorn A, Stintzing S, Fischer von Weikersthal L, Vehling-Kaiser U, Stauch M, Quietzsch D, Held S, von Einem JC, Holch J, Neumann J, Kirchner T, Jung A, et al. Influence of mRNA expression of epiregulin and amphiregulin on outcome of patients with metastatic colorectal cancer treated with 5-FU/LV plus irinotecan or irinotecan plus oxaliplatin as first-line treatment (FIRE 1-trial). International journal of cancer. 2016; 138:739-746.
23. Saridaki Z, Tzardi M, Papadaki C, Sfakianaki M, Pega F, Kalikaki A, Tsakalaki E, Trypaki M, Messaritakis I, Stathopoulos E, Mavroudis D, Georgoulias V and Souglakos J. Impact of KRAS, BRAF, PIK3CA mutations, PTEN, AREG, EREG expression and skin rash in >/ = 2 line cetuximab-based therapy of colorectal cancer patients. PloS one. 2011; 6:e15980.
24. Llovet P, Sastre J, Ortega JS, Bando I, Ferrer M, Garcia-Alfonso P, Donnay O, Carrato A, Jimenez A, Aranda E, Leon A, Gravalos C, Camara JC, Feliu J, Sanchiz B, Caldes T, et al. Prognostic Value of BRAF, PI3K, PTEN, EGFR Copy Number, Amphiregulin and Epiregulin Status in Patients with KRAS Codon 12 Wild-Type Metastatic Colorectal Cancer Receiving First-Line Chemotherapy with Anti-EGFR Therapy. Molecular diagnosis & therapy. 2015; 19:397-408.
25. Cushman SM, Jiang C, Hatch AJ, Shterev I, Sibley AB, Niedzwiecki D, Venook AP, Owzar K, Hurwitz HI and Nixon AB. Gene expression markers of efficacy and resistance to cetuximab treatment in metastatic colorectal cancer: results from CALGB 80203 (Alliance). Clin Cancer Res. 2015; 21:1078-1086.
26. Seligmann JF, Elliott F, Richman SD, Jacobs B, Hemmings G, Brown S, Barrett JH, Tejpar S, Quirke P and Seymour MT. Combined Epiregulin and Amphiregulin Expression Levels as a Predictive Biomarker for Panitumumab Therapy Benefit or Lack of Benefit in Patients With RAS Wild-Type Advanced Colorectal Cancer. JAMA oncology. 2016.
27. Yarom N and Jonker DJ. The role of the epidermal growth factor receptor in the mechanism and treatment of colorectal cancer. Discovery medicine. 2011; 11:95-105.
28. Takahashi N, Yamada Y, Furuta K, Nagashima K, Kubo A, Sasaki Y, Shoji H, Honma Y, Iwasa S, Okita N, Takashima A, Kato K, Hamaguchi T and Shimada Y. Association between serum ligands and the skin toxicity of anti-epidermal growth factor receptor antibody in metastatic colorectal cancer. Cancer science. 2015; 106:604-610.
29. Thomaidis T, Maderer A, Formentini A, Bauer S, Trautmann M, Schwarz M, Neumann W, Kittner JM, Schad A, Link KH, Rey JW, Weinmann A, Hoffman A, Galle PR, Kornmann M and Moehler M. Proteins of the VEGFR and EGFR pathway as predictive markers for adjuvant treatment in patients with stage II/III colorectal cancer: results of the FOGT-4 trial. J Exp Clin Cancer Res. 2014; 33:83.
30. Hobor S, Van Emburgh BO, Crowley E, Misale S, Di Nicolantonio F and Bardelli A. TGFalpha and amphiregulin paracrine network promotes resistance to EGFR blockade in colorectal cancer cells. Clin Cancer Res. 2014; 20:6429-6438.
31. Loupakis F, Cremolini C, Fioravanti A, Orlandi P, Salvatore L, Masi G, Schirripa M, Di Desidero T, Antoniotti C, Canu B, Faviana P, Sensi E, Lupi C, Fontanini G, Basolo F, Di Paolo A, et al. EGFR ligands as pharmacodynamic biomarkers in metastatic colorectal cancer patients treated with cetuximab and irinotecan. Targeted oncology. 2014; 9:205-214.
32. Morita S, Shirakata Y, Shiraishi A, Kadota Y, Hashimoto K, Higashiyama S and Ohashi Y. Human corneal epithelial cell proliferation by epiregulin and its cross-induction by other EGF family members. Molecular vision. 2007; 13:2119-2128.
33. Piepkorn M, Underwood RA, Henneman C and Smith LT. Expression of amphiregulin is regulated in cultured human keratinocytes and in developing fetal skin. The Journal of investigative dermatology. 1995; 105:802-809.
34. Yarden Y and Sliwkowski MX. Untangling the ErbB signalling network. Nature reviews Molecular cell biology. 2001; 2:127-137.
35. Hynes NE and Lane HA. ERBB receptors and cancer: the complexity of targeted inhibitors. Nature reviews Cancer. 2005; 5:341-354.
36. Bertotti A, Migliardi G, Galimi F, Sassi F, Torti D, Isella C, Cora D, Di Nicolantonio F, Buscarino M, Petti C, Ribero D, Russolillo N, Muratore A, Massucco P, Pisacane A, Molinaro L, et al. A molecularly annotated platform of patient-derived xenografts (“xenopatients”) identifies HER2 as an effective therapeutic target in cetuximab-resistant colorectal cancer. Cancer discovery. 2011; 1:508-523.
37. Tabernero J, Cervantes A, Rivera F, Martinelli E, Rojo F, von Heydebreck A, Macarulla T, Rodriguez-Braun E, Eugenia Vega-Villegas M, Senger S, Ramos FJ, Rosello S, Celik I, Stroh C, Baselga J and Ciardiello F. Pharmacogenomic and pharmacoproteomic studies of cetuximab in metastatic colorectal cancer: biomarker analysis of a phase I dose-escalation study. Journal of clinical oncology. 2010; 28:1181-1189.
38. Brandl K, Sun L, Neppl C, Siggs OM, Le Gall SM, Tomisato W, Li X, Du X, Maennel DN, Blobel CP and Beutler B. MyD88 signaling in nonhematopoietic cells protects mice against induced colitis by regulating specific EGF receptor ligands. Proceedings of the National Academy of Sciences of the United States of America. 2010; 107:19967-19972.
39. Fukata M, Chen A, Vamadevan AS, Cohen J, Breglio K, Krishnareddy S, Hsu D, Xu R, Harpaz N, Dannenberg AJ, Subbaramaiah K, Cooper HS, Itzkowitz SH and Abreu MT. Toll-like receptor-4 promotes the development of colitis-associated colorectal tumors. Gastroenterology. 2007; 133:1869-1881.
40. Rajagopalan H, Bardelli A, Lengauer C, Kinzler KW, Vogelstein B and Velculescu VE. Tumorigenesis: RAF/RAS oncogenes and mismatch-repair status. Nature. 2002; 418:934.
41. Jadad AR, Moore RA, Carroll D, Jenkinson C, Reynolds DJ, Gavaghan DJ and McQuay HJ. Assessing the quality of reports of randomized clinical trials: is blinding necessary? Controlled clinical trials. 1996; 17:1-12.
42. Higgins JP, Thompson SG, Deeks JJ and Altman DG. Measuring inconsistency in meta-analyses. Bmj. 2003; 327:557-560.
43. Peters JL, Sutton AJ, Jones DR, Abrams KR and Rushton L. Contour-enhanced meta-analysis funnel plots help distinguish publication bias from other causes of asymmetry. Journal of clinical epidemiology. 2008; 61:991-996.
44. Begg CB and Mazumdar M. Operating characteristics of a rank correlation test for publication bias. Biometrics. 1994; 50:1088-1101.