
INTRODUCTION
Gastric neuroendocrine neoplasms (g-NENs) are a type of relatively rare tumors mainly derived from enterochromaffin-like cells (ECL-cells) localized in the gastric mucosa [1]. Although increasingly recognized due to the expanding indications for upper gastrointestinal (UGI) endoscopy, g-NENs are still poorly understood tumors with inconsistent clinicopathological and biological characteristics [2, 3]. Apart from early diagnosis, the most important component of proper management is identifying the prognostic factors for g-NEN patients. Based on the National Comprehensive Cancer Network (NCCN) guidelines [4, 5], the TNM scoring system includes the depth of invasion and lymph node metastases as very important prognostic factors for patients with g-NENs. The guidelines recommend that patients with g-NENs should be reevaluated 3 to 12 months after resection and then every 6 to 12 months for up to 10 years. However, the prognostic factors and surveillance strategy for patients with g-NENs have not been clearly defined due to the complexity and rarity of this disease [6, 7]. In recent years, the preoperative blood neutrophil-to-lymphocyte ratio (NLR) is considered to be significantly associated with oncological outcomes [8, 9], and an elevated NLR has been correlated with advanced stage and poor prognosis in a variety of human tumors, including colorectal cancer [10], gastric adenocarcinoma [11], non–small cell lung cancer [8], and hepatocellular carcinoma [12]. However, little research has focused on the relationship between blood NLR and the prognosis of patients with neuroendocrine neoplasms, particularly g-NENs. We evaluated blood NLR as a prognostic indicator and investigated its clinical value for postoperative surveillance in patients undergoing radical surgery for g-NENs.
RESULTS
Blood NLR was elevated in patients with g-NENs
In total, 147 normal volunteers (NVs) with similar age and gender proportions as the neoplasm patients were enrolled (both P > 0.05, Figure 1A). The lymphocyte counts were significantly lower in the blood of patients with g-NENs than in NVs (P < 0.001, Figure 1B). The neutrophil counts and NLR were significantly higher in the patients than in the NVs (both P < 0.001, Figure 1C and 1D).
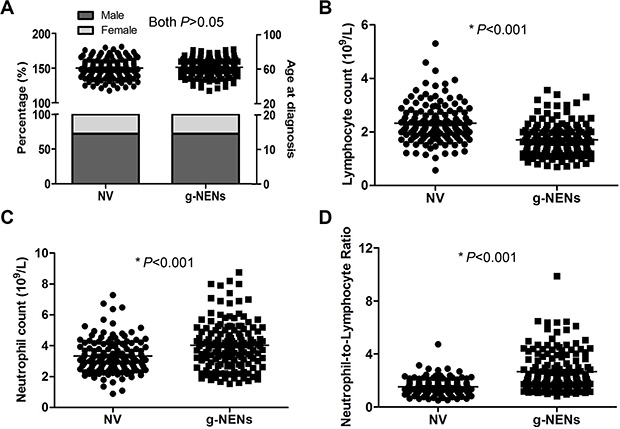
Figure 1: Blood cell counts from normal volunteers and gastric neuroendocrine neoplasms patients. (A) A total of 147 NVs were one-to-one matched by age and gender. There were no differences in age or gender between the NV and the g-NEN groups (both P > 0.05). (B) The lymphocyte counts were significantly lower in the g-NEN group than in the NV group (1.71 ± 0.05 vs 2.33 ± 0.06, P < 0.001). (C) The neutrophil counts from g-NEN patients were significantly higher than those of the NVs (4.03 ± 0.13 vs 3.33 ± 0.09, P < 0.001). (D) Blood NLR in the g-NEN group was significantly higher than in the NV group (2.67 ± 0.13 vs 1.52 ± 0.05, P < 0.001).
An elevated blood NLR was not associated with unfavorable clinicopathologic factors
The univariate analysis revealed (Table 1) that a high blood NLR was associated with large tumor size, high Ki-67 index, invasion depth, high lymph node ratio (LNR), and histological type (all P < 0.05). However, the multivariate analysis revealed no significant differences in the above clinicopathological factors between the two groups (all P > 0.05).
Table 1: Characteristics of 147 patients with g-NENs between different blood neutrophil-to-lymphocyte ratios
Clinicopathological features |
Blood NLR |
Univariable analysis |
Multivariable analysis |
|
|---|---|---|---|---|
≤ 2.20 (n = 77) |
> 2.20 (n = 70) |
P values |
P values |
|
Age (Y) |
|
|
0.193 |
|
≤ 70 |
63 |
51 |
|
|
> 70 |
14 |
19 |
|
|
Gender |
|
|
0.575 |
|
Male |
54 |
52 |
|
|
Female |
23 |
18 |
|
|
Tumor site |
|
|
0.052 |
|
Upper |
40 |
28 |
|
|
Middle |
12 |
14 |
|
|
Lower |
21 |
15 |
|
|
Mixed |
4 |
13 |
|
|
Tumor size (cm) |
|
|
< 0.001* |
0.080 |
≤ 3.5 |
38 |
12 |
|
|
> 3.5 |
39 |
58 |
|
|
Ki-67 index (%) |
|
|
0.001* |
0.675 |
≤ 2 |
17 |
2 |
|
|
≥ 3, ≤ 20 |
14 |
10 |
|
|
> 20 |
46 |
58 |
|
|
Depth of invasion |
|
|
< 0.001* |
0.192 |
T1 |
22 |
1 |
|
|
T2 |
6 |
5 |
|
|
T3 |
31 |
34 |
|
|
T4 |
18 |
30 |
|
|
Lymph node ratio |
|
|
0.001* |
0.079 |
0 |
28 |
11 |
|
|
> 0, ≤ 0.2 |
31 |
21 |
|
|
> 0.2, ≤ 0.4 |
9 |
25 |
|
|
> 0.4 |
9 |
13 |
|
|
Lymphovascular invasion |
|
|
0.513 |
|
No |
47 |
39 |
|
|
Yes |
30 |
31 |
|
|
Histological type |
|
|
0.035* |
0.621 |
NET |
20 |
7 |
|
|
NEC |
21 |
27 |
|
|
MANEC |
36 |
36 |
|
|
ASA status |
|
|
0.337 |
|
1 + 2 |
69 |
59 |
|
|
3 + 4 |
8 |
11 |
|
|
Postoperative complication |
|
|
0.587 |
|
No |
57 |
49 |
|
|
Yes |
20 |
21 |
|
|
Elevated blood NLR was associated with poor prognosis
As shown in Figure 2, the RFS and OS were analyzed according to age, gender, tumor site and size, lymphovascular invasion, histological type, ASA status, postoperative complications, surgical approach, invasion depth, LNR, and Ki-67 index. The hazard ratio and 95% confidence interval for RFS and OS were compared among the subgroups. The long-term survivals, including RFS and OS, were poorer in the high blood NLR group than in the low blood NLR group.
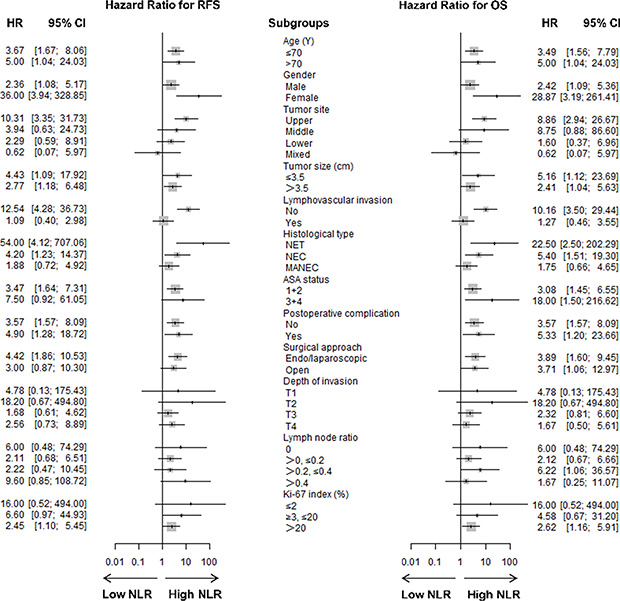
Figure 2: Forest plot showing hazard ratios (oblongs) and 95% CI (bars) for RFS (left) and OS (right) (according to subgroups) among 147 g-NENs patients undergoing radical surgery. Long-term survival, including RFS and OS, was better among patients with low blood NLR than among patients with high blood NLR. HR = hazard ratio, CI = confidence interval.
Blood NLR, combined with the Ki-67 index and LNR, was a superior prognosis predicting system
To investigate which parameters were associated with clinical outcomes, a univariate survival analysis and a multivariate survival analysis for RFS and OS were performed. The univariate analysis identified larger tumor size, presence of postoperative complications, greater invasion depth, higher LNR, higher Ki-67 index, and higher blood NLR as prognostic indicators for poorer RFS (all P < 0.05, Table 2). The tumor size, invasion depth, LNR, Ki-67 index, and blood NLR were identified as prognostic indicators for OS (all P < 0.05, Table 3). According to the multivariate analysis, the Ki-67 index, LNR, and blood NLR were independent prognostic factors for RFS and OS (all P < 0.05, Table 2 and Table 3).
Table 2: Variables associated with recurrence-free survival according to the Cox proportional hazards regression model
Variables |
Univariable analysis |
Multivariable analysis |
||||
|---|---|---|---|---|---|---|
Hazard ratio |
95% CI |
P |
Hazard ratio |
95% CI |
P |
|
Age (Y) |
|
|
0.865 |
|
|
|
≤ 70 |
Reference |
|
|
|
|
|
> 70 |
1.052 |
0.587 to 1.884 |
|
|
|
|
Gender |
|
|
0.135 |
|
|
|
Male |
Reference |
|
|
|
|
|
Female |
0.627 |
0.339 to 1.157 |
|
|
|
|
Tumor site |
|
|
0.744 |
|
|
|
Upper |
Reference |
|
|
|
|
|
Middle |
0.751 |
0.356 to 1.585 |
|
|
|
|
Lower |
0.908 |
0.488 to 1.688 |
|
|
|
|
Mixed |
1.289 |
0.566 to 2.938 |
|
|
|
|
Tumor size (cm) |
|
|
0.008* |
|
|
0.245 |
≤ 3.5 |
Reference |
|
|
Reference |
|
|
> 3.5 |
2.362 |
1.255 to 4.444 |
|
NA |
NA |
|
Clinical classification |
|
|
0.115 |
|
|
|
Type 1 |
Reference |
|
|
|
|
|
Type 2 |
6.397 |
0.747 to 54.814 |
|
|
|
|
Type 3 |
9.429 |
1.206 to 73.708 |
|
|
|
|
Type 4 |
10.054 |
1.385 to 72.968 |
|
|
|
|
Histological type |
|
|
0.121 |
|
|
|
NET |
Reference |
|
|
|
|
|
NEC |
2.257 |
1.013 to 5.029 |
|
|
|
|
MANEC |
1.611 |
0.736 to 3.526 |
|
|
|
|
ASA status |
|
|
0.222 |
|
|
|
1 + 2 |
Reference |
|
|
|
|
|
3 + 4 |
1.503 |
0.782 to 2.889 |
|
|
|
|
Postoperative complication |
|
|
0.041* |
|
|
0.215 |
No |
Reference |
|
|
Reference |
|
|
Yes |
1.768 |
1.023 to 3.053 |
|
NA |
NA |
|
Surgical approach |
|
|
0.209 |
|
|
|
Endo/laparoscopic |
Reference |
|
|
|
|
|
Open |
0.719 |
0.429 to 1.203 |
|
|
|
|
Depth of invasion |
|
|
0.006* |
|
|
0.546 |
T1 |
Reference |
|
|
Reference |
|
|
T2 |
8.125 |
0.845 to 78.172 |
|
NA |
NA |
|
T3 |
12.443 |
1.687 to 91.781 |
|
NA |
NA |
|
T4 |
20.671 |
2.819 to 151.578 |
|
NA |
NA |
|
Lymph node ratio |
|
|
< 0.001* |
|
|
< 0.001* |
0 |
Reference |
|
|
Reference |
|
|
> 0, ≤ 0.2 |
6.003 |
1.789 to 20.141 |
|
4.213 |
1.237 to 14.347 |
|
> 0.2, ≤ 0.4 |
8.714 |
2.588 to 29.337 |
|
4.557 |
1.320 to 15.734 |
|
> 0.4 |
18.324 |
5.350 to 62.765 |
|
15.506 |
4.474 to 53.746 |
|
Ki-67 index (%) |
|
|
0.003* |
|
|
0.014* |
≤ 2 |
Reference |
|
|
Reference |
|
|
≥ 3, ≤ 20 |
3.024 |
0.641 to 14.254 |
|
1.827 |
0.369 to 9.054 |
|
> 20 |
7.082 |
1.721 to 29.145 |
|
3.993 |
0.923 to 17.281 |
|
Blood NLR |
|
|
< 0.001* |
|
|
< 0.001* |
≤ 2.20 |
Reference |
|
|
Reference |
|
|
> 2.20 |
3.457 |
2.020 to 5.917 |
|
2.751 |
1.572 to 4.813 |
|
Table 3: Variables associated with overall survival according to the Cox proportional hazards regression model
Variables |
Univariable analysis |
Multivariable analysis |
||||
|---|---|---|---|---|---|---|
Hazard ratio |
95% CI |
P |
Hazard ratio |
95% CI |
P |
|
Age (Y) |
|
|
0.496 |
|
|
|
≤ 70 |
Reference |
|
|
|
|
|
> 70 |
1.228 |
0.679 to 2.221 |
|
|
|
|
Gender |
|
|
0.175 |
|
|
|
Male |
Reference |
|
|
|
|
|
Female |
0.643 |
0.339 to 1.218 |
|
|
|
|
Tumor site |
|
|
0.178 |
|
|
|
Upper |
Reference |
|
|
|
|
|
Middle |
0.604 |
0.277 to 1.315 |
|
|
|
|
Lower |
0.557 |
0.273 to 1.138 |
|
|
|
|
Mixed |
1.337 |
0.588 to 3.043 |
|
|
|
|
Tumor size (cm) |
|
|
0.003* |
|
|
0.807 |
≤ 3.5 |
Reference |
|
|
Reference |
|
|
> 3.5 |
2.943 |
1.441 to 6.009 |
|
NA |
NA |
|
Clinical classification |
|
|
0.116 |
|
|
|
Type 1 |
Reference |
|
|
|
|
|
Type 2 |
4.576 |
0.510 to 41.017 |
|
|
|
|
Type 3 |
8.281 |
1.048 to 65.435 |
|
|
|
|
Type 4 |
8.809 |
1.211 to 64.084 |
|
|
|
|
Histological type |
|
|
0.141 |
|
|
|
NET |
Reference |
|
|
|
|
|
NEC |
2.291 |
0.982 to 5.345 |
|
|
|
|
MANEC |
1.652 |
0.716 to 3.808 |
|
|
|
|
ASA status |
|
|
0.160 |
|
|
|
1 + 2 |
Reference |
|
|
|
|
|
3 + 4 |
1.633 |
0.823 to 3.241 |
|
|
|
|
Postoperative complication |
|
|
0.382 |
|
|
|
No |
Reference |
|
|
|
|
|
Yes |
1.313 |
0.713 to 2.418 |
|
|
|
|
Surgical approach |
|
|
0.227 |
|
|
|
Endo/laparoscopic |
Reference |
|
|
|
|
|
Open |
0.719 |
0.421 to 1.228 |
|
|
|
|
Depth of invasion |
|
|
0.020* |
|
|
0.523 |
T1 |
Reference |
|
|
Reference |
|
|
T2 |
8.653 |
0.899 to 83.244 |
|
NA |
NA |
|
T3 |
11.637 |
1.572 to 86.134 |
|
NA |
NA |
|
T4 |
17.657 |
2.397 to 130.061 |
|
NA |
NA |
|
Lymph node ratio |
|
|
<0.001* |
|
|
<0.001* |
0 |
Reference |
|
|
Reference |
|
|
> 0, ≤ 0.2 |
5.302 |
1.567 to 17.937 |
|
3.753 |
1.087 to 12.961 |
|
> 0.2, ≤ 0.4 |
7.282 |
2.144 to 24.731 |
|
4.115 |
1.175 to 14.409 |
|
> 0.4 |
16.085 |
4.655 to 55.584 |
|
11.412 |
3.208 to 40.594 |
|
Ki-67 index (%) |
|
|
0.003* |
|
|
0.011* |
≤ 2 |
Reference |
|
|
Reference |
|
|
≥ 3, ≤ 20 |
2.523 |
0.524 to 12.155 |
|
1.348 |
0.257 to 7.078 |
|
> 20 |
6.666 |
1.613 to 27.553 |
|
3.628 |
0.820 to 16.047 |
|
Blood NLR |
|
|
< 0.001* |
|
|
0.005* |
≤ 2.20 |
Reference |
|
|
Reference |
|
|
> 2.20 |
3.418 |
1.925 to 6.068 |
|
2.334 |
1.286 to 4.237 |
|
Prognostic nomograms and its calibration curve were established with the R software (Figure 3 and Supplementary Figure, respectively). The C-index of the nomograms for RFS (OS) with blood NLR, LNR, or Ki-67 index were 0.663 (0.652), 0.709 (0.695), and 0.630 (0.628), respectively. However, the C-index of nomograms for RFS (OS), including all three variables, were up to 0.776 (0.760).We also calculated the C-index of the TNM staging system for RFS (OS), which was 0.678 (0.667). All these data indicated that the nomograms, including blood NLR, LNR, or Ki-67 index, had a superior ability to predict clinical outcomes for patients with g-NENs, as well as the traditional TNM staging system.
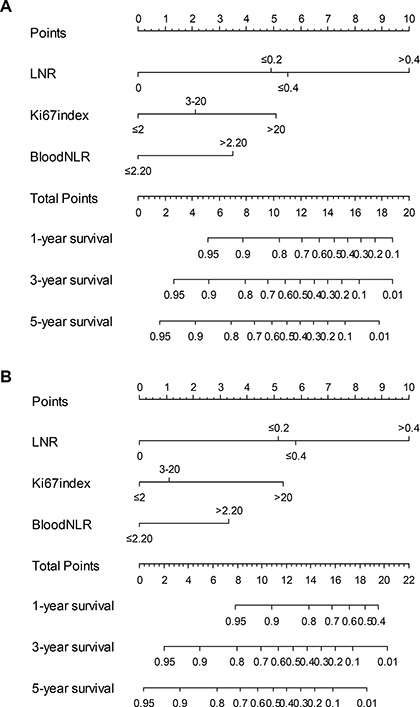
Figure 3: Nomograms for predicting recurrence free survival (A) and overall survival (B) of patients following g-NEN resection. LNR = lymph node ratio.
Blood NLR and the Ki-67 index were both significantly correlated with recurrence site and recurrence time
The recurrence rate was 37% (55/147). The median time to recurrence was 9 (range 1–56) months, and 87% (48/55) of patients experienced recurrence within the first 2 years, and only 7% (4/55) of patients experienced recurrence > 3 years after surgery (Figure 4B). As shown in Figure 4C and 4D, both the blood NLR and Ki-67 index were significantly higher in the recurrence group than in the non-recurrence group (both P < 0.05). Both the blood NLR and Ki-67 index were negatively correlated with the recurrence time (both P < 0.05, Figure 4E and 4F).
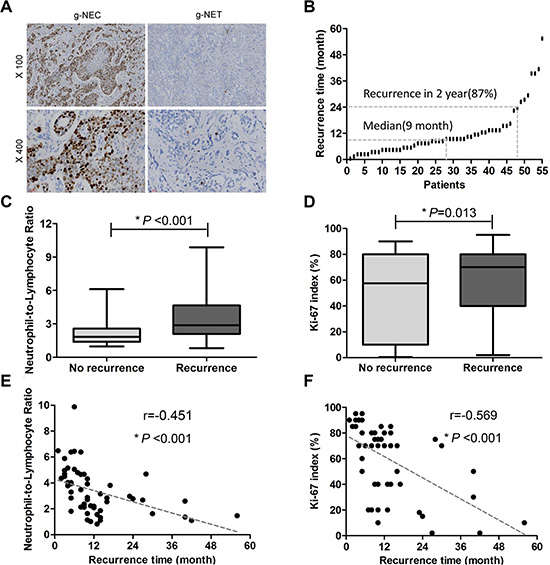
Figure 4: The relationships among Ki-67 index, blood NLR and tumor recurrence. (A) Representative immunohistochemical staining for Ki-67. (B) Fifty-five patients experienced tumor recurrence. The median time to recurrence was 9 (range 1–56) months, and 87% (48/55) patients recurred within the first 2 years. (C) Significant differences in blood NLR were observed between the recurrence group and the non-recurrence group (3.36 ± 0.24% vs 2.26 ± 0.12%, mean ± SEM. P < 0.001). (D) The Ki-67 index was significantly higher in the recurrence group (60.67 ± 3.66%) versus the non-recurrence group (47.23 ± 3.49%, P = 0.013). (E) The blood NLR was inversely correlated with time to recurrence (r = −0.451, P < 0.001). (F) The Ki-67 index inversely correlated with time to recurrence (r = −0.569, P < 0.001).
Details regarding the recurrence site following surgery were listed in Table 4. The recurrence rate in the high blood NLR group was significantly higher than in the low blood NLR group (P < 0.001). Similar results for recurrence rate were also observed between the high Ki-67 index group and the low and intermediate Ki-67 index groups (P = 0.023). Additionally, elevated blood NLR was significantly associated with both liver metastasis and peritoneal metastasis (both P < 0.05), whereas only liver metastasis was significantly correlated with a high Ki-67 index (P = 0.008).
Table 4: Site of recurrence after surgery
Site of recurrence |
Blood NLR |
|
Ki-67 index (%) |
P |
||
|---|---|---|---|---|---|---|
≤ 2.20 (n = 77) |
> 2.20 (n = 70) |
P |
≤ 20 (n = 43) |
> 20 (n = 104) |
||
Liver |
10 |
29 |
< 0.001* |
5 |
34 |
0.008* |
Peritoneal cavity |
3 |
12 |
0.008* |
2 |
13 |
0.232 |
Lynph node |
4 |
9 |
0.102 |
2 |
11 |
0.347 |
Lung |
3 |
4 |
0.709 |
0 |
7 |
0.106 |
Bone |
2 |
4 |
0.425 |
1 |
5 |
0.671 |
Adrenal gland |
2 |
3 |
0.669 |
0 |
5 |
0.322 |
Pancreas |
1 |
3 |
0.347 |
1 |
3 |
1.000 |
Locoregional recurrence |
2 |
3 |
0.669 |
2 |
3 |
0.630 |
Spleen |
0 |
2 |
0.225 |
1 |
1 |
0.501 |
Kidney |
0 |
2 |
0.225 |
0 |
2 |
1.000 |
Brain |
1 |
0 |
1.000 |
0 |
1 |
1.000 |
Number of patients with recurrence |
16 |
39 |
< 0.001* |
10 |
45 |
0.023* |
DISCUSSION
Neuroendocrine neoplasms, particularly g-NENs in the digestive system, are a unique subgroup of tumors with great clinical heterogeneity and varied biology. Recently, the incidence of g-NENs, which account for 6% of neuroendocrine neoplasms in all systems, has gradually increased due to improvements in diagnostic techniques and increasing knowledge regarding g-NENs [13]. In a literature review, the 5-year survival rate of g-NENs was 30–43.8% [14–16]. Data regarding the clinical characteristics and biological tumor characteristics were significantly associated with g-NEN patients’ prognosis [17–19]. However, the independent prognostic factors for g-NEN patients are still controversial. To our knowledge, there are still no reports regarding individual prognosis prediction models for g-NENs. This study explored the independent prognostic factors of g-NENs to facilitate the development of a tumor prognosis prediction model to provide individualized therapy and follow-up.
In recent years, pathological staging and the Ki-67 index were viewed as valuable prognostic factors for patients with g-NENs. Deep tumor invasion, the presence of lymph node metastasis and distant metastasis, and a high Ki-67 index were associated with decreased long-term survival [6, 7, 20]. In this study, the rate of lymph node metastasis and the Ki-67 index were independent risk factors for OS and RFS in patients with g-NENs, which was consistent with previous reports. Although there were obvious prognostic difference between NET patients and NEC patients, histological type was not a prognostic factor in the study. Small sample sizes and short-term following up in the study may explain the problem. In addition, increasing evidence has confirmed that the systemic inflammatory response is closely related to the prognosis of malignant tumors [21–23], but the relationship between the systemic inflammatory response and g-NENs has been unclear. Our study was the first to compare blood NLR between patients with g-NENs and NVs. The blood NLR in the g-NENs patients was higher than in the NVs. We then observed, through forest Figures, that a high blood NLR was significantly associated with a poor prognosis, and a multivariate analysis further revealed that blood NLR was an independent risk factor for patients with g-NENs. Currently, nomograms, a new type of statistical prediction model, have been developed for the majority of cancer types [24, 25]. Prognostic nomograms are useful and are relatively easy to read with simple graphics. Nomograms enable a combination of multiple relevant clinical predictors and can be applied to individual patients. For many cancers, nomograms compare favorably to the traditional TNM staging systems and thus have been proposed as an important tool in clinical practice [26, 27]. In this study, we established prognostic nomograms for g-NENs by combining blood NLR, the Ki-67 index, and LNR, and the C-index in the combination was higher than using any one parameter alone. Furthermore, this combination had a high predictive ability as well as the traditional TNM staging system. Therefore, the combination of blood NLR, the Ki-67 index and LNR, as a novel prognostic system, may provide simple, more accurate prognosis predictions.
Postoperative local recurrence and distant metastasis are the leading causes of death for malignant tumor patients. In this study, the 5 years recurrence rate for patients with g-NENs after radical surgery was 37%. Liver metastasis was the most common type of recurrence, whereas the spleen, kidney, and brain were relatively rare sites of recurrence. Our results were similar to previous reports [7]. In the present study, both the Ki-67 index and blood NLR were closely related to the site of tumor recurrence and a high incidence of liver metastasis was observed in patients with a high blood NLR or high Ki-67 index. In addition, in patients who had recurrence, both the blood NLR and Ki-67 index had strong inverse relationships with the time to recurrence. Thus, during the process of postoperative follow-up, clinicians should recognize the diagnostic and prognostic value of the Ki-67 index. To discover potential hepatic metastases earlier, clinicians should also recognize the predictive value of tumor recurrence based on the preoperative blood NLR.
As most of the current guidelines recommend, postoperative surveillance for g-NENs begin at 3 to 12 months after radical surgery and the intervals vary from 6 to 12 months [4, 5, 28]. In the present group, 37 (67%) and 48 (87%) patients with recurrence suffered a tumor relapse within the first and second year after primary resection, respectively. The earliest time of tumor recurrence was only one month after surgery. One patient experienced recurrence at 5 years after surgery. According to the guidelines for postoperative surveillance, starting at 3 months with intervals of 6 months after surgery, 24 (44%) patients in this study would have had delayed tumor identification by at least four months, which implies that these surveillance strategies are not the most effective measures to identify early tumor recurrence. Based on these findings, we recommend that patients with g-NENs and a high blood NLR or Ki-67 index should be closely monitored at 3 month intervals starting at the first month post-surgery for the first 2 years after radical surgery to identify tumor recurrence more quickly.
This study had some limitations. This study was uncontrolled and performed within a single institution. The results should be confirmed by subsequent prospective studies. There were some heterogeneity in this study, such as histological type (including NET, NEC and MANEC). Through accumulating more cases, we will focus on just one of these three types in the future. However, to our knowledge, our study enrolled more patients with g-NENs than similar literature reports and demonstrated that the blood NLR was able to predict long-term survival relatively accurately for patients for the first time. Our study could be the basis for a subsequent prospective clinical study.
In conclusion, as a simple, easily measurable, and inexpensive inflammatory biomarker, a preoperative blood NLR is an independent predictor of RFS and OS, and its combination with the Ki-67 index and LNR could improve prognosis prediction in g-NENs patients undergoing radical surgery. For patients with a blood NLR > 2.20 or a Ki-67 index > 20%, we recommend a modified surveillance strategy starting at the first month post-surgery and at intervals of 3 months for the first 2 years after surgical resection.
MATERIALS AND METHODS
General conditions
A total of 173 patients diagnosed with g-NENs at Fujian Medical University Union Hospital between March 2006 and March 2015 were identified from a prospective database. The exclusion criteria for this study were as follows (Figure 5): metastatic disease confirmed preoperatively or at surgery (n = 11), perioperative death (n = 1), and incomplete/inaccurate medical records (n = 14). A total of 147 patients who underwent curative-intent surgery for g-NENs were enrolled in this study. The pathological data for these patients were reconfirmed by two pathologists according to the North American Neuroendocrine Tumor Society (NANETS) guidelines (2010) [28]. In total, 27 (18.4%) patients were diagnosed with gastric neuroendocrine tumors (g-NETs), 48 (32.7%) with gastric neuroendocrine carcinoma (g-NEC), and 72 (48.9%) with gastric mixed adenoneuroendocrine carcinoma (g-MANEC). Among these patients, 97 (66.0%) received adjuvant chemotherapy. A total of 147 NVs were also enrolled in the study. The ethics committee of Fujian Union Hospital approved this retrospective study. Written consent was obtained from the patients, and their information was stored in the hospital database and used for research.
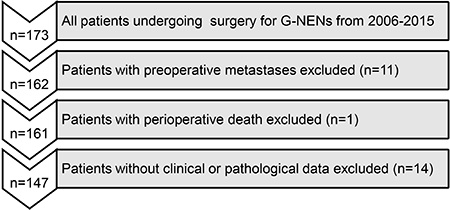
Figure 5: Flow diagram of patient inclusion and exclusion.
The preoperative blood cell counts that were collected closest to the date of surgery were obtained from the electronic patient record system in our hospital. The blood NLR was calculated as the absolute neutrophil count divided by the absolute lymphocyte count. A Receiver operating characteristic (ROC) curve analysis was performed in relation to the presence of recurrence and death from any cause. For all 147 patients, a blood NLR of 2.20 had the highest sensitivity and specificity for both outcomes. Therefore, patients were categorized into two groups: low blood NLR (≤ 2.20) with 77 patients and high blood NLR (> 2.20) with 70 patients.
Immunohistochemistry analysis
Immunohistochemical staining for Ki-67 was performed using formalin-fixed, paraffin-embedded tumor tissue sections (3 μm thick) from 147 g-NENs (Figure 4A). Briefly, the slides were baked at 65°C for 2 hours, deparaffinized with xylene, and rehydrated in graded alcohol. The slides were subjected to antigen retrieval via the high pressure method using antigen retrieval solution. Endogenous peroxidase was inactivated with 3% H2O2 in methanol. The nonspecific binding was blocked by incubation using 1% bovine serum albumin (BSA; Sigma-Aldrich; St. Louis, MO) in phosphate buffered saline (PBS). Subsequently, the slides were incubated overnight at 4°C with primary monoclonal mouse antibody against Ki-67 (1:100 dilution; Dako; Carpinteria, CA, USA). Normal goat serum was used as a negative control. After washing with PBS, tissue sections were incubated with secondary antibody for 20 minutes at room temperature and then stained with diaminobenzidine (DAB). Finally, the slides were counterstained with hematoxylin, dehydrated, and mounted with a coverslip. Two pathologists blinded to the clinical data reviewed the immunoreactivity for Ki-67 protein under a light microscope. The Ki-67 index was scored according to the percentage of stained tumor cells based on 2000-cell counts [29] and was classified as low (≤ 2% positive cells), intermediate (3% to 20% positive cells), or high (> 20% positive cells). Overall, 19 (12.9%), 24 (16.3%) and 104 (70.8%) patients had a low (≤ 2%), intermediate (3~20%) and high (> 20%) Ki-67 index, respectively.
Postoperative follow-up
The patients were monitored after surgery by telephone calls, outpatient visits and letters. The overall survival (OS) time was calculated as the number of months from the date of surgery to the date of last contact, date of death for any cause, or date of end point. The recurrence free survival (RFS) time was calculated as the number of months from the date of surgery to the date of identification of disease recurrence (either radiological or histological), the date of death or last contact, or the date of end point. Our department follows a standardized surveillance protocol and follows up with patients at three-month intervals for the first two years, six-month intervals for years two to five, and at least once per year five years after surgery. The postoperative follow-up data included clinical symptoms and signs, laboratory tests, imagological examinations, and endoscopy and biopsy results. In this study, the median follow-up was 40 (range 2–106) months. The median survival time was 25 (range 2–106) months. The median RFS time was 21 (range 1–106) months.
Construction and validation of the nomogram
On the basis of the results of the multivariable analysis, a nomogram was formulated by R 3.2.0 (http://www.r-project.org) with the survival and rms package. A final model was selected using a backward step-down process, which used the Akaike information criterion as a stopping rule. The model performance for predicting outcome was evaluated by calculating the concordance index (C-index). Calibration of the nomogram for 1-, 3-, and 5-year RFS and OS was performed by comparing the predicted survival with the observed survival after bias correction. Bootstraps with 1,000 resample were used for these activities.
Statistical analysis
All enumeration and measurement data were analyzed using SPSS 17.0 for Windows (SPSS, Chicago, IL). Chi-square, Fisher’s exact or unpaired Student’s t tests were used to compare the difference between blood NLR and the clinicopathologic factors, as appropriate. A Pearson correlation was utilized to evaluate the relationship among blood NLR, Ki-67 index and recurrence. Univariate survival analysis was performed using the Kaplan-Meier method, and a log-rank test was used to assess the significance between groups. A multivariate survival analysis was performed using the Cox proportional hazards model. The significant variables from the univariate analysis were included in the model. P < 0.05 was considered to be significant.
ACKNOWLEDGMENTS AND FUNDING
The authors thank Prof. Yao Lin for valuable advice and discussions.
CONFLICTS OF INTEREST
The authors declare that there are no conflicts of interest associated with the publication of this manuscript.
FINANCIAL SUPPORT
This work was supported by the National Key Clinical Specialty Discipline Construction Program of China (No. [2012] 649) and Key Projects of Science and Technology Plan of Fujian Province (No. 2014Y0025).
REFERENCES
1. Burkitt MD, Pritchard DM. Review article: Pathogenesis and management of gastric carcinoid tumours. Alimentary pharmacology & therapeutics. 2006; 24:1305–1320.
2. Tsikitis VL, Wertheim BC, Guerrero MA. Trends of incidence and survival of gastrointestinal neuroendocrine tumors in the United States: a seer analysis. Journal of Cancer. 2012; 3:292–302.
3. Kloppel G, Perren A, Heitz PU. The gastroenteropancreatic neuroendocrine cell system and its tumors: the WHO classification. Annals of the New York Academy of Sciences. 2004; 1014:13–27.
4. Kulke MH, Shah MH, Benson AB, 3rd, Bergsland E, Berlin JD, Blaszkowsky LS, Emerson L, Engstrom PF, Fanta P, Giordano T, Goldner WS, Halfdanarson TR, Heslin MJ et al.Neuroendocrine tumors, version 1.2015. Journal of the National Comprehensive Cancer Network. 2015; 13:78–108.
5. Kloppel G, Couvelard A, Perren A, Komminoth P, McNicol AM, Nilsson O, Scarpa A, Scoazec JY, Wiedenmann B, Papotti M, Rindi G, Plockinger U, Mallorca Consensus Conference p and European Neuroendocrine Tumor S. ENETS Consensus Guidelines for the Standards of Care in Neuroendocrine Tumors: towards a standardized approach to the diagnosis of gastroenteropancreatic neuroendocrine tumors and their prognostic stratification. Neuroendocrinology. 2009; 90:162–166.
6. Faggiano A, Ferolla P, Grimaldi F, Campana D, Manzoni M, Davi MV, Bianchi A, Valcavi R, Papini E, Giuffrida D, Ferone D, Fanciulli G, Arnaldi G, et al. Natural history of gastro-entero-pancreatic and thoracic neuroendocrine tumors. Data from a large prospective and retrospective Italian epidemiological study: the NET management study. Journal of endocrinological investigation. 2012; 35:817–823.
7. Lewkowicz E, Trofimiuk-Muldner M, Wysocka K, Pach D, Kieltyka A, Stefanska A, Sowa-Staszczak A, Tomaszewska R, Hubalewska-Dydejczyk A. Gastroenteropancreatic neuroendocrine neoplasms: a 10-year experience of a single center. Polskie Archiwum Medycyny Wewnetrznej. 2015; 125:337–346.
8. Tomita M, Shimizu T, Ayabe T, Yonei A, Onitsuka T. Preoperative neutrophil to lymphocyte ratio as a prognostic predictor after curative resection for non-small cell lung cancer. Anticancer research. 2011; 31:2995–2998.
9. Kim EY, Lee JW, Yoo HM, Park CH, Song KY. The Platelet-to-Lymphocyte Ratio Versus Neutrophil-to-Lymphocyte Ratio: Which is Better as a Prognostic Factor in Gastric Cancer? Annals of surgical oncology. 2015; 22:4363–4370.
10. Malietzis G, Giacometti M, Askari A, Nachiappan S, Kennedy RH, Faiz OD, Aziz O, Jenkins JT. A preoperative neutrophil to lymphocyte ratio of 3 predicts disease-free survival after curative elective colorectal cancer surgery. Annals of surgery. 2014; 260:287–292.
11. Wang SC, Chou JF, Strong VE, Brennan MF, Capanu M, Coit DG. Pretreatment Neutrophil to Lymphocyte Ratio Independently Predicts Disease-specific Survival in Resectable Gastroesophageal Junction and Gastric Adenocarcinoma. Ann Surg. 2016; 263:292–7.
12. Mano Y, Shirabe K, Yamashita Y, Harimoto N, Tsujita E, Takeishi K, Aishima S, Ikegami T, Yoshizumi T, Yamanaka T, Maehara Y. Preoperative neutrophil-to-lymphocyte ratio is a predictor of survival after hepatectomy for hepatocellular carcinoma: a retrospective analysis. Annals of surgery. 2013; 258:301–305.
13. Niederle MB, Hackl M, Kaserer K, Niederle B. Gastroenteropancreatic neuroendocrine tumours: the current incidence and staging based on the WHO and European Neuroendocrine Tumour Society classification: an analysis based on prospectively collected parameters. Endocrine-related cancer. 2010; 17:909–918.
14. Kim BS, Oh ST, Yook JH, Kim KC, Kim MG, Jeong JW, Kim BS. Typical carcinoids and neuroendocrine carcinomas of the stomach: differing clinical courses and prognoses. American journal of surgery. 2010; 200:328–333.
15. Okita NT, Kato K, Takahari D, Hirashima Y, Nakajima TE, Matsubara J, Hamaguchi T, Yamada Y, Shimada Y, Taniguchi H, Shirao K. Neuroendocrine tumors of the stomach: chemotherapy with cisplatin plus irinotecan is effective for gastric poorly-differentiated neuroendocrine carcinoma. Gastric cancer. 2011; 14:161–165.
16. Pape UF, Jann H, Muller-Nordhorn J, Bockelbrink A, Berndt U, Willich SN, Koch M, Rocken C, Rindi G, Wiedenmann B. Prognostic relevance of a novel TNM classification system for upper gastroenteropancreatic neuroendocrine tumors. Cancer. 2008; 113:256–265.
17. Hu HK, Ke NW, Li A, Du XJ, Guo Q, Hu WM. Clinical characteristics and prognostic factors of gastroenteropancreatic neuroendocrine tumors: a single center experience in China. Hepato-gastroenterology. 2015; 62:178–183.
18. Ezziddin S, Attassi M, Yong-Hing CJ, Ahmadzadehfar H, Willinek W, Grunwald F, Guhlke S, Biersack HJ, Sabet A. Predictors of long-term outcome in patients with well-differentiated gastroenteropancreatic neuroendocrine tumors after peptide receptor radionuclide therapy with 177Lu-octreotate. Journal of nuclear medicine. 2014; 55:183–190.
19. Xu X, Li J, Han X, Shi C, Jin D, Lou W. Clinical characteristics and prognostic factors of patients with gastric neuroendocrine carcinoma treated with radical surgery. Chinese medical journal. 2014; 127:2419–2422.
20. Kubota T, Ohyama S, Hiki N, Nunobe S, Yamamoto N, Yamaguchi T. Endocrine carcinoma of the stomach: clinicopathological analysis of 27 surgically treated cases in a single institute. Gastric cancer. 2012; 15:323–330.
21. Coussens LM, Werb Z. Inflammation and cancer. Nature. 2002; 420:860–867.
22. Mantovani A. Cancer: Inflaming metastasis. Nature. 2009; 457:36–37.
23. Mantovani A, Allavena P, Sica A, Balkwill F. Cancer-related inflammation. Nature. 2008; 454:436–444.
24. Iasonos A, Schrag D, Raj GV, Panageas KS. How to build and interpret a nomogram for cancer prognosis. Journal of clinical oncology. 2008; 26:1364–1370.
25. Liang W, Zhang L, Jiang G, Wang Q, Liu L, Liu D, Wang Z, Zhu Z, Deng Q, Xiong X, Shao W, Shi X, He J. Development and validation of a nomogram for predicting survival in patients with resected non-small-cell lung cancer. Journal of clinical oncology. 2015; 33:861–869.
26. Sternberg CN. Are nomograms better than currently available stage groupings for bladder cancer? Journal of clinical oncology. 2006; 24:3819–3820.
27. Wang Y, Li J, Xia Y, Gong R, Wang K, Yan Z, Wan X, Liu G, Wu D, Shi L, Lau W, Wu M, Shen F. Prognostic nomogram for intrahepatic cholangiocarcinoma after partial hepatectomy. Journal of clinical oncology. 2013; 31:1188–1195.
28. Anthony LB, Strosberg JR, Klimstra DS, Maples WJ, O’Dorisio TM, Warner RR, Wiseman GA, Benson AB, 3rd, Pommier RF and North American Neuroendocrine Tumor S. The NANETS consensus guidelines for the diagnosis and management of gastrointestinal neuroendocrine tumors (nets): well-differentiated nets of the distal colon and rectum. Pancreas. 2010; 39:767–774.
29. Pelosi G, Bresaola E, Bogina G, Pasini F, Rodella S, Castelli P, Iacono C, Serio G, Zamboni G. Endocrine tumors of the pancreas: Ki-67 immunoreactivity on paraffin sections is an independent predictor for malignancy: a comparative study with proliferating-cell nuclear antigen and progesterone receptor protein immunostaining, mitotic index, and other clinicopathologic variables. Human pathology. 1996; 27:1124–1134.