
INTRODUCTION
Breast cancer, the leading cause of death among women in most countries worldwide, is rapidly increasing in China [1, 2]. Despite the development of novel treatment strategies for some malignances, chemotherapy continues to be the standard therapy for most human cancers. Multidrug resistance (MDR) remains to be a serious obstacle in breast cancer treatment [3, 4]. Recently, accumulating evidence has indicated the important role of glucosylceramide synthase (GCS) in MDR [5, 6]. GCS is a transmembrane protein encoded by the UGCG gene in humans. It can transfer UDP-glucose to ceramide to form glucosylceramide, and allow cells to escape from ceramide-induced cellular apoptosis [7, 8]. Liu et al. introduced GCS cDNA into MCF-7 cells, which increased GCS enzymatic activity and resulted in resistance to doxorubicin [9]. A number of methods that suppress the expression of GCS, such as specific inhibitors, antisense oligonucleotides and short interfering RNA, render MDR cells chemosensitive [10, 11]. Hence, understanding of the mechanism of GCS expression in breast cancer cells is essential to discover novel chemotherapy targets and improve the efficacy of chemotherapy treatment.
Genetic abnormalities are insufficient to explain the mechanism of carcinogenesis. Epigenetics is becoming an important field of cancer research. DNA methylation is the predominant epigenetic modification that inhibits gene expression [12]. Mammalian DNA is heavily methylated at cytosine residues within CpG dinucleotides, with 60–80% of such residues being methylated [13]. Various genes show an inverse relationship between DNA methylation and transcription in normal and malignant cells [14]. Growing evidence indicates that DNA methylation status might be involved in MDR. The MDR1 promoter contains a CpG island that may be inhibited by methylation [15, 16, 17]. The breast cancer resistant protein (BCRP) has a promoter with the similar CpG island that has been shown to inhibit gene expression via methylation [18]. The human GCS protein is a glycoprotein containing 394 amino acids encoded by 1182 nucleotides. GCS includes a G + C rich 5′ untranslated region of 290 nucleotides, containing a CpG island [19]. These findings suggested that DNA methylation might also be involved in inhibiting GCS expression. No research has determined the role of DNA methylation in the transcriptional regulation of GCS in breast cancer cells. This study aimed to rectify this omission from the literature.
RESULTS
GCS promoter methylation associates with its expression and clinicopathological parameters
In primary human invasive ductal carcinoma tissues, GCS expression was mainly observed in the cytoplasm of cancer cells. Immunohistochemistry analysis revealed GCS-negative and GCS-positive (Figure 1A) expression.MSP was used to measure the methylation status of GCS. T1 and T2 are representative of unmethylation status, T3 and T4 are representative of methylation status (Figure 1B). Among 40 cases of GCS-positive breast cancer tissues, 25% (10/40) presented a methylated GCS promoter. Meanwhile 87.5% (35/40) presented a methylated GCS promoter in 40 cases of GCS-negative group (Table 1). A significant difference appeared comparing the two groups. This result suggested that methylation of the GCS promoter was inversely associated with the GCS expression (r = −0.63, p < 0.01).
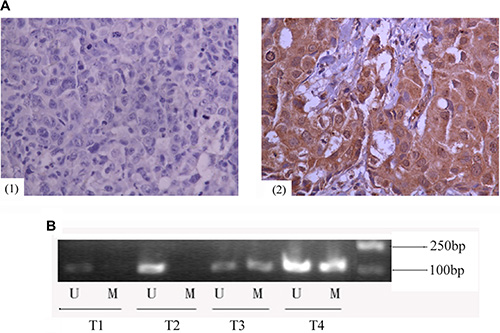
Figure 1: Expression of GCS protein and methylation status of GCS promoter in invasive ductal breast cancer. (A) Immunohistochemical analyses of GCS protein in invasive ductal breast cancer. Images are representative of two cases that were GCS-negative (1) or GCS-positive (2), respectively. (B) MSP detection of GCS promoter methylation in different invasive ductal breast cancer tissues. T1 and T2 were scored as unmethylation, T3 and T4 were scored as methylation. Abrreviations: T, breast cancer tissues; U, unmethylation; M, methylation.
Table 1: Correlations between GCS methylation status and clinicopathological features in invasive ductal breast cancer patients
|
|
GCS methylation (45/80, 56.2%) |
GCS non- methylation (35/80, 43.8%) |
p value |
Pearson correlation coefficient |
|---|---|---|---|---|---|
GCS protein |
GCS (+) |
10 |
30 |
< 0.001* |
−0.630* |
|
GCS (−) |
35 |
5 |
||
Age (years) |
< 35 |
4 |
1 |
0.379 |
−0.132 |
|
≥ 35 |
41 |
34 |
||
Tumor stage |
T < 5 cm |
40 |
30 |
0.928 |
−0.010 |
|
T ≥ 5 cm |
5 |
5 |
||
|
N0 |
20 |
14 |
0.690 |
−0.045 |
|
N1–x |
25 |
21 |
||
Histological stage |
I |
11 |
7 |
0.637 |
−0.053 |
|
II–III |
34 |
28 |
||
ER |
Positive |
35 |
19 |
0.026* |
−0.249* |
|
Negative |
10 |
16 |
||
PR |
Positive |
26 |
15 |
0.185 |
0.148 |
|
Negative |
19 |
20 |
||
HER-2 |
Positive |
21 |
6 |
0.006* |
0.310* |
|
Negative |
24 |
29 |
||
Ki67 |
< 14% |
14 |
10 |
0.806 |
−0.027 |
|
≥ 14% |
31 |
25 |
Note: *Statistical significance (p < 0.05).
Abbreviations: ER, estrogen receptor; PR, progesterone receptor; HER-2, human epidermal growth factor-2.
Correlation analysis was also performed between the promoter methylation status and clinicopathological parameters. Compared with the ER negative group of 61.5% (16/26) methylation levels of GCS CpG islands, the ER positive group exhibited lower methylation levels of 35.2% (19/54) (r = −0.249, p = 0.026). Compared with the HER-2 receptor positive group of 77.8% (21/27) methylation levels of GCS CpG islands, the HER-2 receptor negative group exhibited lower methylation levels of 45.3% (24/53) (r = 0.31, p = 0.006). Thus, GCS methylation status was negatively correlated with ER positivity, but positively with HER-2 positivity (Table 1). There was no statistical significance in the relationship between GCS methylation and other clinicopathological parameters, including age, histological stage, tumor size, nodal stage or Ki67 (Table 1).
GCS promoter methylation correlates negatively with GCS expression in breast cancer cells
To explore the possibility that DNA methylation inhibits GCS, the methylation status of GCS in four human breast cancer cell lines was detected by MSP. Complete methylation was observed in the MDA-MB-231 cell line, partial methylation in MCF-7 and T47D cell lines, but unmethylation in the MCF-7/ADM cell line PCR (Figure 2A).
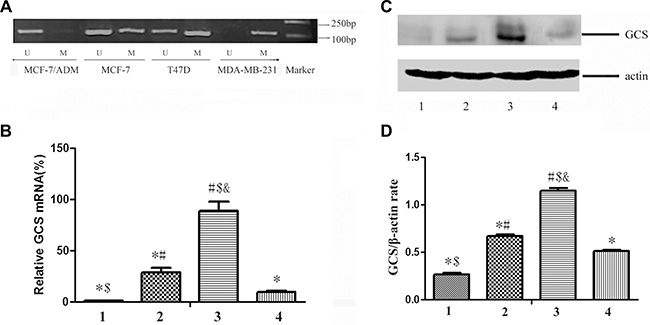
Figure 2: The status of GCS promoter methylation and the expression of GCS in breast cancer cell lines. (A) MSP detection of GCS promoter methylation. Complete methylation was discovered in MDA-MB-231cell line, partial methylation in MCF-7 and T47D cell lines, but unmethylation in MCF-7/ADM cell line. (B) qPCR detection of GCS mRNA expression. (C) Westernblot detection of GCS protein expression. (D) Relative expression of GCS protein. The expresssion of GCS in MDA-MB-231 is lowest in the four cell lines both in mRNA level and in protein level; and that in MCF-7/ADM is highest. Notes: 1 represents MDA-MB-231; 2 represents MCF-7; 3 represents MCF-7/ADM; 4 represents T47D *p < 0.05 vs. MCF-7/ADM; #p < 0.05 vs. MDA-MB-231; $p < 0.05 vs. MCF-7; &p < 0.05 vs. T47D.
To evaluate the relationship between different degrees of methylation of the GCS promoter and its expression, GCS mRNA expression was detected in breast cancer cells by quantitative real-time PCR (Figure 2B). The relative mRNA expression of GCS in the MDA-MB-231 cell line was significantly lower than that in the other three cell lines (p < 0.05).The relative mRNA expression of GCS in the MDR breast cancer cells MCF-7/ADM was significantly higher than that in the other three cell lines (p < 0.05). The protein expression of GCS was also detected simultaneously in the breast cancer cells by westernblot (Figure 2C, 2D); the results coincided with the mRNA expression.
Reversal of the methylation status in breast cancer cells by 5-Aza-dc
The high correlation between GCS promoter methylation and lack of gene expression prompted us to further explore the role of epigenetics in GCS gene expression. Previous reports demonstrated that treatment with the demethylating agent 5-Aza-dC, a DNA methyltransferases (DNMTs) inhibitor, could restore silenced gene expression. Thus, we explored the responsiveness of the four breast cancer cell lines to 5-Aza-dC. In MDA-MB-231 cells, methylated GCS gene bands disappeared and non-methylated GCS bands appeared (Figure 3A–3A1). In MCF-7 and T47D cells, methylated bands were still present, but became increasingly weaker (Figure 3A–3A2, 3A–3A3). However, no change was found in MCF-7/ADM cells (Figure 3A–3A4).
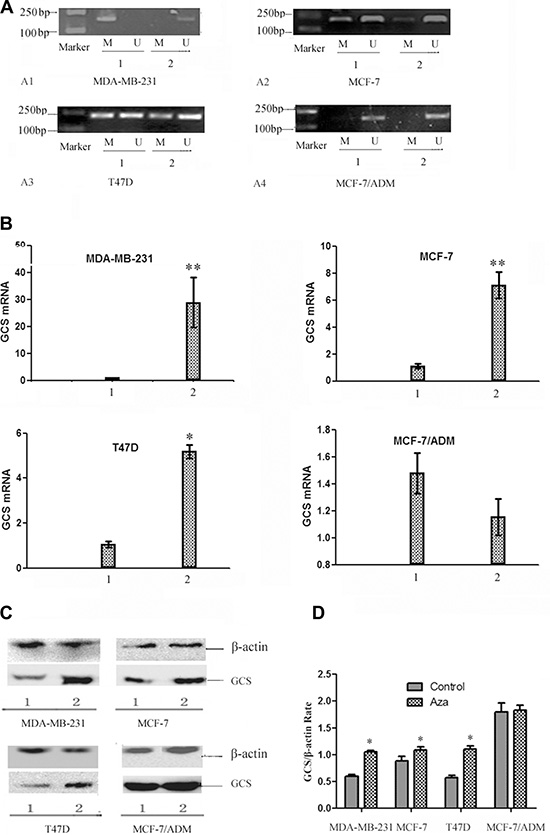
Figure 3: The changes of the status of GCS promoter methylation and the expression of GCS in breast cancer cell lines by 5-Aza-dc. (A) MSP analysis of GCS methylation status before and after 5-Aza-dc treatment. After treated with 5-Aza-dc, MDA-MB-231 changed from methylation into unmythylation, meanwhile there was no significant change in MCF-7/ADM. In MCF-7 and T47D cells, methylated bands were still present, but became increasingly weaker. MDA-MB-231 (A1); MCF-7 (A2); T47D (A3); MCF-7/ADM (A4). Notes: 1 represents before treatment; 2 represents after treatment. (B) qPCR analysis of GCS mRNA expression before and after 5-Aza-dc treatment. qPCR was used to detect the alteration of GCS mRNA expression.The expression of GCS mRNA increased significantly in three cell lines except MCF-7/ADM after treated with 5-Aza-dc. Notes: 1 represents before treatment; 2 represents after treatment. *p < 0.05 vs 1; **p < 0.01vs 1; (C) Westernblot analysis of GCS protein expression before and after 5-Aza-dc treatment. The expression of GCS protein increased significantly in three cell lines except MCF-7/ADM after treated with 5-Aza-dc, which in coordiance with that of the GCS mRNA expression. Notes: 1 represents before treatment; 2 represents after treatment. (D) Relative expression of GCS protein. Notes: *p < 0.05 vs control.
Treatment with 5-Aza-dC resulted in a significant enhancement in GCS mRNA (Figure 3B) and protein expression (Figure 3C, 3D), relative to untreated cells, in MDA-MB-231 and MCF-7, T47D cells (p < 0.05). However, in the corresponding MDR cell line MCF-7/ADM, which initially displayed substantial GCS overexpression, there was no significant change in GCS gene expression before or after 5-Aza-dc treatment (p > 0.05).
The changes of drug resistance in breast cancer cells by 5-Aza-dc
Doxorubicin is a common drug for many carcinomas. The results demonstrated that IC50 for doxorubicin significantly increased from 0.089 ± 0.002 μmol/L to 2.678 ± 0.267 μmol/L in MDA-MB-231 cells after treated with 5-Aza-dc (p < 0.01).In MCF-7 and T47D cells, the IC50 also increased (p < 0.05).However, there was no significant change in the cell line MCF-7/ADM (Figure 4A, 4B).
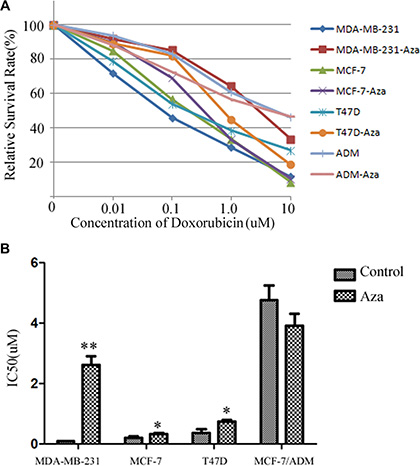
Figure 4: The changes of drug resistance in breast cancer cells by 5-Aza-dc. (A) The survival curve of the cell lines after added to different concentration of doxorubicin. All cell lines with or without 5-Aza-dc for 48 h, then the cells were seeded in 96-cells plate. Different concentration of doxorubicin were added for 24 h, then MTS was adopted to analysize the survival rate. Dose-response curves were plotted from three independent experiments. (B) The IC50 of each group. The relative drug resistance was determined by comparing the IC50 (drug concentration causing 50% inhibition of cell growth) from growth inhibition curves. Notes: **p < 0.01 vs. control; *p < 0.05 vs control.
Expression of DNMT1 and DNMT3a protein in breast cancer cells
In order to detect the mechanisms of methylation of GCS promoter, we analyzed the expression of DNMT1and DNMT3a protein in each cell line. The results displayed that all the cells expressed the DNMT1 and DNMT3a protein. The expression of DNMT1 was no significant difference. However the expression of DNMT3a protein is highest in MDA-MB-231and that is lowest in MCF-7/ADM (Figure 5A, 5B).
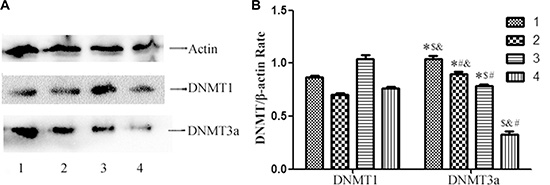
Figure 5: Westernblot analysis of DNMT1 and DNMT3a protein expression in the cell lines. (A) Westernblot analysis of DNMT1 and DNMT3a protein expression. All the cell lines express DNMT1protein and DNMT3a protein, however the expression of DNMT3a protein is highest in MDA-MB-231 and that is lowest in MCF-7/ADM. (B) Relative DNMT1 and DNMT3a protein expression in each cell line. Notes: 1 represents MDA-MB-231; 2 represents MCF-7 ; 3 represents T47D; 4 represents MCF-7/ADM *p < 0.05 vs. MCF-7/ADM; #p < 0.05 vs. MDA-MB-231; $p < 0.05 vs. MCF-7; &p < 0.05 vs. T47D.
DISCUSSION
The development of a malignant disease occurs via a multistage process, including genetic and epigenetic modifications. Epigenetics is a kind of inheritable gene expression mechanism that does not change the DNA sequence, and involves DNA methylation, histone acetylation and chromatin remodeling [20]. DNA methylation is important in various biological processes, such as genomic imprinting, inactivation of X chromosomes, cell differentiation and development [21]. Increasing research has focused on the relationship between DNA methylation and MDR. DNA methylation is far more vulnerable than the DNA sequence to external factors. DNA methylation changes can occur rapidly, resulting in resistance arising quickly following chemotherapy treatment [22, 23]. Demethylation of CpG islands in the MDR1 promoter region is a mechanism of chemoresistance, which induces the expression of P-gp and the MDR phenotype [24].
Intensive investigations have been performed regarding correlations between protein expression of GCS and MDR [9, 10, 11]. However, the mechanism of protein expression by promoter methylation of GCS is not completely understood. To date, most studies have focused on the association with GCS and its downstream effectors. And many results have been obtained. Gouaze et al. [25] suggested that GCS blockade resensitizes MDR breast cancer cells to anticancer drugs via downregulation of MDR1. Liu et al. [26] further demonstrated that GCS upregulates MDR1 expressions through cSrc and beta-catein signaling. Zhang et al. showed that GCS can increase the expression of MDR1 through NF-κ B signaling in K562/AO2 cells [27]. No relevant research on upstream effectors that regulate GCS expression has been reported. The GCS promoter also contains a potential CpG island; thus, epigenetic changes might regulate its expression. The purpose of the present study was to determine whether epigenetic changes influenceGCS expression in breast cancer. To reach this aim, we used MSP to map the methylation status of CpG sites in the GCS promoter and then analyzed its association with GCS expression. The results showed that in breast cancer tissues, DNA methylation could inhibit GCS expression. Methylation of the GCS promoter was inversely associated with GCS expression. The conclusions were similar to a previous investigation: Lincke et al. demonstrated a rough correlation between hypomethylation and transcription of the 5′end of the MDR1 and MDR3 genes [28]. Hirofumi et al. suggested that methylation status of BCRP was inversely correlated with its expression in lung cancer cells [29], multiple myeloma [30] and pancreatic cancer [31].
We also analyzed the correlation between methylation status of the GCS promoter and clinicopathological parameters. The results indicated that methylation of the GCS promoter was negatively associated with ER positivity, but positively associated with HER-2 positivity. The results were consistent with our previous study, in which the expression of GCS in invasive ductal breast cancer correlated with high ER and low HER-2 status [32]. Although the study of Liu demonstrated that GCS overexpression is highly associated with ER-positive and HER-2-positive breast cancers that have metastasized, this was a small study [33]. And the correlations between GCS promoter methylation and ER or HER-2 status need to be further investigated in future studies. GCS methylation was not correlated with tumor size, lymph metastasis or histological stage in this study, suggesting that GCS methylation would not be a good prognostic indicator for breast cancer.
The presence of a methylated sequence in the 5′regulatory regions of certain genes appears to determine the level of transcription [34], and DNA methylation often induces gene inactivation in in vitro transcription assays [35]. In a recent publication, hypermethylation of CpG dinucleotides in the MDR1 promoter region also contributed strongly to differences in gene expression in related cell lines [15]. To investigate whether certain distinct DNA methylation patterns were associated with the GCS phenotype of breast cancer cells, we analyzed the methylation status and the expression of GCS by MSP, qPCR and westernblot. We observed that DNA methylation existed in breast cancer cells, and that methylation of GCS repressed the gene expression. We examined the methylation status of the GCS promoter region in four breast cancer cell lines that differed in their respective GCS expressions. We found that the promoter of very low level expressing cells was almost completely methylated, whereas high and medium GCS expressions were either completely or almost completely unmethylated. The results clearly indicated an inverse correlation between methylation status and GCS gene expression in breast cancer cells.
CpG island hypermethylation and consequent gene silencing in cancer was found to be induced by the deregulation of DNMTs [36]. The DNMT inhibitor, 5-Aza-dc, could reactivate silenced genes and has become a relevant molecular therapy, currently used to treat hematological malignancies [37, 38]. To further explore the relationships among DNA methylation, GCS expression and MDR, 5-Aza-dc was used to treat breast cancer cells. 5-Aza-dc could reverse GCS promoter methylation and induced re-expression at the messenger RNA and protein levels in MDA-MB-231, MCF-7 and T47D cell lines.
The correlation between GCS CpG islands methylation and chemotherapy drug sensitivity was assessed by MTS. The IC50 value of MDA-MB-231, MCF-7 and T47D increased significantly after treated with 5-Aza-dc. This suggested that demethylation of GCS resulted in an apparent increase in the generation of multidrug-resistant clones. No change was found in MCF-7/ADM cell lines, which suggested that restoration of GCS gene expression was caused by transcriptional upregulation rather than by changed GCS mRNA stability. In order to explore the mechanisms of GCS methylation, we detected the expression of DNMT1 and DNMT3a of the four cell lines by western blot, we can see that the DNMT1 protein of the four cell lines didn’t have significant differences, but the expression of DNMT3a protein is highest in MDA-MB-231and that is lowest in MCF-7/ADM. From the result, we can deduce that GCS methylation is related to the expression of DNMT3a.
These findings suggested that promoter methylation is responsible for transcriptional silencing of GCS in patient plasma cells and in cell lines. Demethylation of the promoter was necessary for GCS re-expression and for GCS-induced MDR. CpG island methylation can cause repression of gene expression either directly through transcription factors [39] or indirectly through recruitment methyl-binding proteins [40, 41]. Whether recruitment of methyl-binding proteins is involved in the case of the GCS gene remains to be determined. The mechanism by which DNA methylation controls gene expression in this model requires further evaluation and a more detailed understanding of the molecular basis of the MDR phenotype may provide further opportunities for subsequent clinical intervention.
MATERIALS AND METHODS
Clinical samples
Tissue samples from 150 patients with primary invasive ductal breast carcinoma who underwent complete dissection of the breast and axillary lymph nodes were collected at the Yuhuangding Hospital affiliated to Qingdao University, China, between Jan 2011 and Jun 2012. No patients had preoperative chemotherapy and informed consent for pathological evaluation was obtained from all patients prior to surgery. Then immunohistochemical analyses were adopted to detect the expression of GCS protein and the methods will be described in Immunohistochemical analyses. Then 40 cases GCS-positive and 40 cases GCS-negative cases were selected for our following research.
Patient and tumor characteristics of the 40 GCS-positive and 40 GCS-negative cases are summarized in Table 2. The use of these tissues was approved by the Research Ethics Committee of Yuhuangding Hospital, and we obtained informed written consent for pathological evaluation from all participants involved in our study.
Table 2: Clinicopathological features of patients with invasive ductal breast cancer
A. Clinicopathological features of GCSpositive invasive ductal breast cancer patients |
||
|---|---|---|
Characteristics |
Number |
% |
Age (years) |
|
|
< 35 |
1 |
(2.50) |
≥ 35 |
39 |
(97.5) |
Tumor size |
|
|
T < 5 cm |
36 |
(90.0) |
T ≥ 5 cm |
4 |
(10.0) |
Nodal stage |
|
|
N0 |
14 |
(35.0) |
N1–x |
26 |
(65.0) |
Histological stage |
|
|
I |
7 |
(17.5) |
II |
18 |
(45.0) |
III |
15 |
(37.5) |
B. Clinicopathological features of GCSnegative invasive ductal breast cancer patients |
||
|---|---|---|
Characteristics |
Number |
% |
Age (years) |
|
|
< 35 |
4 |
(10.0) |
≥ 35 |
36 |
(90.0) |
Tumor size |
|
|
T < 5 cm |
34 |
(85.0) |
T ≥ 5 cm |
6 |
(15.0) |
Nodal stage |
|
|
N0 |
20 |
(50.0) |
N1–x |
20 |
(50.0) |
Histological stage |
|
|
I |
11 |
(27.5) |
II |
20 |
(50.0) |
III |
9 |
(22.5) |
Ethics statement
The work was conducted in accordance with the Declaration of Helsinki. Informed consent was obtained from all the patients in this study. All patients signed the informed consent for use of specimens, and the study was approved by the Institutional Review Board (Medical Ethics Committee of Yuhuangding Hospital).
Cell culture
Three drug-sensitive breast cancer cell lines, MCF-7 (ER-positive, PR-positive, HER-2-negative), MDA-MB-231 (triple-negative) and T47D (ER-positive, PR-positive, HER-2-negative), were obtained from the American National Cancer Institute. The multidrug-resistant breast cancer cell line, MCF-7/ADM, was selected from MCF-7 with doxorubicin treatment in stages [6]. MCF-7, MDA-MB-231 and MCF-7/ADM were maintained in RPMI 1640 (Gibco, USA) medium supplemented with 10% (v/v) fetal bovine serum (FBS), 100 U/ml penicillin and 100 μg/ml streptomycin and T47D were maintained in L-15(Gibco, USA). All cells were cultured in a humidified atmosphere containing 5% CO2 at 37°C.
Immunohistochemical analyses
Immunohistochemical staining was carried out using the DAKO Envision detection kit (Dako, Carpinteria, CA, USA). In brief, paraffin-embedded tissue blocks were sectioned (4 μm-thick), dried, deparaffinized and rehydrated. Antigen retrieval was performed in a microwave oven for 15 min in 10 mM citrate buffer (pH 6.0). Then cells were embedded in 4% neutral formaldehyde for 2 h. For all samples, endogenous peroxidase activity was blocked with a 3% H2O2-methanol solution. The slides were blocked with 10% normal goat serum for 10 min and incubated with an appropriately diluted primary antibody overnight at 4°C. The slides were then probed with an HRP-labeled polymer conjugated to an appropriate secondary antibody for 30 min. The antibodies against estrogen receptor (ER, Product No E07165), progesterone receptor (PR, Product No E06575), HER-2 (No E07758) and Ki67 (Product No E07806) were purchased from Roche, Switherland and are all work fluid and the GCS antibody was purchased from Bioss, Beijing, China (diluted 1:300, Product No bs-0701P ).
Staining results were interpreted by two breast pathologists who were blinded to patient outcomes. Tumors with 1% or more positively stained nuclei were considered positive for ER and PR expression. Ki67 staining was determined to be positive when more than 14% of the nuclei were stained [32, 42]. HER-2 was scored by counting the number of positively stained cells on the membrane and expressed as a percentage of total tumor cells according to the American Society of Clinical Oncology (ASCO) and the College of American Pathologists (CAP) guidelines using the following categories: 0, no immunostaining; 1+, weak, incomplete membranous staining in any proportion of tumor cells; 2+, complete membranous staining, either non-uniform or weak in at least 10% of tumor cells; and 3+, uniform, intense membranous staining in > 10% of tumor cells. HER-2 results were considered positive in cases with 3 + membranous staining of IHC or gene amplification by fluorescence in-situ hybridization (FISH) irrespective of IHC results using the diagnostic criteria described [43].
A dual semi-quantitative scale combining staining intensity and percentage of positive cells was used to evaluate GCS protein staining. The staining intensity of the cell plasma was scored as 0 (negative), 1 (weak), 2 (moderate) or 3 (strong). The percentage of positive cells was scored as follows: 0, no staining or staining in < 5% of tumor cells; 1, staining in 5% to 25% of cells; 2, staining in 26% to 50% of cells; 3, staining in 51% to 75% of cells; 4, staining in > 75% of cells. For GCS, cytoplasmic staining was considered positive with an immunohistochemical score ≥ 2, or negative with an immunohistochemical score < 2 [32].
DNA extraction and MSP
Genomic DNA from 40 paired GCS-positive and GCS-negative cases of primary invasive ductal breast carcinoma patients and four breast cancer cell lines, was isolated by proteinase K method. The genomic DNA was modified with the CpGenomeTM Direct Prep Bisulfite Modification kit (Millipore, USA), according to the manufacturer’s instructions. MSP primers were designed online (http://www.urogene.org/methprimer/index1.html). Primers were synthesized (Sangon, Shanghai, China) to detect bisulfate-induced changes affecting methylated (M) and unmethylated (U) alleles. The MSP primer sequences were as follows: 5′-TTTTGGTTAATAAGGT GAATTTCG-3′ (MF), 5′-AACCGAACTACGAACTACAATAAC G -3′ (MR) and 5′-GGTT AATAAGGTGAAATTTTGTGCT -3′ (UF), 5′-CCAAACTACAAACTACAAT AACACA-3′ (UR). The size of the non-methylated PCR product was 185 bp and the methylated PCR product was 187 bp. Each MSP reaction included approximately 100 ng of bisulfite-treated DNA, 25 pmoles of each primer, 100 pmoles dNTPs, 2.5 μl 10 × PCR buffer and 1 unit of Taq Polymerase (Invitrogen, Carlsbad, CA, USA) in a final reaction volume of 25 μl. The PCR reaction was as follows: initial denaturation for 5 min at 94°C; followed by 35 cycles of denaturation for 30s at 94°C, primer annealing for 30s at 60°C, and polymerization for 30s at 72°C; and final extension for 10 min at 72°C. MSP products were analyzed by 2% agarose gel electrophoresis stained with ethidium bromide. In invasive ductal breast cancer, the MSP products in the M lanes were scored as methylation, and those in the U lanes were scored as unmethylation [44, 45]. In breast cancer cells, cells were scored as unmethylation when bands were present only in the unmethylated DNA lane and as complete methylation when bands were present in the methylated DNA lane. Bands present both methylated and unmethylated lanes were scored as partial methylation [46].
RNA extraction and quantitative real-time PCR (qPCR)
Total RNA was isolated using the Trizol-Reagent (Invitrogen) as recommended by the manufacturer, and quantitative real-time PCR was used to detect GCS mRNA. qPCR was performed using a SYBR Green Real-time PCR MasterMix (TOYOBO, Japan). The primers for GCS were as follows : sense: 5-CCTT TCCTCTCCCCACCTTCCTCT-3′, antisense: 5′-GGTT TCAGAAGAGAGACACCTGGG-3′ [47]. The expression of the β-actin (sense: 5′-ACCCCCACTGAAAAAG ATGA-3′, antisense: 5′-ATCTTCAAACCTCCATGA TG-3′) gene was used as an internal control set. The final volume was 25 μl, and an iCycler iQ Real-Time PCR Detection System (Bio-Rad) was used for qPCR. The qPCR reaction was as follows: initial denaturation for 5 min at 94°C; followed by 35 cycles of denaturation for 30s at 94°C, primer annealing for 30s at 60°C, and polymerization for 30s at 72°C; and final extension for 10 min at 72°C. The relative mRNA expressions were calculated using the 2−ΔΔCq method, where ΔΔCq = target Cq - control Cq;ΔΔCq = ΔCq target - ΔCq calibrator (Cq, cycle threshold).
Western blot
Cells were washed with phosphate buffered saline and lysed in 100 μl of lysis buffer (10 mM Tris-HCl, pH 7.4, 5 mM MgCl2, 1 mM EDTA, 25 mM NaF, fresh 100 μM Na3VO4 and l mM dithiothreitol). Cell lysates were centrifuged for 10 min at 14,000 × g. Using a previously described method [48], equal amounts of protein (100 μg) were resolved on a 10% SDS-polyacrylamide gel and transferred electrophoretically to a polyvinylidene fluoride membrane. The membranes were blocked with fat-free milk (5%) in Tris-Buffered Saline and Tween 20 (10 mM Tris-HCl, pH 7.4, 150 mM NaCl, 0.1% Tween-20) at room temperature for 2 h. The membrane was immunoblotted with rabbit polyclonal against human GCS antibody (Santa Cruz, USA, diluted 1;1,000) in 5% fat-free milk in Tris-Buffered Saline and Tween 20. As a control for equivalent protein loading, the filters were simultaneously incubated with mouse monoclonal antibody against human β-actin (diluted 1:1,000). Detection was performed using enhanced chemiluminescence (Millipore, USA). All analyses were performed in triplicate in three separate experiments.
5-aza-2′-deoxycytidine (5-Aza-dc) treatment
Breast cancer cell lines (MCF-7, MDA-MB-231, T47D and MCF-7/ADM) were split into low density (30% confluence) 12 h before treatment. Cells were treated with 5-Aza-dc (Sigma, St. Louis, MO, USA) at a concentration of 5 μM for 72 h. At the end of treatment, RNA was extracted from the cells as described above.
Cytotoxicity assay for cell survival (MTS)
The MTS assay was used to assess the effect of methylation of GCS promoter on the chemosensitivity of breast cancer cells to anticancer drug [49]. In brief, cells were plated in a 96-well plate at a density of 5 × 10³ cells per well for 24 h, and then incubated with different concentrations of doxorubicin (Dalian Meilunbio Co., Ltd., China) for 24 h. Then 20 μl of MTS was added to each well and incubated at 37°C for 3 h. Optical densities (ODs) were detected using a spectrometric absorbance of 570 nm against a background of 630 nm on a Bio-Rad microplate reader (Hercules, CA, USA). The value of (A570 anticancer drug +/A570 anticancer drug−) × 100% indicated cell viability. Dose-response curves were plotted from three independent experiments. The relative drug resistance was determined by comparing the IC50 (drug concentration causing 50% inhibition of cell growth) from growth inhibition curves.
Statistical analysis
All calculations were performed using the SPSS16.0 for windows statistical software package (SPSS, Chicago, IL, USA). Chi-squared or Fisher’s exact tests, and Pearson correlation coefficient, were used to analyze the relationship between the expression of GCS and each histopathological variable. Cellular data were presented as the mean ± standard deviation. One-way ANOVA and Dunnett’s T3 tests were used to determine statistical significance. P-values less than 0.05 were considered statistically significant.
ACKNOWLEDGMENTS
We would like to express our sincere gratitude to the patients and their families for agreeing to participate in this work.
CONFLICTS OF INTEREST
The authors declare that they have no conflicting interests.
GRANT SUPPORT
This work has been supported by Natural Science Foundation of Shandong Province (No ZR2012HQ019) and Science and Technology Development Foundation of Yantai (No 2014 WS017).
REFERENCES
1. Agarwal G, Pradeep P, Aggarwal V, Yip C-H, Cheung PS. Spectrum of breast cancer in Asian women. World J Surg. 2007; 31:1031–1040.
2. Frank GA, Danilova NV, Andreeva lulu, Nefedova NA. WHO classification of tumors of the breast, 2012. Arkh patol. 2013; 75:53–63.
3. Szakács G, Paterson JK, Ludwig JA, Booth-Genthe C, Gottesman MM. Targeting multidrug resistance in cancer. Nat Rev Drug Discov. 2006; 5:219–234.
4. Ozben T. Mechanisms and strategies to overcome multiple drug resistance in cancer. FEBS Lett. 2006; 580:2903–2909.
5. Gouazé-Andersson V, Yu JY, Kreitenberg AJ, Bielawska A, Giuliano AE, Cabot MC. Ceramide and glucosylceramide upregulate expression of the multidrug resistance gene MDR1 in cancer cells. Biochim Biophys Acta. 2007; 1771:1407–1417.
6. Zhang X, Wu X, Su P, Gao Y, Meng B, Sun Y, Li L, Zhou Z, Zhou G. Doxorubicin influences the expression of glucosylceramide synthase in invasive ductal breast cancer. PloS one. 2012; 7:e48492.
7. Reynolds CP, Maurer BJ, Kolesnick RN. Ceramide synthesis and metabolism as a target for cancer therapy. Cancer Lett. 2004; 206:169–180.
8. Yamashita T, Wada R, Sasaki T, Deng C, Bierfreund U, Sandhoff K, Proia RL. A vital role for glycosphingolipid synthesis during development and differentiation. Proc Natl Acad Sci U S A. 1999; 96:9142–9147.
9. Liu YY, Han TY, Giuliano AE, Cabot MC. Expression of glucosylceramide synthase, converting ceramide to glucosylceramide, confers adriamycin resistance in human breast cancer cells. J Bio Chem. 1999; 274:1140–1146.
10. Sun Y, Zhang T, Gao P, Meng B, Gao Y, Wang X, Zhang J, Wang H, Wu X, Zheng W, Zhou G. Targeting glucosylceramide synthase downregulates expression of the multidrug resistance gene MDR1 and sensitizes breast carcinoma cells to anticancer drugs. Breast Cancer Res Treat. 2010; 121:591–599.
11. Liu YY, Han TY, Giuliano AE, Hansen N, Cabot MC. Uncoupling ceramide glycosylation by transfection of glucosylceramide synthase antisense reverses adriamycin resistance. J Biol Chem. 2000; 275:7137–7143.
12. Bird A. DNA methylation patterns and epigenetic memory. Genes Dev. 2002; 16:6–21.
13. Bernstein BE, Meissner A, Lander ES. The mammalian epigenome. Cell. 2007;128:669–681.
14. Boyes J, Bird A. DNA methylation inhibits transcription indirectly via a methyl-CpG binding protein. Cell. 1991; 64:1123–1134.
15. David GL, Yegnasubramanian S, Kumar A, Marchi VL, De Marzo AM, Lin X, Nelson WG. MDR1 promoter hypermethylation in MCF-7 human breast cancer cells. Cancer Biol Ther. 2004; 3:540–548.
16. Fryxell KB, McGee SB, Simoneaux DK, Willman CL, Cornwell MM. Methylation analysis of the human multidrug resistance 1 gene in normal and leukemic hematopoietic cells. Leukemia. 1999; 13:910–917.
17. Kusaba H, Nakayama M, Harada T, Nomoto M, Kohno K, Kuwano M, Wada M. Association of 5′ CpG demethylation and altered chromatin structure in the promoter region with transcriptional activation of the multidrug resistance 1 gene in human cancer cells. Eur J Biochem. 1999; 262:924–932.
18. Bailey-Dell KJ, Hassel B, Doyle LA, Ross DD. Promoter characterization and genomic organization of the human breast cancer resistance protein (ATP-binding cassette transporter G2) gene. Biochim Biophys Acta. 2001; 1520:234–241.
19. Ichikawa S, Sakiyama H, Suzuki G, Hidari K, Hirabayashi Y. Expression cloning of a cDNA for human ceramide glucosyltransferase that catalyzes the first glycosylation step of glycosphingolipid synthesis. Proc Natl Acad Sci U S A. 1996; 93:4638–4643.
20. Wolffe AP, Matzke MA. Epigenetics: regulation through repression. Science.1999; 286:481–486.
21. Ng HH, Bird A. DNA methylation and chromatin modification. Curr Opin Genet Dev. 1999; 9:158–163.
22. Nyce J. Drug-induced DNA hypermethylation and drug resistance in human tumors. Cancer Res. 1989; 49:5829–5836.
23. Baker EK, El-Osta A.The rise of DNA methylation and the importance of chromatin on multidrug resistance in cancer. Exp Cell Res. 2003; 290:177–194.
24. Baker EK, Johnstone RW, Zalcberg JR, El-Osta A. Epigenetic changes to the MDR1 locus in response to chemotherapeutic drugs. Oncogene. 2005; 24:8061–8075.
25. Gouazé V, Liu Y-Y, Prickett CS, Jing YY, Giuliano AE, Cabot MC. Glucosylceramide synthase blockade down-regulates P-glycoprotein and resensitizes multidrug-resistant breast cancer cells to anticancer drugs. Cancer Res. 2005; 65:3861–3867.
26. Liu YY, Gupta V, Patwardhan GA, Bhinge K, Zhao Y, Bao J, Mehendale H, Cabot MC, Li YT, Jazwinski SM. Glucosylceramide synthase upregulates MDR1 expression in the regulation of cancer drug resistance through cSrc and beta-catenin signaling. Mol Cancer. 2010; 9:145.
27. Zhang X, Xie K, Zou J, Li Y, Mu H, Zhang B. NF-κ B mediates the effect of glucosylceramide synthase on P-glycoprotein modulation in a drug-resistance leukemia cell line. Zhonghua yi xue yi chuan xue za zhi. 2014; 31:34–38.
28. Lincke CR, Smit JJ, Van der Velde-Koerts T, Borst P. Structure of the human MDR3 gene and physical mapping of the human MDR locus. J Biol Chem. 1991; 266:5303–5310.
29. Nakano H, Nakamura Y, Soda H, Kamikatahira M, Uchida K, Takasu M, Kitazaki T, Yamaguchi H, Nakatomi K, Yanagihara K, Kohno S, Tsukamoto K. Methylation status of breast cancer resistance protein detected by methylation - specific polymerase chain reaction analysis is correlated inversely with its expression in drug-resistant lung cancer cells. Cancer. 2008; 112:1122–1130.
30. Turner JG, Gump JL, Zhang C, Cook JM, Marchion D, Hazlehurst L, Munster P, Schell MJ, Dalton WS, Sullivan DM. ABCG2 expression, function, and promoter methylation in human multiple myeloma. Blood. 2006; 108:3881–3889.
31. Chen M, Xue X, Wang F, An Y, Tang D, Xu Y, Wang H, Yuan Z, Gao W, Wei J, ZhangJ, Miao Y. Expression and promoter methylation analysis of ATP-binding cassette genes in pancreatic cancer. Oncol Rep. 2012; 27:265–269.
32. Liu J, Sun P, Sun Y, Liu A, You D, Jiang F, Sun Y. Expression of glucosylceramide synthase in invasive ductal breast cancer may be correlated with high estrogen receptor status and low HER-2 status. Diagn Pathol. 2014; 9:22.
33. Liu YY1, Patwardhan GA, Xie P, Gu X, Giuliano AE, Cabot MC.Glucosylceramide synthase, a factor in modulating drug resistance, is overexpressed in metastatic breast carcinoma. Int J Oncol. 2011 ;39:425–31.
34. Thompson JP, Simkevich C, Holness MA, Kang A, Raghow R. In vitro methylation of the promoter and enhancer of Pro alpha 1 (I) collagen gene leads to its transcriptional inactivation. J Biol Chem. 1991; 266:2549–2556.
35. Komura J-i, Okada T, Ono T. Repression of transient expression by DNA methylation in transcribed regions of reporter genes introduced into cultured human cells. Biochim Biophys Acta. 1995; 1260:73–78.
36. Ellis L, Atadja PW, Johnstone RW. Epigenetics in cancer: targeting chromatin modifications. Mol Cancer Ther. 2009; 8:1409–1420.
37. Claus R, Almstedt M, Lübbert M. Epigenetic treatment of hematopoietic malignancies: in vivo targets of demethylating agents. Semin Oncol. 2005; 32:511–520.
38. Issa JP. DNA methylation as a therapeutic target in cancer. Clinl Cancer Res. 2007; 13:1634–1637.
39. Campanero MR, Armstrong MI, Flemington EK. CpG methylation as a mechanism for the regulation of E2F activity. Proc Natl Acad Sci U S A. 2000; 97:6481–6486.
40. Roloff TC, Ropers HH, Nuber UA. Comparative study of methyl-CpG-binding domain proteins. BMC Genomics. 2003; 4:1.
41. Kudo S. Methyl-CpG-binding protein MeCP2 represses Sp1-activated transcription of the human leukosialin gene when the promoter is methylated. Mol Cel Biol. 1998; 18:5492–5499.
42. Ruckhäberle E, Karn T, Hanker L, Gätje R, Metzler D, Holtrich U, Kaufmann M, Rody A. Prognostic relevance of glucosylceramide synthase (GCS) expression in breast cancer. J Cancer Res Clin Onco. 2009; 135:81–90.
43. Wolff AC, Hammond ME, Hicks DG, Dowsett M, McShane LM, Allison KH, Allred DC, Bartlett JM, Bilous M, Fitzgibbons P, Hanna W, Jenkins RB, Mangu PB, et al. Recommendations for human epidermal growth factor receptor 2 testing in breast cancer: American Society of Clinical Oncology/College of American Pathologists clinical practice guideline update. J Clin Oncol. 2013; 31:3997–4013.
44. Lin YL, Wang YL, Ma JG, Li WP. Clinical significance of protocadherin 8 (PCDH8) promoter methylation in non-muscle invasive bladder cancer. J Exp Clin Cancer Res. 2014; 33:68.
45. Lin YL, Ma JH, Luo XL, Guan TY, Li ZG. Clinical significance of protocadherin-8 (PCDH8) promoter methylation in bladder cancer. J Int Med Res. 2013; 41:48–54.
46. Zhang C, Li H, Wang Y, Liu W, Zhang Q, Zhang T, Zhang X, Han B, Zhou G. Epigenetic inactivation of the tumor suppressor gene RIZ1 in hepatocellular carcinoma involves both DNA methylation and histone modifications. J Hepatol. 2010; 53:889–895.
47. Zhang X, Li J, Qiu Z, Gao P, Wu X, Zhou G. Co-suppression of MDR1 (multidrug resistance 1) and GCS (glucosylceramide synthase) restores sensitivity to multidrug resistance breast cancer cells by RNA interference (RNAi). Cancer Biol Ther. 2009; 8:1117–1121.
48. Kaszubiak A, Holm PS, Lage H. Overcoming the classical multidrug resistance phenotype by adenoviral delivery of anti-MDR1 short hairpin RNAs and ribozymes. Int J Oncol. 2007; 31:419–430.
49. Jing X, Zhang H, Hu J, Su P, Zhang W, Jia M, Cheng H, Li W, Zhou G. β-arrestin 2 is associated with multidrug resistance in breast cancer cells through regulating MDR1 gene expression. Int J Clin Exp Pathol. 2015; 8:1354–1363.