
INTRODUCTION
Cancer and many other major diseases are often caused by varieties of subtle modifications in biological sequences, typically by various types of post-translational modification (PTM or PTLM) in protein [1, 2], post-replication modification (PTRM) in DNA [3] and post-transcription modification (PTCM) in RNA [4]. In order to reveal the pathological mechanisms of these diseases and find new and revolutionary strategies to treat them, considerable efforts have been made in order for identifying the possible modified sites in proteins (see, e.g., [5–13]), DNA [14, 15], and RNA sequences [16, 17]. For a systematic introduction about this, see two recent review articles [13, 15].
In vivo, PTM is one of the most efficient biological mechanisms for regulating physiology as well as for expanding the genetic code. But when body’s well-designed proteolysis or other repair systems are overwhelmed by excess reactive oxygen species (ROS) [18], the oxidative stress may occur [18], weakening the damage-repairing ability. This may also bring about varieties of PTMs on proteins, including nitration, carbonylation, sulfhydration and glutathionylation [19]. Among these PTMs, the protein carbonylation has been used as a biomarker for severe oxidative protein damage due to its relative early formation, stability, and irreversibility [20, 21]. Actually, protein carbonylation is an early stage of diseases induced by external oxidative stress, aging and obesity [22, 23]. It may cause numerous major human diseases, including Alzheimer’s disease, diabetes, Parkinson’s disease, chronic renal failure, chronic lung disease, sepsis and so forth [24, 25]. Therefore, the information of carbonylation sites in proteins is indispensable not only for in-depth understanding many important biological processes but also for precisely aiming targets in developing effective drugs against the aforementioned diseases.
Mass spectrometry is one of the most common techniques to analyze the carbonyl level of a protein and determine its carbonylation sites [26, 27]. So far four types of amino acid residues have been found more prone to carbonylation; they are lysine (K), proline (P), arginine (R), and threonine (T) [24, 28–30]. But it would take much longer time and need more labors to utilize the conventional experimental techniques alone to determine the carbonylation sites in proteins [27, 31]. Facing the rapid growth of biological sequences, we are challenged to develop automated methods as a complimentary approach to experimental methods.
Actually, some investigators have made efforts to do so. Maisonneuve et al. [29], based on their spectrometry analysis, proposed some empirical rules to identify the hot spots of carbonylation. Recently, Lv et al. [32] and Xu et al. [33] developed two different bioinformatical tools to predict the protein carbonylation sites. These methods did have contribution in stimulating the development of this area. Since the topic’s importance as well as the urgency of demanding more powerful high throughput tools in this area, further efforts aiming at prediction of protein carbonylation sites are definitely needed.
Here, we are to develop a new and more powerful predictor by (1) using the Monte Carlo sampling approach to optimize the training dataset, (2) incorporating the vectorized sequence-coupling model into the general PseAAC, and (3) installing the random forest (RF) algorithm to operate the prediction system.
As shown in many recent relevant papers [11, 12, 14, 17, 34–40], to establish a biological sequence-based statistical predictor that not only can be easily used by most experimental scientists to get their desired results but also can inspirely stimulate theoretical scientists to create various other prediction methods, we should observe the Chou’s 5-step rules or guidelines [41]: (1) benchmark dataset preparation; (2) mathematical representation of biological sequence samples; (3) calculation algorithm; (4) cross-validation; (5) web-server establishment. Below, let us to address the five guidelines one-by-one. To match the rubric style of the Oncotarget journal, however, the order in addressing them may be changed.
RESULTS AND DISCUSSION
A novel web-server predictor and its user guide
A new and more powerful predictor, called iCar-PseCp, has been established for predicting the protein carbonylation sites. Moreover, to maximize users’ convenience, the point-to-point instructions are given below.
(1) Click the web-server at http://www.jci-bioinfo.cn/iCar-PseCp, the top page of the iCar-PseCp will be prompted on your computer screen (Figure 1).
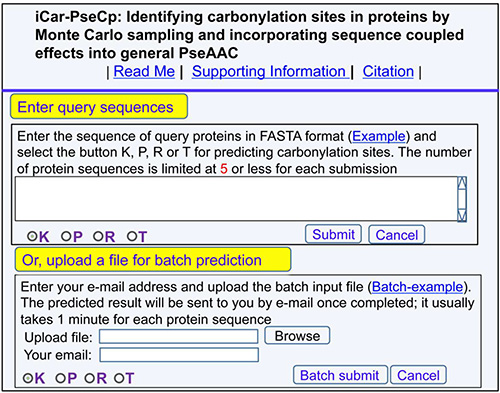
Figure 1: A semi-screenshot of the top-page for the web-server iCar-PseCp at http://www.jci-bioinfo.cn/iCar-PseCp.
(2) In the input box (Figure 1), enter your query protein sequences, which can be done by either typing or copying/pasting manner. The entered query protein sequences should be in the FASTA format. Not familiar with FASTA? Just click the button of Example.
(3) You can see the prediction results by clicking the Submit button. If you use the Sequence_K in the Example window as the input and check on the K button, after 15 seconds or so since your submitting, you will see the following on your screen: Sequence_K contains 9 K residues, of which 5 are predicted to be of carbonylation site and they are at the sequence positions 2, 14, 41, 68 and 95. If you use the Sequence_P as the input and check on the P button, you will see: Sequence_P contains 10 P residues, of which 5 are of carbonylation site and at positions 95, 122, 142, 145, and 149. If you use the Sequence_R as the input and check on the R button, you will see: Sequence_R contains 8 R residues, of which 3 are of carbonylation site and at the positions 14, 41, and 75. If you use the Sequence T as the input and check on the T button, you will see: Sequence_T contains 7 T residues, of which 1 is of carbonylation site and at the positions 14. Compared with experimental observations, the above (9 + 10 + 8 + 7) = 34 predicted results contain no false positive result  but 5 false positive results
  , which are the 2nd and 13th K residues in sequence_K, the 142th and 145th P residues in sequence_P, and the 75th R residue in sequence_R. In other words, the total number of carbonylation sites involved in the above predictions is N+ = 3 + 3 + 1 + 1 = 8, while the total number of non-carbonylation sites investigated is N− = 6 + 7 + 6 + 6 = 25. Substituting these data into Eq.9, we have Sn = 100%, Sp = 80.00% and Acc = 84.80%, and MCC = 0.7018, quite consistent with the rates reported in Table 1 via the rigorous cross validation on the 250 benchmark proteins.
Table 1: A comparison of the proposed predictor with the existing methods based on the 10-fold cross-validation on the same 250 carbonylated proteins
Predictor |
Metrics and graph |
Type of carbonylation |
|||
|---|---|---|---|---|---|
K |
P |
R |
T |
||
PTMPreda |
Acc (%)d |
88.59 |
82.93 |
86.64 |
88.39 |
CarSpredb |
87.22 |
82.93 |
86.22 |
86.61 |
|
iCar-PseCpc |
84.43 |
86.79 |
84.23 |
86.17 |
|
PTMPreda |
MCCd |
0.1892 |
0.2573 |
0.1878 |
0.2186 |
CarSpredb |
0.2268 |
0.2331 |
0.2245 |
0.2040 |
|
iCar-PseCpc |
0.5906 |
0.6006 |
0.6076 |
0.6185 |
|
PTMPreda |
Sn (%)d |
23.45 |
21.43 |
20.02 |
22.38 |
CarSpredb |
23.17 |
25.34 |
25.47 |
21.39 |
|
iCar-PseCpc |
45.18 |
48.20 |
46.67 |
50.68 |
|
PTMPreda |
Sp (%)d |
92.99 |
93.20 |
90.99 |
91.36 |
CarSpredb |
92.43 |
93.28 |
93.39 |
93.42 |
|
iCar-PseCpc |
99.25 |
98.54 |
99.57 |
98.58 |
|
PTMPreda |
AUCe |
0.6858 |
0.6903 |
0.5981 |
0.6563 |
CarSpredb |
0.6849 |
0.7163 |
0.7158 |
0.7134 |
|
iCar-PseCpc |
0.8728 |
0.8484 |
0.8668 |
0.8603 |
|
aThe predictor developed in [33], where ξ = 13; i.e. the sample length is 27.
bThe predictor developed in [32], where the sample length was not fixed.
cThe predictor proposed in this paper.
dSee Eq.9 for the definition of metrics.
eThe area under the curve of Figure.2; the greater the AUC value is, the better the corresponding predictor will be [52, 53].
(4) If you have a lot of query protein sequences and need a lot of computational time, you can choose to use the batch prediction. To do so, just use the Browse button to select the desired file (in FASTA format of course) and follow the online instruction.
(5) The benchmark dataset used in this study is available by clicking the button of Supporting Information on the top of Figure 1.
(6) To see the key papers used to develop this server, just click on the button of Citation.
Result comparison and analysis
The success scores achieved by the iCar-PseCp predictor via the 10-fold target cross validation for K-, P-, R-, and T-type carbonylation are shown in Table 1. Meanwhile, the corresponding rates by PTMPred [33] and CarSpred [32] are also listed there. As we can see from Table 1, compared with its counterparts, although the Acc values obtained by the iCar-PseCp are within the ± 4%, its Sn and Sp values are more than 20% and 5–9% higher than those by PTMPred and CarSpred, indicating that the results predicted by the previous methods [33–34] contain much more false negative and positive events. Particularly, the MCC values achieved by iCar-PseCp are about 2 or 3 times higher than those of its counterparts, indicating that the new proposed predictor is significantly more stable.
Graphical approach is a useful vehicle for analyzing complicated biological systems as demonstrated by a series of previous studies (see, e.g., [42–51]. Here, to provide an intuitive comparison, the graph of Receiver Operating Characteristic (ROC) [52, 53] was utilized to show the advantage of iCar-PseCp over the PTMPred [33] and CarSpred [32]. In Figure 2 the red and green graphic lines are the ROC curves for the PTMPred and CarSpred, respectively; while the blue graphic line for the proposed predictor iCar-PseCp. The greater the area under the AUC is, the better the predictor will be [52–53]. As we can see from Figure 2, the area under the blue curve is remarkably greater than that under the red or green line, once again indicating that the proposed predictor is indeed much better than PTMPred and CarSpred predictors. Therefore, iCAR-PseCp will become a very useful bioinformatics tool for relevant basic research and drug development as well.
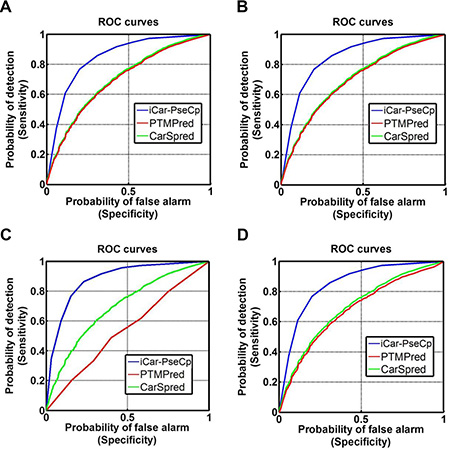
Figure 2: The intuitive graphs of ROC curves to show the performance of PTMPred, CarSpred, iCar-PseCp, respectively, for the case of the center residue is (A) K, (B) P, (C) R, and (D) T. See the main text for further explanation.
Why can the proposed method enhance the prediction quality so significantly? First, the coupling effects among the amino acids around the carbonylation sites are taken into account via the conditional probability approach, which has been proved to be indeed very useful in a series of previous studies [57–60]. Second, the predictor is trained by a balanced benchmark dataset via Monte Carlo sampling, and hence many false prediction events as occurring in the cases of PTMPred [33] and CarSpred [32] trained by very imbalanced and skewed datasets can be completely avoided.
MATERIALS AND METHODS
Benchmark dataset
The data used in the current study was derived from the 230 carbonylated protein sequences from human [26, 61–67] and 20 carbonylated protein sequences from Photobacterium and Escherichia coli [29, 63, 68, 69].
For facilitating description later, the Chou’s peptide formulation was adopted. It was used for studying enzyme specificity [57], signal peptide cleavage sites [70], hydroxyproline and hydroxylysine sites [8], methylation sites [7], nitrotyrosine sites [9], protein-protein interaction [71], and protein-protein binding sites [72]. According to Chou’s scheme, a potential carbonylation site-containing peptide sample can be generally expressed by

where the symbol ⊛ denotes the single amino acid code K, P, R, or T, the subscript ξ is an integer, R−ξ represents the ξ-th upstream amino acid residue from the center, the R+ξ the ξ-th downstream amino acid residue, and so forth. The (2ξ + 1) -tuple peptide sample Pξ(⊛) can be further classified into the following two categories:
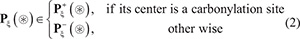
where  denotes a true carbonylation segment with K, P, R, or T at its center,
  a false segment with K, P, R, or T at its center, and the symbol ∈ means “a member of” in the set theory.
In literature the benchmark dataset usually consists of a training dataset and a testing dataset: the former is used for training a model, while the latter for testing the model. But as pointed out in a comprehensive review [73], there is no need to artificially separate a benchmark dataset into the two parts if the prediction model is examined by the jackknife test or subsampling (K-fold) cross-validation since the outcome thus obtained is actually from a combination of many different independent dataset tests. Thus, the benchmark dataset  for the current study can be formulated as
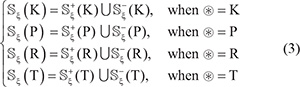
where the positive subset  only contains the samples of true carbonylation segments
  , and the negative subset
  only contains the samples of false carbonylation segments
  (see Eq.2); while ∪ represents the symbol for “union” in the set theory.
The detailed procedures to construct the benchmark dataset are as follows. (1) As done in [74], slide the (2ξ + 1) -tuple peptide window along each of the aforementioned 230 + 20 = 250 protein sequences used by [32], and collected were only those peptide segments that have K, P, R, and T at the center. (2) If the upstream or downstream in a protein sequence was less than ξ or greater than L−ξ where L is the length of the protein sequence concerned, the lacking amino acid was filled with a dummy residue X. (3) The peptide segment samples thus obtained were put into the positive subset  if their centers have been experimentally annotated as the carbonylation sites; otherwise, into the negative subset
  . (4) Using the CD-HIT software [75], the aforementioned samples were further subject to a screening procedure to winnow those that had ≥ 30% pairwise sequence identity to any other in a same subset.
Note that the length of peptide samples and their number thus generated would depend on the ξ value. But preliminary tests had indicated that it would be most promising when ξ = 7 or the sample’s length was 2ξ + 1 = 15. Accordingly, hereafter we only consider the case of ξ = 7; i.e., the samples with 15 amino acid residues. Thus, the benchmark datasets thus obtained for  are given in Supporting Information S1, S2, S3, and S4, respectively. Listed in Table 2 is a summary of their sizes.
Table 2: Summary of carbonylation site samples in the benchmark dataseta
Subset |
Carbonylation type and number of samples |
|||
|---|---|---|---|---|
⊛ = K |
⊛ = P |
⊛ = R |
⊛ = T |
|
Positive |
300 |
126 |
136 |
121 |
Negative |
1,949 |
792 |
847 |
732 |
aSee Eq.3 and the relevant text for further explanation.
Incorporate sequence-coupled information into general pseudo amino acid composition
With the avalanche of biological sequence generated in the post-genomic age, one of the most important problems in computational biology is how to formulate a biological sequence with a discrete model or a vector, yet still considerably keep its sequence order information or essential feature. This is because all the existing machine-learning algorithms can only handle vector but not sequence samples, as elaborated in [15].
To address this problem, the pseudo amino acid composition [76, 77] or PseAAC was proposed. Ever since the concept of pseudo amino acid composition or Chou’s PseAAC [78–80] was proposed, it has rapidly penetrated into many biomedicine and drug development areas [81–83] and nearly all the areas of computational proteomics (see, e.g., [84–91] as well as a long list of references cited in [92, 93]).
Because it has been widely and increasingly used, recently three powerful open access soft-wares, called ‘PseAAC-Builder’ [78], ‘propy’ [79], and ‘PseAAC-General’ [92], were established: the former two are for generating various modes of Chou’s special PseAAC; while the 3rd one for those of Chou’s general PseAAC [41], including not only all the special modes of feature vectors for proteins but also the higher level feature vectors such as “Functional Domain” mode (see Eqs.9–10 of [41]), “Gene Ontology” mode (see Eqs.11–12 of [41]), and “Sequential Evolution” or “PSSM” mode (see Eqs.13–14 of [41]). Inspired by the successes of using PseAAC to deal with protein/peptide sequences, three web-servers [94–96] were developed for generating various feature vectors for DNA/RNA sequences. Particularly, recently a powerful web-server called Pse-in-One [97] has been developed that can be used to generate any desired feature vectors for protein/peptide and DNA/RNA sequences according to the need of users’ studies.
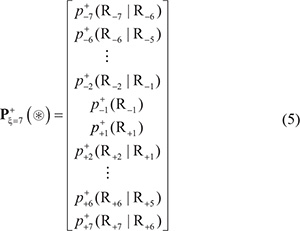
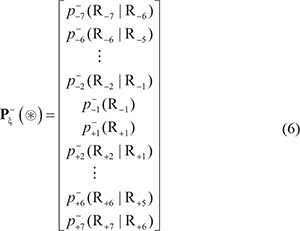
According to the general PseAAC [41], the peptide sequence of Eq.1 can be formulated as

where
and
In Eq.5  is the conditional probability of amino acid R−7 occurring at the left 1st position (see Eq.1) given that its closest right neighbor is R−6,
  is the conditional probability of amino acid R−6 occurring at the left 2nd position given that its closest right neighbor is R−5, and so forth. Note that in Eq.5, only
  are of non-conditional probability since the right neighbor of R−1 and the left neighbor of R+1 are always ⊛ (namely Lys, Pro, Arg, or Thr, respectively). All these probability values can be easily derived from the positive training subsets taken from Supporting Information S1, S2, S3, and S4, respectively as done in [98]. Likewise, the components in Eq.6 are the same as those in Eq.5 except for that they are derived from the corresponding negative training subsets therein.
Expanding positive samples by Monte Carlo approach
As we can see from the Supporting Information S1, S2, S3, and S4, the negative subset  in each of them is much larger than its corresponding positive one
  in number of samples. Although this might reflect the real world in which the non-carbonylation sites are always the majority compared with the carbonylation ones, a predictor trained by such a highly skewed benchmark dataset would inevitably have the bias consequence that many carbonylation sites might be mispredicted as non-carbonylation ones. Therefore, it is important to find an effective approach to minimize this kind of bias consequence. To realize this, we adopted the Monte Carlo simulation [99, 100] to expand the samples of positive subset. The concrete procedures are as follows.
Step 1. Suppose  (i = −7, −6, …, −1, +1, …, +6, +7; i ≠ 0) is the probability of the 20 native amino acids occurring at the i-th position of the carbonylation samples that can be derived from a training dataset in the positive subsets of Supporting Information S1, S2, S3, or S4, respectively.
Step 2. For simplicity, let us formulate the probability thus obtained according to the alphabetical order of the single-letter code of the 20 native amino acids (note that the dummy amino acid X introduced in the Benchmark Dataset section was treated as the 21st amino acid); i.e.,
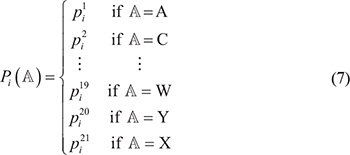
Step 3. Generate a random number  between 0 and 1; if

then the k-th amino acid is drawn for an expanded positive sample at its i-th subsite. For example, if k = 2 and i = −7, then the amino acid thus drawn should be C for the left 1st sequence position (cf. Eq.1); if k = 19 and i = −6, then the amino acid drawn should be W for the left 2nd sequence position; if k = 20 and i = +7, then the amino acid drawn should be Y for the right last sequence position; and so forth.
Step 4. Repeat the above steps until the number of positive (the original plus the expanded) samples is the same as the negative samples.
At first glance, the rationale of the above Monte Carlo sampling procedure seems like a circular argument. But it is correct as elucidated in [54]. Particularly, these expanded positive samples were used only for training a model but not used for testing it, as well be further discussed later.
Random forests algorithm
The random forests (RF) algorithm is a powerful algorithm and has been used in many areas of computational biology (see, e.g. [11, 12, 71, 72, 101−104]). The detailed procedures of RF and its formulation have been very clearly described in [105], and hence there is no need to repeat here.
For the current study, all the involved peptide samples were converted into a 14-D (dimensional) vector according to Eq.4, and then entered into the RF operation engine as the input. And the output would indicate whether the center residue ⊛ of the query peptide is a “carbonylation site” or “non- carbonylation site”. Note that, in using the current prediction method, one must observe the self-consistency principle: if the center residue of a query peptide is ⊛ = K then the corresponding training data must be taken from  if the center residue of a query peptide is ⊛= P, then the training data must be taken from and
  and so forth (see Eq.3).
The predictor established via the above procedures is called “pCar-PseCp”, where “i” stands for identify”, “Car” for “carbonylation site”, “Pse” for “general PseAAC”, and “Cp” for “sequence coupled effect”.
As pointed out in the Introduction section, one of the keys in establishing a useful predictor is how to properly evaluate its anticipated success rates. To realize this, we need to consider the following two things: one is what metrics or scales should be adopted to quantitatively measure its prediction quality; the other is what validation method should be utilized to calculate or derive the metrics values. Below, we are to address the two problems.
A set of four metrics
The following four metrics are usually used in literature to measure the quality of binary classification: (1) overall accuracy or Acc; (2) Mathew’s correlation coefficient or MCC; (3) sensitivity or Sn; and (4) specificity or Sp (see, e.g., [106]). Unfortunately, the conventional formulations for the four are not intuitive and that most experimental scientists feel difficult to understand them, particularly for the one of MCC. Interestingly, by using the Chou’s symbols and derivation in studying signal peptides [107], the aforementioned four metrics can be easily converted into a set of following equations [5, 35]:
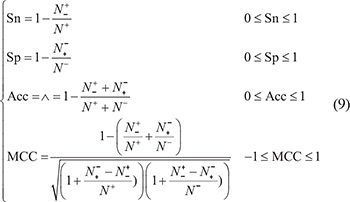
where N+ represents the total number of carbonylation sites investigated whereas  the number of true carbonylation sites incorrectly predicted to be of non-carbonylation site; N− the total number of the non-carbonylation sites investigated whereas
  the number of non-carbonylation sites incorrectly predicted to be of carbonylation site.
According to Eq.9, it is crystal clear to see the following. When  = 0 meaning none of the true carbonylation sites are incorrectly predicted to be of non-carbonylation site, we have the sensitivity Sn = 1. When
  = N+ meaning that all the carbonylation sites are incorrectly predicted to be of non-carbonylation site, we have the sensitivity Sn = 0. Likewise, when
  = 0 meaning none of the non-carbonylation sites are incorrectly predicted to be of carbonylation site, we have the specificity Sp = 1; whereas
  = N− meaning that all the non-carbonylation sites are incorrectly predicted to be of carbonylation sites, we have the specificity Sp = 0. When
  meaning that none of carbonylation sites in the positive dataset and none of the non-carbonylation sites in the negative dataset are incorrectly predicted, we have the overall accuracy Acc = 1 and MCC = 1; when
  meaning that all the carbonylation sites in the positive dataset and all the non-carbonylation sites in the negative dataset are incorrectly predicted, we have the overall accuracy Acc = 0 and MCC = −1; whereas when
  we have Acc = 0.5 and MCC = 0 meaning no better than random guess. Therefore, using Eq.9 has made the meanings of sensitivity, specificity, overall accuracy, and Mathew’s correlation coefficient much more intuitive and easier-to-understand, particularly for the meaning of MCC, as concurred recently by many investigators (see, e.g., [14, 16, 38, 39, 71, 72, 108–113]).
Note that, however, the set of equations defined in Eq.9 is valid only for the single-label systems. For the multi-label systems whose emergence has become more frequent in system biology [114–116] and system medicine [117], a completely different set of metrics are needed as elaborated in [118].
Target cross-validation
With a good set of metrics to measure the predictor’s quality, the next thing to consider is what kind of validation method should be adopted to calculate the metrics values.
The following three cross-validation methods are often used in statistics to derive the metrics values for a predictor: independent dataset test, subsampling (or K-fold cross-validation) test, and jackknife test [119]. Among these three, however, the jackknife test is deemed the least arbitrary that can always yield a unique outcome for a given benchmark dataset as elucidated in [41] and demonstrated by Eqs.28–32 therein. Accordingly, the jackknife test has been widely recognized and increasingly used by investigators to examine the quality of various predictors (see, e.g., [84–87, 120–127]). However, to reduce the computational time, in this study we adopted the K-fold cross-validation, as done by most investigators with SVM and random forests algorithms as the prediction engine.
When conducting the K-fold cross-validation for the current predictor iCAR-PseCp, however, some special consideration is needed. This is because a dataset, after expanding by Monte Carlo sampling, may contain many hypothetical positive samples. It would be fine to use such an expanded dataset to train a prediction model, but certainly not for validation. This is because the validation should be made on a testing dataset that only contains experiment-confirmed samples without any added hypothetical samples [14, 104]. To ensure this, a special cross-validation, the so-called target cross-validation [113], has been introduced here. During the target cross-validation process, only the experiment-confirmed samples are picked out from the testing dataset for validating and scoring [11]. The detailed procedures of the target K-fold cross-validation (without losing the generality, let us consider K = 10) can be described as follows.
Step 1. Before expanding the positive samples, both the original positive and negative subsets were randomly divided into 10 parts with about the same size. For example, for  in Supporting Information S1, after such evenly division we have
and

where the symbol  means that the divided 10 datasets are about the same in size, and so are their subsets.
Step 2. One of the 10 sets, say  was singled out as the testing dataset and the remaining nine sets as the training dataset.
Step 3. Based on the training dataset, use Eqs.4–6 to derive the sequence-coupled information. Also, based on the same training dataset, use Monte Carlo sampling to expand its positive subset making it have the same size as the negative subset.
Step 4. Use the sequence-coupled information and the expanded training dataset obtained in Step 3 to train the model and perform the prediction for each of the samples in the testing dataset.
Step 5. Repeat Steps 2–4 until all the 10 divided sets had been singled out one-by-one for testing validation.
Step 6. Substituting the average scores obtained from the above 10-round tests into Eq.9 to calculate Sn, Sp, Acc, and MCC.
It is crystal clear to see from the above steps that the validation was made only for experiment-confirmed samples, and that none of information from the testing datasets was ever used to train the predictor.
CONCLUSIONS
The iCar-PseCp predictor is a new bioinformatics tool for identifying the carbonylation sites in proteins. Compared with the existing predictors in this area, its prediction quality is much better, with remarkably more stability and less false predictions. For the convenience of most experimental scientists, we have provided its web-server and a step-by-step guide, by which users can easily obtain their desired results without the need to go through the detailed mathematics. The reason of including them in this paper is for the integrity of the new prediction method, and that these techniques, such as sequence-coupled approach and Monte Carlo sampling, may be of use as well in developing other tools in computational biology.
We anticipate that iCar-PseCp will become a very useful high throughput tool, or at the very least, a complementary tool to the existing methods for predicting the protein carbonylation sites.
ACKNOWLEDGMENTS AND FUNDING
The authors wish to thank the five anonymous reviewers, whose constructive comments are very helpful for strengthening the presentation of this paper. This work was partially supported by the National Nature Science Foundation of China (No. 61261027, 31260273, 31560316), the Natural Science Foundation of Jiangxi Province, China (No. 20122BAB211033, 20122BAB201044, 20132BAB201053). The funders had no role in study design, data collection and analysis, decision to publish, or preparation of the manuscript.
CONFLICTS OF INTEREST
The authors declare no conflicts of interest.
REFERENCES
1. Foster MW, Hess DT, Stamler JS. Protein S-nitrosylation in health and disease: a current perspective. Trends Mol Med. 2009; 15:391–404.
2. Uehara T, Nakamura T, Yao D, Shi ZQ, Gu Z, Ma Y, Masliah E, Nomura Y, Lipton SA. S-nitrosylated protein-disulphide isomerase links protein misfolding to neurodegeneration. Nature. 2006; 441:513–517.
3. Kobayashi Y, Absher DM, Gulzar ZG, Young SR, McKenney JK, Peehl DM, Brooks JD, Myers RM, Sherlock G. DNA methylation profiling reveals novel biomarkers and important roles for DNA methyltransferases in prostate cancer. Genome Research. 2011; 21:1017–1027.
4. Cantara WA, Crain PF, Rozenski J, McCloskey JA, Harris KA, Zhang X, Vendeix FA, Fabris D, Agris PF. The RNA Modification Database, RNAMDB: 2011 update. Nucleic Acids Res. 2011; 39:D195–201.
5. Xu Y, Ding J, Wu LY. iSNO-PseAAC: Predict cysteine S-nitrosylation sites in proteins by incorporating position specific amino acid propensity into pseudo amino acid composition PLoS ONE. 2013; 8:e55844.
6. Xu Y, Shao XJ, Wu LY, Deng NY. iSNO-AAPair: incorporating amino acid pairwise coupling into PseAAC for predicting cysteine S-nitrosylation sites in proteins. PeerJ. 2013; 1:e171.
7. Qiu WR, Xiao X, Lin WZ. iMethyl-PseAAC: Identification of Protein Methylation Sites via a Pseudo Amino Acid Composition Approach. Biomed Res Int (BMRI). 2014; 2014:947416.
8. Xu Y, Wen X, Shao XJ. iHyd-PseAAC: Predicting hydroxyproline and hydroxylysine in proteins by incorporating dipeptide position-specific propensity into pseudo amino acid composition. Int J Mol Sci. 2014; 15:7594–7610.
9. Xu Y, Wen X, Wen LS, Wu LY. iNitro-Tyr: Prediction of nitrotyrosine sites in proteins with general pseudo amino acid composition. PLoS ONE. 2014; 9:e105018.
10. Qiu WR, Xiao X, Lin WZ. iUbiq-Lys: Prediction of lysine ubiquitination sites in proteins by extracting sequence evolution information via a grey system model. Journal of Biomolecular Structure and Dynamics (JBSD) 2015; 33:1731–1742.
11. Jia J, Liu Z, Xiao X, Liu B. iSuc-PseOpt: Identifying lysine succinylation sites in proteins by incorporating sequence-coupling effects into pseudo components and optimizing imbalanced training dataset. Anal Biochem. 2016; 497:48–56.
12. Jia J, Liu Z, Xiao X, Liu B. pSuc-Lys: Predict lysine succinylation sites in proteins with PseAAC and ensemble random forest approach. J Theor Biol. 2016; 394:223–230.
13. Xu Y. Recent progress in predicting posttranslational modification sites in proteins. Curr Top Med Chem. 2016; 16:591–603.
14. Liu Z, Xiao X, Qiu WR. iDNA-Methyl: Identifying DNA methylation sites via pseudo trinucleotide composition. Analytical Biochemistry. 2015; 474:69–77.
15. Chou KC. Impacts of bioinformatics to medicinal chemistry. Medicinal Chemistry. 2015; 11:218–234.
16. Chen W, Feng P, Ding H. iRNA-Methyl: Identifying N6-methyladenosine sites using pseudo nucleotide composition Analytical Biochemistry (also, Data in Brief, 2015, 5: 376–378). 2015; 490:26–33.
17. Liu Z, Xiao X, Yu DJ, Jia J. pRNAm-PC: Predicting N-methyladenosine sites in RNA sequences via physical-chemical properties. Anal Biochem. 2016; 497:60–67.
18. Shacter E. Quantification and significance of protein oxidation in biological samples 1*. Drug metabolism reviews. 2000; 32:307–326.
19. Gianazza E, Crawford J, Miller I. Detecting oxidative post-translational modifications in proteins. Amino Acids. 2007; 33:51–56.
20. Dalle-Donne I, Giustarini D, Colombo R, Rossi R, Milzani A. Protein carbonylation in human diseases. Trends in Molecular Medicine. 2003; 9:169–176.
21. Moller IM, Rogowska-Wrzesinska A, Rao RSP. Protein carbonylation and metal-catalyzed protein oxidation in a cellular perspective. Journal of proteomics. 2011; 74:2228–2242.
22. Bota DA, Van Remmen H, Davies KJA. Modulation of Lon protease activity and aconitase turnover during aging and oxidative stress. FEBS letters. 2002; 532:103–106.
23. Frohnert BI, Sinaiko AR, Serrot FJ, Foncea RE, Moran A, Ikramuddin S, Choudry U, Bernlohr DA. Increased adipose protein carbonylation in human obesity. Obesity. 2011; 19:1735–1741.
24. Dalle-Donne I, Rossi R, Giustarini D, Milzani A, Colombo R. Protein carbonyl groups as biomarkers of oxidative stress. Clinica Chimica Acta. 2003; 329:23–38.
25. Dalle-Donne I, Aldini G, Carini M, Colombo R, Rossi R, Milzani A. Protein carbonylation, cellular dysfunction, and disease progression. J Cell Mol Med. 2006; 10:389–406.
26. Bollineni RC, Hoffmann R, Fedorova M. Proteome-wide profiling of carbonylated proteins and carbonylation sites in HeLa cells under mild oxidative stress conditions. Free Radical Biology and Medicine. 2014; 68:186–195.
27. Colzani M, Aldini G, Carini M. Mass spectrometric approaches for the identification and quantification of reactive carbonyl species protein adducts. Journal of proteomics. 2013; 92:28–50.
28. Stadtman ER, Levine RL. Free radical-mediated oxidation of free amino acids and amino acid residues in proteins. Amino Acids. 2003; 25:207–218.
29. Maisonneuve E, Ducret A, Khoueiry P, Lignon S, Longhi S, Talla E, Dukan S. Rules governing selective protein carbonylation. PLoS One. 2009; 4:e7269.
30. Rao R, Moller IM. Pattern of occurrence and occupancy of carbonylation sites in proteins. Proteomics. 11:4166–4173.
31. Bollineni RC, Hoffmann R, Fedorova M. Identification of protein carbonylation sites by two-dimensional liquid chromatography in combination with MALDI-and ESI-MS. Journal of proteomics. 2011; 74:2338–2350.
32. Lv H, Han J, Liu J, Zheng J, Liu R, Zhong D. CarSPred: A Computational Tool for Predicting Carbonylation Sites of Human Proteins. PLoS One. 2014; 9:e111478. doi: 10.1371/journal.pone.0111478.
33. Xu Y, Wang X, Wang Y, Tian Y, Shao X, Wu LY, Deng N. Prediction of posttranslational modification sites from amino acid sequences with kernel methods. Journal of theoretical biology. 2014; 344:78–87.
34. Chen W, Lin H, Feng PM, Ding C. iNuc-PhysChem: A Sequence-Based Predictor for Identifying Nucleosomes via Physicochemical Properties. PLoS ONE. 2012; 7:e47843.
35. Chen W, Feng PM, Lin H, Chou KC. iRSpot-PseDNC: identify recombination spots with pseudo dinucleotide composition Nucleic Acids Res. 2013; 41:e68.
36. Lin H, Deng EZ, Ding H, Chen W, Chou KC. iPro54-PseKNC: a sequence-based predictor for identifying sigma-54 promoters in prokaryote with pseudo k-tuple nucleotide composition. Nucleic Acids Res. 2014; 42:12961–12972.
37. Guo SH, Deng EZ, Xu LQ, Ding H. iNuc-PseKNC: a sequence-based predictor for predicting nucleosome positioning in genomes with pseudo k-tuple nucleotide composition. Bioinformatics. 2014; 30:1522–1529.
38. Liu B, Fang L, Wang S, Wang X. Identification of microRNA precursor with the degenerate K-tuple or Kmer strategy Journal of Theoretical Biology. 2015; 385:153–159.
39. Liu B, Fang L, Long R. iEnhancer-2L: a two-layer predictor for identifying enhancers and their strength by pseudo k-tuple nucleotide composition Bioinformatics. 2016; 32:362–389.
40. Chen W, Ding H, Feng P, Lin H, Chou KC. iACP: a sequence-based tool for identifying anticancer peptides. Oncotarget. 2016; 7:16895–16909. doi: 10.18632/oncotarget.7815.
41. Chou KC. Some remarks on protein attribute prediction and pseudo amino acid composition (50th Anniversary Year Review). J Theor Biol. 2011; 273:236–247.
42. Forsen S. Graphical rules for enzyme-catalyzed rate laws. Biochem J. 1980; 187:829–835.
43. Zhou GP, Deng MH. An extension of Chou's graphic rules for deriving enzyme kinetic equations to systems involving parallel reaction pathways. Biochem J. 1984; 222:169–176.
44. Chou KC. Graphic rules in steady and non-steady enzyme kinetics. J Biol Chem. 1989; 264:12074–12079.
45. Althaus IW, Chou JJ, Gonzales AJ, Kezdy FJ, Romero DL, Aristoff PA, Tarpley WG, Reusser F. Kinetic studies with the nonnucleoside HIV-1 reverse transcriptase inhibitor U-88204E. Biochemistry. 1993; 32:6548–6554.
46. Althaus IW, Gonzales AJ, Chou JJ, Diebel MR, Romero DL, Aristoff PA, Tarpley WG, Reusser F. The quinoline U-78036 is a potent inhibitor of HIV-1 reverse transcriptase. J Biol Chem. 1993; 268:14875–14880.
47. Wu ZC, Xiao X. 2D-MH: A web-server for generating graphic representation of protein sequences based on the physicochemical properties of their constituent amino acids. J Theor Biol. 2010; 267:29–34.
48. Lin WZ, Xiao X. Wenxiang: a web-server for drawing wenxiang diagrams. Natural Science. 2011; 3:862–865
49. Zhou GP. The disposition of the LZCC protein residues in wenxiang diagram provides new insights into the protein-protein interaction mechanism. J Theor Biol. 2011; 284:142–148.
50. Zhou GP. The Structural Determinations of the Leucine Zipper Coiled-Coil Domains of the cGMP-Dependent Protein Kinase I alpha and its Interaction with the Myosin Binding Subunit of the Myosin Light Chains Phosphase. Proteins & Peptide Letters. 2011; 18:966–978.
51. Zhou GP, Huang RB. The pH-Triggered Conversion of the PrP(c) to PrP(sc.). Curr Top Med Chem. 2013; 13:1152–1163.
52. Fawcett JA. An Introduction to ROC Analysis. Pattern Recognition Letters. 2005; 27:861–874.
53. Davis J, Goadrich M. The relationship between Precision-Recall and ROC curves. Proceedings of the 23rd international conference on Machine learning: ACM), 2006. pp. 233–240.
54. Chou KC. A vectorized sequence-coupling model for predicting HIV protease cleavage sites in proteins. J Biol Chem. 1993; 268:16938–16948.
55. Zhang CT. An alternate-subsite-coupled model for predicting HIV protease cleavage sites in proteins. Protein Eng. 1993; 7:65–73.
56. Tomasselli AL, Reardon IM, Heinrikson RL. Predicting HIV protease cleavage sites in proteins by a discriminant function method. Proteins. 1996; 24:51–72.
57. Chou KC. A sequence-coupled vector-projection model for predicting the specificity of GalNAc-transferase. Protein Science. 1995; 4:1365–1383.
58. Chou KC. Review: Prediction of protein signal sequences. Current Protein and Peptide Science. 2002; 3:615–622.
59. Chou KC, Shen HB. Signal-CF: a subsite-coupled and window-fusing approach for predicting signal peptides. Biochem Biophys Res Comm (BBRC). 2007; 357:633–640.
60. Chou KC. Review: Prediction of tight turns and their types in proteins. Anal Biochem. 2000; 286:1–16.
61. Ishii T, Ito S, Kumazawa S, Sakurai T, Yamaguchi S, Mori T, Nakayama T, Uchida K. Site-specific modification of positively-charged surfaces on human serum albumin by malondialdehyde. Biochemical and biophysical research communications. 2008; 371:28–32.
62. Lee S, Young NL, Whetstone PA, Cheal SM, Benner WH, Lebrilla CB, Meares CF. Method to site-specifically identify and quantitate carbonyl end products of protein oxidation using oxidation-dependent element coded affinity tags (O-ECAT) and nanoliquid chromatography Fourier transform mass spectrometry. Journal of proteome research. 2006; 5:539–547.
63. Madian AG, Diaz-Maldonado N, Gao Q, Regnier FE. Oxidative stress induced carbonylation in human plasma. Journal of proteomics. 2011; 74:2395–2416.
64. Madian AG, Regnier FE. Profiling carbonylated proteins in human plasma. Journal of proteome research. 2010; 9:1330–1343.
65. Mirzaei H, Regnier F. Identification and quantification of protein carbonylation using light and heavy isotope labeled Girard's P reagent. Journal of Chromatography A. 2006; 1134:122–133.
66. Mirzaei H, Regnier F. Enrichment of carbonylated peptides using Girard P reagent and strong cation exchange chromatography. Analytical chemistry. 2006; 78:770–778.
67. Temple A, Yen TY, Gronert S. Identification of specific protein carbonylation sites in model oxidations of human serum albumin. Journal of the American Society for Mass Spectrometry. 2006; 17:1172–1180.
68. Chavez JD, Bisson WH, Maier CS. A targeted mass spectrometry-based approach for the identification and characterization of proteins containing alpha-aminoadipic and gamma-glutamic semialdehyde residues. Anal Bioanal Chem. 2010; 398:2905–2914.
69. Mirzaei H, Regnier F. Affinity chromatographic selection of carbonylated proteins followed by identification of oxidation sites using tandem mass spectrometry. Analytical chemistry. 2005; 77:2386–2392.
70. Chou KC. Using subsite coupling to predict signal peptides. Protein Eng. 2001; 14:75–79.
71. Jia J, Liu Z, Xiao X. iPPI-Esml: an ensemble classifier for identifying the interactions of proteins by incorporating their physicochemical properties and wavelet transforms into PseAAC. J Theor Biol. 2015; 377:47–56.
72. Jia J, Liu Z, Xiao X, Liu B. Identification of protein-protein binding sites by incorporating the physicochemical properties and stationary wavelet transforms into pseudo amino acid composition (iPPBS-PseAAC) Journal of Biomolecular Structure & Dynamics. 2015; doi:10.1080/07391102.2015.1095116.
73. Chou KC, Shen HB. Review: Recent progresses in protein subcellular location prediction. Anal Biochem. 2007; 370:1–16.
74. Chou KC. Prediction of signal peptides using scaled window. Peptides. 2001; 22:1973–1979.
75. Fu L, Niu B, Zhu Z, Wu S, Li W. CD-HIT: accelerated for clustering the next-generation sequencing data. Bioinformatics. 2012; 28:3150–3152.
76. Chou KC. Prediction of protein cellular attributes using pseudo amino acid composition. PROTEINS: Structure, Function, and Genetics (Erratum: ibid, 2001, Vol44, 60). 2001; 43:246–255.
77. Chou KC. Using amphiphilic pseudo amino acid composition to predict enzyme subfamily classes. Bioinformatics. 2005; 21:10–19.
78. Du P, Wang X, Xu C, Gao Y. PseAAC-Builder: A cross-platform stand-alone program for generating various special Chou's pseudo-amino acid compositions. Anal Biochem. 2012; 425:117–119.
79. Cao DS, Xu QS, Liang YZ. propy: a tool to generate various modes of Chou's PseAAC. Bioinformatics. 2013; 29:960–962.
80. Lin SX, Lapointe J. Theoretical and experimental biology in one—A symposium in honour of Professor Kuo-Chen Chou’s 50th anniversary and Professor Richard Giegé’s 40th anniversary of their scientific careers. J Biomedical Science and Engineering. 2013; 6:435–442.
81. Zhong WZ, Zhou SF. Molecular science for drug development and biomedicine. Intenational Journal of Molecular Sciences. 2014; 15:20072–20078.
82. Zhou GP. Current progress in structural bioinformatics of protein-biomolecule interactions. Medicinal Chemistry. 2015; 11:216–216.
83. Zhou GP, Zhong WZ. Perspectives in Medicinal Chemistry. Current Topics in Medicinal Chemistry. 2016; 16:381–382.
84. Khan ZU, Hayat M, Khan MA. Discrimination of acidic and alkaline enzyme using Chou's pseudo amino acid composition in conjunction with probabilistic neural network model. J Theor Biol. 2015; 365:197–203.
85. Dehzangi A, Heffernan R, Sharma A, Lyons J, Paliwal K, Sattar A. Gram-positive and Gram-negative protein subcellular localization by incorporating evolutionary-based descriptors into Chou's general PseAAC. J Theor Biol. 2015; 364:284–294.
86. Kumar R, Srivastava A, Kumari B, Kumar M. Prediction of beta-lactamase and its class by Chou's pseudo-amino acid composition and support vector machine. J Theor Biol. 2015; 365:96–103.
87. Mondal S, Pai PP. Chou's pseudo amino acid composition improves sequence-based antifreeze protein prediction. J Theor Biol. 2014; 356:30–35.
88. Wang X, Zhang W, Zhang Q, Li GZ. MultiP-SChlo: multi-label protein subchloroplast localization prediction with Chou's pseudo amino acid composition and a novel multi-label classifier. Bioinformatics. 2015; 31:2639–2645.
89. Kabir M, Hayat M. iRSpot-GAEnsC: identifing recombination spots via ensemble classifier and extending the concept of Chou's PseAAC to formulate DNA samples. Molecular genetics and genomics. 2016; 291:285–296.
90. Ahmad K, Waris M, Hayat M. Prediction of Protein Submitochondrial Locations by Incorporating Dipeptide Composition into Chou's General Pseudo Amino Acid Composition. J Membr Biol. 2016:10.1007/s00232-00015-09868-00238.
91. Tang H, Chen W, Lin H. Identification of immunoglobulins using Chou's pseudo amino acid composition with feature selection technique. Mol Biosyst. 2016; 12:1269–1275.
92. Du P, Gu S, Jiao Y. PseAAC-General: Fast building various modes of general form of Chou's pseudo-amino acid composition for large-scale protein datasets. International Journal of Molecular Sciences. 2014; 15:3495–3506.
93. Chen W, Lin H, Chou KC. Pseudo nucleotide composition or PseKNC: an effective formulation for analyzing genomic sequences. Mol BioSyst. 2015; 11:2620–2634.
94. Chen W, Lei TY, Jin DC, Lin H. PseKNC: a flexible web-server for generating pseudo K-tuple nucleotide composition. Anal Biochem. 2014; 456:53–60.
95. Chen W, Zhang X, Brooker J, Lin H. PseKNC-General: a cross-platform package for generating various modes of pseudo nucleotide compositions. Bioinformatics. 2015; 31:119–120.
96. Liu B, Liu F, Fang L, Wang X. repDNA: a Python package to generate various modes of feature vectors for DNA sequences by incorporating user-defined physicochemical properties and sequence-order effects. Bioinformatics. 2015; 31:1307–1309.
97. Liu B, Liu F, Wang X, Chen J, Fang L, Chou KC. Pse-in-One: a web server for generating various modes of pseudo components of DNA, RNA, and protein sequences Nucleic Acids Res. 2015; 43:W65–W71.
98. Chou KC. Review: Prediction of human immunodeficiency virus protease cleavage sites in proteins. Anal Biochem. 1996; 233:1–14.
99. Zhang CT. Monte Carlo simulation studies on the prediction of protein folding types from amino acid composition. Biophys J. 1992; 63:1523–1529.
100. Zhang CT. Monte Carlo simulation studies on the prediction of protein folding types from amino acid composition. II. correlative effect. J Protein Chem. 1995; 14:251–258.
101. Kandaswamy KK, Moller S, Suganthan PN, Sridharan S, Pugalenthi G. AFP-Pred: A random forest approach for predicting antifreeze proteins from sequence-derived properties. J Theor Biol. 2011; 270:56–62.
102. Lin WZ, Fang JA, Xiao X. iDNA-Prot: Identification of DNA Binding Proteins Using Random Forest with Grey Model. PLoS ONE. 2011; 6:e24756.
103. Pugalenthi G, Kandaswamy KK, Kolatkar P. RSARF: Prediction of Residue Solvent Accessibility from Protein Sequence Using Random Forest Method. Protein & Peptide Letters. 2012; 19:50–56.
104. Jia J, Liu Z, Xiao X, Liu B. iPPBS-Opt: A Sequence-Based Ensemble Classifier for Identifying Protein-Protein Binding Sites by Optimizing Imbalanced Training Datasets. Molecules. 2016; 21:95.
105. Breiman L. Random forests. Machine learning. 2001; 45:5–32.
106. Chen J, Liu H, Yang J. Prediction of linear B-cell epitopes using amino acid pair antigenicity scale. Amino Acids. 2007; 33:423–428.
107. Chou KC. Prediction of protein signal sequences and their cleavage sites. Proteins. 2001; 42:136–139.
108. Chen W, Feng PM, Deng EZ. iTIS-PseTNC: a sequence-based predictor for identifying translation initiation site in human genes using pseudo trinucleotide composition. Anal Biochem. 2014; 462:76–83.
109. Chen W, Feng PM, Lin H. iSS-PseDNC: identifying splicing sites using pseudo dinucleotide composition. Biomed Research International (BMRI). 2014; 2014:623149.
110. Ding H, Deng EZ, Yuan LF, Liu L. iCTX-Type: A sequence-based predictor for identifying the types of conotoxins in targeting ion channels. BioMed Research International (BMRI). 2014; 2014:286419.
111. Liu B, Fang L, Liu F, Wang X. Identification of real microRNA precursors with a pseudo structure status composition approach. PLoS ONE. 2015; 10:e0121501.
112. Liu B, Liu F, Fang L, Wang X. repRNA: a web server for generating various feature vectors of RNA sequences. Molecular Genetics and Genomics. 2016; 291:473–481.
113. Xiao X, Min JL, Lin WZ, Liu Z. iDrug-Target: predicting the interactions between drug compounds and target proteins in cellular networking via the benchmark dataset optimization approach. Journal of Biomolecular Structure & Dynamics. 2015; 33:2221–2233.
114. Chou KC, Wu ZC, Xiao X. iLoc-Hum: Using accumulation-label scale to predict subcellular locations of human proteins with both single and multiple sites. Molecular Biosystems. 2012; 8:629–641.
115. Lin WZ, Fang JA, Xiao X. iLoc-Animal: A multi-label learning classifier for predicting subcellular localization of animal proteins. Molecular BioSystems. 2013; 9:634–644.
116. Xiao X, Wu ZC. iLoc-Virus: A multi-label learning classifier for identifying the subcellular localization of virus proteins with both single and multiple sites. J Theor Biol. 2011; 284:42–51.
117. Xiao X, Wang P, Lin WZ, Jia JH. iAMP-2L: A two-level multi-label classifier for identifying antimicrobial peptides and their functional types. Anal Biochem. 2013; 436:168–177.
118. Chou KC. Some Remarks on Predicting Multi-Label Attributes in Molecular Biosystems. Molecular Biosystems. 2013; 9:1092–1100.
119. Chou KC, Zhang CT. Review: Prediction of protein structural classes. Crit Rev Biochem Mol Biol. 1995; 30:275–349.
120. Zhou GP. An intriguing controversy over protein structural class prediction. J Protein Chem. 1998; 17:729–738.
121. Zhou GP, Assa-Munt N. Some insights into protein structural class prediction. Proteins. 2001; 44:57–59.
122. Cai YD, Zhou GP. Support vector machines for predicting membrane protein types by using functional domain composition. Biophys J. 2003; 84:3257–3263.
123. Zhou GP, Doctor K. Subcellular location prediction of apoptosis proteins. Proteins. 2003; 50:44–48.
124. Shen HB, Yang J. Euk-PLoc: an ensemble classifier for large-scale eukaryotic protein subcellular location prediction. Amino Acids. 2007; 33:57–67.
125. Chou KC, Cai YD. Prediction and classification of protein subcellular location: sequence-order effect and pseudo amino acid composition. Journal of Cellular Biochemistry. 2003; 90:1250–1260.
126. Chou KC, Cai YD. Prediction of membrane protein types by incorporating amphipathic effects. Journal of Chemical Information and Modeling. 2005; 45:407–413.
127. Fan GL, Zhang XY, Liu YL, Nang Y, Wang H. DSPMP: Discriminating secretory proteins of malaria parasite by hybridizing different descriptors of Chou's pseudo amino acid patterns. J Comput Chem. 2015; 36:2317–2327.