
INTRODUCTION
Bone marrow fibrosis (MF) may arise from a variety of causes [1] and a European consensus has been reached to minimize inter-observer variability [2]. The best known cause of bone marrow fibrosis is the myeloid proliferative neoplasm (MPN) known as primary myelofibrosis (PMF) [3]. However, MF is also found in 10-20% of patients with myelodysplastic syndromes (MDS) [4-9]. MDS with bone marrow fibrosis is not recognized as a distinct entity in WHO 2008 classification [3] and its prognostic role in MDS remains unresolved [6-12].
Both MPN and MDS usually display an hypercellular bone marrow, but one or more peripheral blood cytopenias are commonly found in MDS. Constitutional activation of Jak-Stat pathway, secondary to activating mutations in JAK2, CALR or MPL genes, is a prominent feature of MPN, including PMF [13], but these mutations are infrequent in MDS [14-18]. Neither polycythemia vera nor primary thrombocytemia show MF at diagnosis despite the frequent presence of JAK2 mutations, and inhibition of the Jak-Stat pathway by ruxolintinib does not reduce MF in PMF, what argues against a pathogenetic role of this pathway in MF. Therefore, the pathogenetic events that underlie MF in MDS and PMF appear to be unrelated to Jak-Stat and yet undisclosed. A multidimensional analysis of MDS taking European Consensus MF grading and mutational analysis into consideration, has not been performed so far.
The aim of this study was to evaluate the biological and clinical events that underlie bone marrow fibrotic changes in MDS as well as to assess its independent prognostic role in a prospective cohort of primary MDS patients.
RESULTS
Clinico-biological correlates of bone marrow fibrosis
Bone marrow fibrosis grade 2 or higher was observed in 17 (22.1%) patients. Non-parametric tests showed bone marrow fibrosis grade (MF-0 to MF-3 following European consensus) to be significantly positively correlated (Table 1) with the number of red cell concentrates transfused in the first 16 weeks from diagnosis, ferritin levels, and erythropoietin (EPO) levels, marrow cellularity, abnormal localization of immature precursors (ALIP), p53 protein immunohistochemical (IHC) score, and peripheral blood Wilms’ tumor gene (WT1) expression. Conversely there were significant negative nonparametric correlations with the proportion of erythroid precursors in bone marrow aspirates, hemoglobin levels and serum levels of CXCL9 (C-X-C motif ligand 9, also known as monokine induced gamma interferon, MIG) and CXCL10 (C-X-C motif ligand 10, also known as interferon gamma-induced protein, IP10), but not with the other covariates, including the proportion of marrow blast cells or ringed sideroblasts, IPSS-R score, soluble p53 protein (p53), TNF alpha, and interleukins (IL) 6, 1 beta and 8 (C-X-C motif ligand 8, CXCL8) or Schanz’s cytogenetic score [19] (more specifically, none of our MF-2/3 patients had either a score of either Very poor or Poor; it was Good in 12 patients and Intermediate in 5). WT1 gene expression had a significant nonparametric correlation (+0.479) with IPSS-R score.
Table 1: Nonparametric correlation between MF grade and other covariates. PRBC, packed red blood cells concentrates; wk, weeks.
N |
Spearman’s Rho |
p-value |
|
Age at diagnosis |
77 |
-0.118 |
0.306 |
No. of PRBC transfused in first 16 wk |
77 |
+0.306 |
0.007 |
PERIPHERAL BLOOD |
|||
WBC count (x 109/L) |
77 |
+0.077 |
0.508 |
Granulocyte count (x 109/L) |
77 |
-0.008 |
0.962 |
Hemoglobin (g/L) |
77 |
-0.283 |
0.013 |
Platelet count (x 109/L) |
77 |
-0.005 |
0.962 |
Blast cells (%) |
77 |
+0.177 |
0.124 |
WT1/GUS ratio (x10-3) |
77 |
+0.260 |
0.023 |
Ferritin (ng/mL) |
77 |
+0.296 |
0.009 |
LDH (U/L) |
77 |
+0.154 |
0.182 |
EPO (U/L) |
70 |
+0.341 |
0.004 |
Beta2m (mg/L) |
77 |
+0.026 |
0.822 |
p53s (U/mL) |
76 |
+0.041 |
0.723 |
TNF alpha (pg/mL) |
77 |
-0.064 |
0.580 |
IL6 (pg/mL) |
77 |
-0.165 |
0.153 |
IL1 beta (pg/mL) |
77 |
-0.038 |
0.742 |
CXCL8 (pg/mL) |
77 |
+0.212 |
0.174 |
CXCL9 (pg/mL) |
75 |
-0.261 |
0.024 |
BONE MARROW |
|||
Blast cells at diagnosis (%) |
77 |
+0.061 |
0.598 |
Red cell progenitors (%) |
77 |
-0.416 |
<0.001 |
Ringed sideroblasts (%) |
76 |
+0.040 |
0.730 |
IPSS-R cytogenetic score |
77 |
-0.045 |
0.695 |
Cellularity (%) |
77 |
+0.418 |
<0.001 |
p53 score |
77 |
+0.230 |
0.045 |
IPSS-R SCORE |
77 |
+0.062 |
0.594 |
BEJAR’S GENE SCORE |
70 |
+0.235 |
0.050 |
Targeted sequencing
After excluding sequencing errors and all known or possible single-nucleotide polymorphisms, a total of 202 variants were detected in all patients of which 164 were unique (full details are available online as Supplementary Information). These variants including 138 single nucleotide variants (SNV) and 26 insertions/deletions (15 insertions and 11 deletions) were called in 61 genes as somatic changes.
In total, 63 of the 70 patients (90%) whose DNA was of adequate quality harbored at least one mutation (Table 2) with a median of 3 (0-7) mutations per sample including 120 missense variants, 17 stop gained, 14 frameshift variants feature elongation, 9 frameshift variants feature truncation, 2 inframe deletions, 1 inframe insertion and 1 splice donor variant. The most common mutations were p.Lys700Glu in SF3B1 and p.Pro95His in SRSF2 observed in 9 patients each, one of them showing both mutations. The SF3B1 gene was the most frequently mutated in the cohort (27%) followed by TET2 (25.7%), RUNX1 (17.1%), SRSF2, and ASXL1 (15.7%). Less common mutations involved DNMT3A, ZRSR2 (10%), CSF3R, CSNK1A1, NOTCH1, KMT2A, SETBP1, STAG2, KRAS, and CREBBP, (Figure S1). CALR and JAK2 mutations were rare in our series (just 1 patient each) and also mutations on PDGFRA or PDGFRB were infrequent (3 and 1 patients, respectively).
Associations of mutations and pathways
Mutated genes were grouped into several functional pathways, which have been linked to MDS pathogenesis (Table S1). Amongst these, the most frequent target was RNA splicing, with mutations observed in 51.4% of cases, followed by signaling pathways (48.9%), DNA methylation (38.6%), chromatin modification (37%), transcription (31.4%), and cohesin complex (12.9%). Cohesin complex genes (CTCF, RAD21, SMC1A, SMC3 and STAG2) mutations were always mutually exclusive, and associated with mutations in KRAS (p = 0.006), ABL1 (p = 0.015) and ETV6 (p = 0.015) (Figure 1).
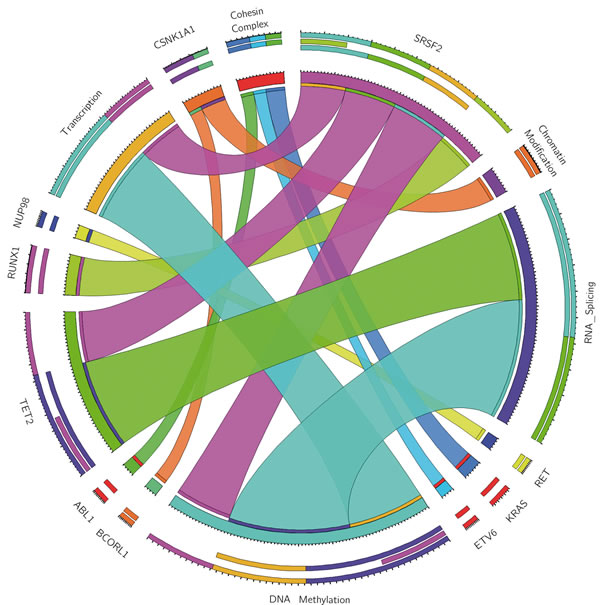
Figure 1: Circos plot of statistically significant associations among mutations in 70 MDS patients, grouped by functional pathways.
Clinico-biological correlates
Patients in the Poor/very poor IPSS-R score category had a higher number of mutations in genes involved in transcription regulation (p = 0.026, for trend), and those with a lower Schanz’s cytogenetic score [19] (Very Good/ good vs. Intermediate vs. Poor/very poor) had a higher number of mutations in chromatin modification pathway (p = 0.036, for trend). Interestingly, patients with MF grade 2 or higher showed a much higher prevalence of mutations in cohesin complex (35.7% vs. 5.4%; p = 0.006; Odds Ratio 9.8, CI95% 2.0-48.4). However, no associations between cohesin complex mutations and IPSS-R score, underlying cytogenetic abnormalities, WHO classification or other covariates were observed except for a lower proportion of red cell progenitors (24% vs. 33%, p = 0.043) and a higher number of packed red blood cells transfused in the first 16 weeks from diagnosis (p = 0.043) in mutated patients. Bone marrow fibrosis grade 2 or higher was observed in 17 (22.1%) patients. A comparison of the clinico-biological features of MDS with and without relevant bone marrow fibrosis (grade 2 or higher) is shown in as Table S2, panels A and B.
Table 2: Mutations observed in 70 MDS patients.
Gene |
No. of patients with var. (%) |
Total no. of variants (n=202) |
Gene |
No. of patients with var. (%) |
Total no. of variants (n=202) |
Gene |
No. of patients with var. (%) |
Total no. of variants (n=202) |
ABL1 |
2 (2.9) |
2 |
GCAT |
3 (4.3) |
3 |
RAD21 |
1 (1.4) |
1 |
ASXL1 |
11 (15.7) |
12 |
IDH1 |
1 (1.4) |
1 |
RARA |
1 (1.4) |
1 |
BCOR |
2 (2.9) |
2 |
IDH2 |
2 (2.9) |
2 |
RET |
2 (2.9) |
2 |
BCORL1 |
2 (2.9) |
2 |
IRF1 |
1 (1.4) |
1 |
RUNX1 |
12 (17.1) |
14 |
CALR |
1 (1.4) |
1 |
JAK1 |
1 (1.4) |
1 |
SETBP1 |
4 (5.7) |
4 |
CBLC |
1 (1.4) |
1 |
JAK2 |
1 (1.4) |
1 |
SF3A1 |
1 (1.4) |
1 |
CDH23 |
1 (1.4) |
1 |
KIT |
1 (1.4) |
1 |
SF3B1 |
19 (27.1) |
20 |
CDH3 |
2 (2.9) |
2 |
KMT2A |
4 (5.7) |
5 |
SMC1A |
2 (2.9) |
2 |
CREBBP |
4 (5.7) |
4 |
KRAS |
4 (5.7) |
4 |
SMC3 |
1 (1.4) |
1 |
CSF3R |
4 (5.7) |
4 |
MECOM |
1 (1.4) |
1 |
SRSF2 |
11 (15.7) |
11 |
CSNK1A1 |
4 (5.7) |
4 |
NF1 |
1 (1.4) |
1 |
STAG2 |
4 (5.7) |
4 |
CTCF |
1 (1.4) |
1 |
NOTCH1 |
4 (5.7) |
4 |
SUZ12 |
1 (1.4) |
1 |
CTNNA1 |
1 (1.4) |
1 |
NRAS |
1 (1.4) |
2 |
TET2 |
19 (27.1) |
25 |
CUX1 |
1 (1.4) |
1 |
NTRK1 |
2 (2.9) |
2 |
TIMM50 |
1 (1.4) |
1 |
DNMT3A |
7 (10) |
7 |
NUP98 |
2 (2.9) |
2 |
TNFAIP3 |
2 (2.9) |
2 |
ENG |
2 (2.9) |
2 |
PBRM1 |
1 (1.4) |
1 |
TP53 |
3 (4.3) |
4 |
EP300 |
2 (2.9) |
2 |
PDGFRA |
3 (4.3) |
3 |
U2AF1 |
3 (4.3) |
3 |
ETV6 |
2 (2.9) |
2 |
PDGFRB |
1 (1.4) |
1 |
UMODL1 |
3 (4.3) |
3 |
EZH2 |
3 (4.3) |
3 |
PHF6 |
1 (1.4) |
1 |
ZRSR2 |
7 (10) |
7 |
GATA1 |
1 (1.4) |
1 |
PHLPP1 |
1 (1.4) |
1 |
|||
GATA2 |
1 (1.4) |
1 |
PTPN11 |
1 (1.4) |
1 |
Bejar’s mutation score [14] takes into account mutations in 5 genes, namely TP53, EZH2, ETV6, RUNX1 and ASXL1, and patients with bone marrow fibrosis grade 2 or higher had higher Bejar’s scores (p = 0.006, Mann-Whitney), but not higher IPSS-R scores. By contrast, a statistically significant correlation between Bejar’s score and IPSS-R score was observed (Rho = 0.323; p = 0.006).
All three TP53mut cases showed a p53 protein immunohistochemical (IHC) score higher than 5 (median score 164) as well as more than 1% strongly reactive cells (median proportion 55%), whereas these features were present in only 15.2% and 9.1%, respectively, of the TP53wt cases.
Survival analysis showed that MF grade 2 or higher was a relevant predictor for overall survival (OS) (Figure 2) and independent of age, performance status (PS) and IPSS-R score in multivariate analysis (Table 3). By contrast, the presence of cohesin complex mutations and Bejar’s score did not show independent prognostic value for survival, when they were added to the previous model. Censoring for disease-modifying therapies did not change this fact (data not shown).
Table 3: Impact of MF on overall survival in MDS patients.
Overall Survival |
|||
Covariate |
Univariate |
Multivariate |
Multivariate |
p-value |
p-value |
HR (CI 95%) |
|
IPSS-R |
|||
(Very poor/Poor/Intermediate vs. other) |
<0.001 |
<0.001 |
3.50 (1.76-6.96) |
AGE |
|||
(Years) |
0.047 |
0.035 |
1.04 (1.01-1.07) |
PS (ECOG) |
|||
(0-4) |
0.013 |
0.006 |
1.61 (1.15-2.25) |
MYELOFIBROSIS GRADE |
|||
(MF-0/1 vs. MF-2/3) |
<0.001 |
0.002 |
3.21 (1.53-6.74) |
Bejar’s Gene Score for MDS |
|||
(High risk vs. other) |
0.019 |
0.079 |
1.75 (0.94-3.25) |
COHESIN COMPLEX MUTATIONS |
|||
(Any variation) |
<0.001 |
0.115 |
2.09 (0.84-5.20) |
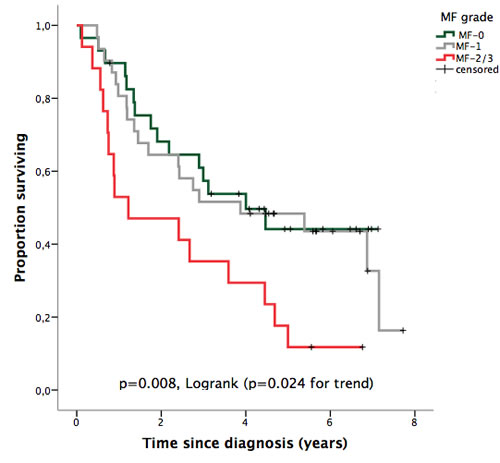
Figure 2: OS according to bone marrow fibrosis grade (European Consensus).
DISCUSSION
Bone marrow biopsy is a useful tool for the evaluation of MF in MDS, MDS/MPN [20, 21] and other overlapping MF syndromes [22]. Bone marrow reticulin staining predominates in the early stages of MF and it is mainly due to the deposition of hyaluronane [23]. The pathogenesis of this deposition is largely unknown.
MF has been proposed as a poor prognostic factor in both primary and therapy-related MDS [6-10, 12] and it has also been linked to delayed engraftment and worse survival after bone marrow transplantation [24]. However, it has been ruled out as an additive factor for predicting overall survival in MDS by the thorough retrospective analysis that gave rise to IPSS-R, probably, as the authors stated, as a consequence of “the low number of patients assessed for this feature (19%) as well as the variable ways the degree of fibrosis was reported from the different institutions in our study” [11]. Recently, the potential independent impact of MF in MDS has been put again into focus [12] and its genomic correlates have been described [25]. However, a multidimensional analysis including MF grade and mutational analysis has not been performed so far.
Our data show that MF grade is correlated with several cyto-histological and clinical parameters of bone marrow dysfunction in MDS patients as well as their overall survival. These multiple correlations suggest that fibrosis is not an epiphenomenon, but a condition linked to pathogenetic events taking place in MDS.
As communicated previously [26], fibrosis was more prominent when cellularity was very high and also when ALIP was present. Nevertheless, these covariates did not provide further independent prognostic information for OS when MF/2-3 was included in the Cox model (data not shown).
The presence of JAK2 mutations is common in MPN [27, 28] and is also frequent in cases with refractory anemia with ring sideroblasts associated with marked thrombocytosis (RARS-T) [29]. Nevertheless, it is not restricted to RARS-T cases since JAK2-mutated cases have been described in up to 5% of otherwise typical MDS cases [14, 15, 30]. CALR mutations are also common in PMF [17, 18] and have been described in up to 8% of otherwise typical MDS cases [18]. Finally, MPL mutations are found in 5% of PMF cases [18] and about the same proportion of typical MDS cases [15]. In our cohort, JAK2 and CALR mutations were rare (one case each), and we did not find any mutations in the MPL gene. No case of RARS-T was included in our series.
WT1 gene expression has been claimed to be a poor prognostic feature in MDS [31], but in our study, it did not provide independent prognostic information (data not shown), probably as a consequence of its correlation with the IPSS-R score. None of our patients had mutations of the WT1 gene.
The Cohesin complex is a proteic ring structure that has several cell functions including sister chromatid cohesion, DNA damage repair and RUNX1 transcription regulation [32]. Cohesin dysfunction underlies the so-called “cohesinopathies” such as Down’s syndrome, and cohesin mutations are not rare in myeloid diseases. They have been described in up to 15% of MDS patients and some of them (STAG2 and SMC1A) may have a prognostic impact on overall survival [15]. In this paper, we report for the first time a strikingly high prevalence of cohesin complex mutations in patients with MDS with fibrosis as compared with those patients without it. This finding requires confirmation in other patient series, but the prospective design is a particular strength of our study. It would have been very interesting to follow the MF grade of the 3 patients in our series that harbored cohesin mutations at diagnosis but did not show prominent MF at that time, but unfortunately that information was not available.
With respect to p53 protein tissue accumulation and TP53 gene mutations, both are frequent at diagnosis or during disease evolution in MDS patients with isolated deletion of 5q, as well as in those patients harboring high-risk cytogenetics and are associated with poor prognosis [14, 15, 33-44]. Elevated plasma levels of p53 soluble protein have been described in chronic lymphocytic leukemia, in which it may confer poor prognosis [45], but our data do not support such a role in MDS. We have observed that the p53 IHC score is positively correlated with the grade of MF, even despite the tiny proportion of TP53 mutations in our patients. This fact suggests that alternative mechanisms for p53 protein accumulation function in a small proportion of MDS cases (e.g. MDM2 protein degradation due to RPS14 haploinsuficiency in 5q deletion patients), which may be eventually detected by checking for the p53 IHC score. In contrast to recently reported findings [25] we did not observe a high prevalence of TP53 mutations in our MDS patients with fibrosis despite using FISH in cases with fewer than 20 metaphases available (as stated in GESMD guidelines): in fact, only 3 patients out of the 71 patients of the cohort had a TP53 mutation, of which two were MF-1 and one MF-2. Since none of our MF-2/3 patients had a Poor/very poor IPSS-R cytogenetic risk score, Loghavi’s [25] findings might be explained by the higher prevalence of Poor/very poor risk IPSS-R cytogenetic categories (24.2%) that was present in their series.
We have observed a negative correlation between bone marrow fibrosis grade and serum levels of the IFN-γ induced cytokines CXCL9 (an antifibrotic monokine secreted by macrophages) and CXCL10 (another monokine secreted by several cell types including by macrophages, endothelial cells and fibroblasts). Breakdown fragments of hyaluronan generated during tissue injury synergise with gamma-interferon for macrophage expression of CXCL9 via NF-kB [46]. Interestingly, both CXCL9 and CXCL10 but not CXCL8, exert their effects via chemokine receptor CXCR3, and CXCR3-deficient mice are known to develop progressive interstitial pulmonary fibrosis [47]. These findings suggest that CXCL9 and CXCL10 might be involved pathogenetically in the fibrosis of MDS, although their precise role needs to be better established by functional analyses.
In our study, the Bejar’s gene score correlated with both IPSS-R score and bone marrow fibrosis grade. This fact may account for its lack of independent prognostic value in our prospective cohort, in which both IPSS-R and bone marrow fibrosis were considered in the model. Cohesin complex mutations are neither correlated with IPSS-R score nor are they included in the Bejar’s score, but they did not have an independent prognostic role in our study.
In conclusion, bone marrow fibrosis changes observed in MDS patients are correlated with erythroid failure and p53 protein accumulation, but they are not linked to mutations in CALR/JAK2, cytogenetic score or IPSS-R and might be related to cohesin complex mutations. Bone marrow fibrosis grade 2 or higher, evaluated following the European Consensus, is a poor prognostic feature for OS, independently of IPSS-R, age or performance status, and might be as good a predictor as some current gene profiles.
materials and METHODS
Patients
The inception cohort comprised 200 primary MDS patients recruited prospectively at diagnosis in eight Spanish public hospitals, between June 2006 and October 2010. Among them, 77 patients had a bone marrow biopsy performed according to attending’s physician discretion and GESMD recommendations. Comorbidity was not a limitation for performing a bone marrow biopsy if considered important for a precise diagnosis. Patients provided written informed consent for the use of their samples and clinical data, after approval of the study by the Institutional Review Board of each study site. All the procedures followed were in accordance with the 2008 revision of the Helsinki Declaration of 1975. MDS diagnosis, classification and cytogenetic evaluation were done following the Standard Operating Procedures of the GESMD [48]. Clinical monitoring (diagnosis, general patient’s condition, PB sample evaluations, BM evaluations, treatment decisions, leukemic evolution and survival) was always performed at the participating hospitals by dedicated physicians affiliated to the GESMD. Prospective follow-up of the MDS findings observed at diagnosis was not part of the objective of this study and consequently they were not repeated at pre-defined intervals.
The main patient characteristics at diagnosis are shown in Table S3, panels A and B. Patients were followed until June 2014 (median follow-up 3 years, range 0.1-7.7 years) and stratified according to IPSS-R. Thirty patients (39.0%) received disease-modifying therapeutic strategies such as azacitidine (n = 20; followed by allogeneic bone marrow transplantation in two patients), intensive chemotherapy (n = 10; in 3 cases after azacitidine failure; followed by allogeneic bone marrow transplantation in six patients). Twenty out of the 77 patients (26.0%) progressed into acute myeloid leukemia, 49 (63.6%) died, two (2.6%) were lost to follow-up and 26 (33.8%) remained alive at the time of analysis.
Evaluation of fibrotic changes and P53 protein accumulation
MF was evaluated independently by two pathologists (F.M.I-G and D.S-V.) following European consensus guidelines [2]. Immunohistochemical accumulation of p53 protein [33, 34] was also evaluated in bone marrow biopsy samples as previously described by our group [35]. In short, the positivity (nuclear stain) for p53 in 500 cells was quantified by observing the bone marrow sections at 1000X magnification under a light microscope, including all visible cells in the count, regardless of whether they were parenchymal or stromal. The reactivity of individual cells was classified as negative (0 points), weakly positive (1 point) or strongly positive (2 points). An overall global score was calculated by adding up the values found for the 500 cells (minimum-maximum score, 0-1000 points). Strong IHC positivity was defined as a strong positive reaction in at least 1% of the observed cells [36]. The positive control was a bone marrow sample from a patient with a large-cell lymphoma that overexpressed p53.
Clinico-biological covariates
Besides clinical data needed to perform MDS diagnosis, WHO classification and IPSS-R stratification, we collected data on i) the so-called differentiating features of IPSS-R [11], namely age, performance status, levels of serum ferritin and beta2-microglobulin (beta2m), and serum lactate dehydrogenase (LDH) activity at diagnosis, ii) other useful predictors of overall survival in MDS such as transfusion dependence and hemoglobin levels [49, 50], serum erythropoietin (EPO) levels [51] and the expression of peripheral blood WT1 [52, 53], and iii) sp53 levels [45] and plasma levels of potentially relevant cytokines (TNF alpha, IL1beta, IL6) and chemokines (CXCL8/IL8, CXCL9/MIG and CXCL10IP10), which were also simultaneously determined in samples obtained at diagnosis. Plasma was processed in duplicate for sp53 determination at the coordinating centre using a commercially available biotin-conjugate/streptavidin-HRP ELISA kit (Bender MedSystems, Vienna, Austria) with a sensitivity of 0.33 U /mL. As a rule, healthy donors test negative for sp53. Cytokine/chemokine plasma levels were measured also in duplicate by using cytometric bead arrays (Becton-Dickinson, Franklin Lakes, NJ, USA), acquired on a FACScanto flow cytometer and analyzed with FCAP Array software (Becton-Dickinson, Franklin Lakes, NJ). WT1 gene expression was evaluated by RT-PCR in peripheral blood and calculated as the WT1/ GUS ratio as described elsewhere [52].
Mutational analysis
The mutational analysis by next-generation sequencing was carried out for the 70 (91%) patients whose DNA was of adequate quality (56 of these presented with MF-0/1, and 14 were MF-2/3) and performed in all cases from the peripheral blood leucocytes to avoid the eventual methodological limitations of a fibrotic bone marrow (“dry tap”). Genomic DNA (gDNA) was extracted and quantified using a Qubit DNA BR assay kit or HS assay kit (Life Technologies, Carlsbad, CA) and tested the adequate quality for the sequencing on MiSeq Illumina (San Diego, CA).
Library design
Target-capture sequencing on an Illumina platform (Illumina, San Diego, CA, USA) was performed across selected exons of 111 cancer-related genes previously related to MDS or IMF according to a Nextera sequencing design using Illumina DesignStudio (Illumina, San Diego, CA, USA) (Table 4).
Table 4: Panel of 111 genes included in the study.
ABL-1 |
CDH23 |
ETV6 |
JAK3 |
NTRK1 |
SALL4 |
TCL1B |
AEBP2 |
CDH3 |
EZH2 |
JARID2 |
NUP98 |
SBDS |
TERC |
ASXL1 |
CDK2 |
FBXW7 |
JKAMP |
PBRM1 |
SETBP1 |
TERT |
ATRX |
CDKN2A |
FLT3 |
KDM6A |
PDGFRA |
SETBP1 |
TET2 |
BCOR |
CEBPA |
GATA1 |
KIT |
PDGFRB |
SF1 |
TGM2 |
BCORL1 |
CREBBP |
GATA2 |
KRAS |
PHF19 |
SF3A1 |
TIMM50 |
BCR |
CSF3R |
GCCAT |
LUC7L2 |
PHF6 |
SF3B1 |
TNFAIP3 |
BMI1 |
CSNK1A1 |
GNAS |
MECOM |
PHLPP1 |
SFPQ |
TP53 |
BRAF |
CTCF |
HRAS |
MLL |
PTEN |
SH2B3 |
TYK2 |
CALR |
CTNNA1 |
IDH1 |
MLL2 |
PTPN1 |
SMC1A |
UA2F1 |
CBFb |
CUX1 |
IDH2 |
MPL |
PTPN11 |
SMC3 |
UMODL1 |
CBL |
DNMT3A |
IKZF1 |
mTOR |
RAD21 |
SPARC |
USB1 |
CBLB |
EED |
IL3 |
NF1 |
RARa |
SRSF2 |
WT |
CBLC |
EGFR |
IRF1 |
NOTCH1 |
RET |
STAG1 |
WT1 |
CD177 |
ENG |
JAK1 |
NPM1 |
RPS14 |
STAG2 |
ZRSR2 |
CDH13 |
EP300 |
JAK2 |
NRAS |
RUNX1 |
SUZ12 |
DNA sequencing
The genomic library was prepared using 50 ng of gDNA template and was sequenced following Illumina’s standardized protocol (Illumina). Briefly, the amplified libraries were purified using AMPure magnetic beads (Agencourt, Brea, CA), quantified and pooled in equimolar amounts. The pool was loaded at 9 pM on one MiSeq flow cell and then subjected to NGS using a MiSeq sequencer (Illumina). The sequencing was performed sequentially from both ends each for 151 cycles. An additional eight cycles were used to read the index.
A minimum quality score of Q30 (corresponding to a 1:1000 error rate) was required for a minimum of 90% of bases sequenced ensuring high-quality sequencing results and runs failing these metrics were excluded. The mean unique depth of coverage across the capture region was 566 and the number of capture regions was 1661 with a 475805 bases sequencing. Obtained sequences were aligned to the reference genome (GRCh37/hg19) using MiSeq Reporter software (Illumina), which detected discrepancies determining their type, such as deletions, insertions and SNPs. To visualize read alignment and confirm the variant calls, Integrative Genomics Viewer version 2.3.26 (IGV, Broad Institute, MA) was used. For reporting, a sequencing coverage of > 100X (bi-directional true paired-end sequencing), a quality of 100, and a variant frequency of 2% were used as cut-offs. To annotate sequence variant, Illumina Variant Studio 2.2 software was used.
Synonymous variants, noncoding variants, or germline polymorphisms present in database of normal genomes (including dbSNP138, the 1000 genomes project, and our in-house database) at a population frequency (MAF) > = 1% were discarded. The variants that were recurrently observed in our cohort and suspected of being sequencing errors by visual inspection on the IGV browser were removed. Among those, missense SNVs whose variant allele frequencies were 45-55 and all the known hotspot mutations were considered somatic mutations. However the variants described in the Catalogue of Somatic Mutations in Cancer database (COSMIC database) were rescued. In order to elucidate the effects of the different variants with no clear clinical significance, we used the PolyPhen-2 and SIFT web-based platforms and the mutations with deleterious and/or probably damaging were also rescued as somatic mutations (15). The remaining variants were considered candidate somatic mutations. All the mutations were confirmed either by resequencing in an amplicon-based approach (GS Junior Roche 454 for mutations present in <20% ) or by Sanger (in mutations observed in more than 20%).
High quality of runs was confirmed by Q30 values > 90% and 151 bidirectional cycles were performed, yielding between seven to ten Gigabases of sequencing data. Overall median coverage was 475 reads (range 120-1083 reads). The mean depth of the targeted sequencing study in 111 genes was 456 reads across the entire cohort (n = 70).
All assays were performed blinded to the study end points, by technicians who were not involved in patient management and who were unaware of their evolution.
Sample size considerations and statistical analysis
The sample size estimate was based on the final maximal number of predictors that would be of practical interest for an eventual prognostic model in daily practice: an international prognostic scoring system, patient’s age, a measure of patient’s general condition, two peripheral blood findings and a pathological finding not included in current scoring systems. That makes a maximum of predictors to be included in the final multivariate model. At least 10 patients per final predictor was considered appropriate for multivariate analysis.
Continuous and ordinal variables were summarized by their median and interquartile range and Mann-Whitney’s test was used to analyze differences in their mean rank. Categorical variables were described by counts and relative frequencies, and Fisher’s exact test was used to analyze differences in the distribution of them between patient subsets. Nonparametric correlation between covariates of interest was analyzed and calculated by means of Spearman’s Rho. Whenever possible, covariates were dichotomized according to clinically relevant cut-offs (upper limit of normal range for LDH, ferritin > 500 ng/mL, beta2m > 3 mg/L, EPO > 150 U/L). In those cases in which that was not possible (sp53, WT1 gene expression, cytokine levels), cut-off values based on data distribution were chosen. Co-mutations among genes of interest are depicted by means of Circos plots.
Overall survival was defined as the time from diagnosis to death (as a result of all causes), last follow-up or study closing date and was plotted using the Kaplan-Meier product-limit method. The log-rank test was used to check the association between categorical predictors and overall survival. Multivariate analysis of factors influencing overall survival was performed by Cox proportional hazards regression analysis. P-values of less than 0.05 were considered to indicate statistical significance. All p-values presented are two-sided. Statistical analyses were performed using SPSS release 20.0 (SPSS Inc., Chicago, IL).
ACKNOWLEDGMENTS
We acknowledge the support of the PETHEMA Foundation for the activities of the Spanish Group for Myelodysplastic Syndromes (GESMD).
CONFLICTS OF INTEREST
The sponsors were not involved in study design, collection, analysis and interpretation of data, in the writing of the report or in the decision to submit the report for publication. The authors have declared no conflicts of interest.
GRANT SUPPORT
This work was partially supported by research funding from Celgene S.L., Madrid, Spain, by the Fundación Española de Hematología y Hemoterapia (FEHH) (MDR) and by grants (RD12/0036/0069 and RD12/0036/0044) from the Red Temática de Investigación Cooperativa en Cáncer (RTICC), Instituto de Salud Carlos III (ISCIII), Spanish Ministry of Economy and Competitiveness and the European Regional Development Fund (ERDF) “Una manera de hacer Europa”; Junta de Castilla y León (GRS 994/A/14, BIO/SA47/13 and GRS 1033/A/14). The research leading to these results has received funding from the European Union Seventh Framework Programme [FP7/2007-2013] under Grant Agreement no. 306242-NGS-PTL.
Editorial note
This paper has been accepted based in part on peer-review conducted by another journal and the authors’ response and revisions as well as expedited peer-review in Oncotarget.
REFERENCES
1. Frisch B and Bartl R. Myelofibrosis and osteomyelosclerosis and other fibroses in the bone marrow, In Frisch B and Bartl R. Biopsy interpretation of bone and bone marrow: Histology and immunohistology in paraffin and plastic. Arnold Publishers: London, 1999; 244-256.
2. Thiele J, Kvasnicka HM, Facchetti F, Franco V, van der Walt J and Orazi A. European consensus on grading bone marrow fibrosis and assessment of cellularity. Haematologica. 2005; 90: 1128-1132.
3. Swerdlow SH, Campo E, Harris NL, Jaffe ES, Pileri SA, Stein H, Thiele J and Vardiman JW, editors. WHO classification of tumours of haematopoietic and lymphoid tissue. Lyon: IARC, 2008.
4. Pagliuca A, Layton DM, Manoharan A, Gordon S, Green PJ and Mufti GJ. Myelofibrosis in primary myelodysplastic syndromes: a clinico-morphological study of 10 cases. Br J Haematol. 1989; 71: 499-504.
5. Lambertenghi-Deliliers G, Orazi A, Luksch R, Annaloro C and Soligo D. Myelodysplastic syndrome with increased marrow fibrosis: a distinct clinico-pathological entity. Br J Haematol. 1991; 78: 161-166.
6. Maschek H, Georgii A, Kaloutsi V, Werner M, Bandecar K, Kressel MG, Choritz H, Freund M and Hufnagl D. Myelofibrosis in primary myelodysplastic syndromes: a retrospective study of 352 patients. Eur J Haematol. 1992; 48: 208-214.
7. Marisavljević D, Rolović Z, Cemerikić V, Bosković D and Colović M. Myelofibrosis in primary myelodysplastic syndromes: clinical and biological significance. Med Oncol. 2004; 21: 325-331.
8. Buesche G, Teoman H, Wilczak W, Ganser A, Hecker H, Wilkens L, Göhring G, Schlegelberger B, Bock O, Georgii A and Kreipe H. Marrow fibrosis predicts early fatal marrow failure in patients with myelodysplastic syndromes. Leukemia. 2008; 22: 313-322.
9. Fu B, Ok CY, Goswami M, Xei W, Jaso JM, Muzzafar T, Bueso-Ramos C, Verstovsek S, Garcia-Manero G, Medeiros LJ and Wang SA. The clinical importance of moderate/severe bone marrow fibrosis in patients with therapy-related myelodysplastic syndromes. Ann Hematol. 2013; 92: 1335-1343.
10. Della Porta MG, Malcovati L, Boveri E, Travaglino E, Pietra D, Pascutto C, Passamonti F, Invernizzi R, Castello A, Magrini U, Lazzarino M and Cazzola M. Clinical relevance of bone marrow fibrosis and CD34-positive cell clusters in primary myelodysplastic syndromes. J Clin Oncol. 2009; 27: 754-762.
11. Greenberg PL, Tuechler H, Schanz J, Sanz G, Garcia-Manero G, Solé F, Bennett JM, Bowen D, Fenaux P, Dreyfus F, Kantarjian H, Kuendgen A, Levis A et al. Revised international prognostic scoring system for myelodysplastic syndromes. Blood. 2012; 120: 2454-2465.
12. Fu B, Jaso JM, Sargent RL, Goswami M, Verstovsek S, Medeiros LJ and Wang SA. Bone marrow fibrosis in patients with primary myelodysplastic syndromes has prognostic value using current therapies and new risk stratification systems. Mod Pathol. 2014; 27: 681-689.
13. Nangalia J and Green TR. The evolving genomic landscape of myeloproliferative neoplasms. Hematology Am Soc Hematol Educ Program. 2014; 1: 287-296.
14. Bejar R, Stevenson K, Abdel-Wahab O, Galili N, Nilsson B, Garcia-Manero G, Kantarjian H, Raza A, Levine RL, Neuberg D and Ebert BL. Clinical effect of point mutations in myelodysplastic syndromes. N Engl J Med. 2011; 364: 2496-2506.
15. Haferlach T, Nagata Y, Grossmann V, Okuno Y, Bacher U, Nagae G, Schnittger S, Sanada M, Kon A, Alpermann T, Yoshida K, Roller A, Nadarajah N et al. Landscape of genetic lesions in 944 patients with myelodysplastic syndromes. Leukemia. 2014; 28: 241-247.
16. Zhang L, Padron E and Lancet J. The molecular basis and clinical significance of genetic mutations identified in myelodysplastic syndromes. Leuk Res. 2015; 39: 6-17.
17. Klampfl T, Gisslinger H, Harutyunyan AS, Nivarthi H, Rumi E, Milosevic JD, Them NC, Berg T, Gisslinger B, Pietra D, Chen D, Vladimer GI, Bagienski K et al. Somatic mutations of calreticulin in myeloproliferative neoplasms. N Engl J Med. 2013; 369: 2379-2390.
18. Nangalia J, Massie CE, Baxter EJ, Nice FL, Gundem G, Wedge DC, Avezov E, Li J, Kollmann K, Kent DG, Aziz A, Godfrey AL, Hinton J et al. Somatic CALR mutations in myeloproliferative neoplasms with nonmutated JAK2. N Engl J Med. 2013; 369: 2391-2405.
19. Schanz J, Tüchler H, Solé F, Mallo M, Luño E, Cervera J, Granada I, Hildebrandt B, Slovak ML, Ohyashiki K, Steidl C, Fonatsch C, Pfeilstöcker M et al. New comprehensive cytogenetic scoring system for primary myelodysplastic syndromes (MDS) and oligoblastic acute myeloid leukemia after MDS derived from an international database merge. J Clin Oncol. 2012; 30: 820-829.
20. Orazi A. Histopathology in the diagnosis and classification of acute myeloid leukemia, myelodysplastic syndromes, and myelodysplastic/myeloproliferative diseases. Pathobiology. 2007; 74: 97-114.
21. Lambertenghi-Deliliers G, Annaloro C, Oriani A, Soligo D, Pozzoli E and Polli EE. Prognostic relevance of histological findings on bone marrow biopsy in myelodysplastic syndromes. Ann Hematol. 1993; 66: 85-91.
22. Bae E, Park CJ, Cho YU, Seo EJ, Chi HS, Jang S, Lee KH, Lee JH, Lee JH, Suh JJ and Im HJ. Differential diagnosis of myelofibrosis based on WHO 2008 criteria: acute panmyelosis with myelofibrosis, acute megakaryoblastic leukemia with myelofibrosis, primary myelofibrosis and myelodysplastic syndrome with myelofibrosis. Int J Lab Hematol. 2013; 35: 629-636.
23. Sundström G, Hultdin M, Engström-Laurent A and Dahl IM. Bone marrow hyaluronan and reticulin in patients with malignant disorders. Med Oncol. 2010; 27: 618-623.
24. Scott BL, Storer BE, Greene JE, Hackman RC, Appelbaum FR and Deeg HJ. Marrow fibrosis as a risk factor for posttransplantation outcome in patients with advanced myelodysplastic syndrome or acute myeloid leukemia with multilineage dysplasia. Biol Blood Marrow Transplant. 2007; 13: 345-354.
25. Loghavi S, Al-Ibraheemi A, Zuo Z, Garcia-Manero G, Yabe M, Wang SA, Kantarjian HM, Yin CC, Miranda RN, Luthra R, Medeiros LJ, Bueso-Ramos CE and Khoury JD. TP53 overexpression is an independent adverse prognostic factor in de novo myelodysplastic syndromes with fibrosis. Br J Haematol. 2015; 171: 91-99.
26. Schemenau J, Baldus S, Anlauf M, Reinecke P, Braunstein S, Blum S, Nachtkamp K, Neukirchen J, Strup C, Aul C, Haas R, Gattermann N and Germing U. Cellularity, characteristics of hematopoietic parameters and prognosis in myelodysplastic syndromes. Eur J Haematol. 2015; 95: 181-9.
27. Kralovics R, Passamonti F, Buser AS, Teo SS, Tiedt R, Passweg JR, Tichelli A, Cazzola M and Skoda RC. A gain-of-function mutation of JAK2 in myeloproliferative disorders. N Engl J Med. 2005; 352: 1779-1790.
28. Baxter EJ, Scott LM, Campbell PJ, East C, Fourouclas N, Swanton S, Vassiliou GS, Bench AJ, Boyd EM, Curtin N, Scott MA, Erber WN and Green AR; Cancer Genome Project. Acquired mutation of the tyrosine kinase JAK2 in human myeloproliferative disorders. Lancet. 2005; 365: 1054-1061.
29. Broseus J, Florensa L, Zipperer E, Schnittger S, Malcovati L, Richebourg S, Lippert E, Cermak J, Evans J, Mounier M, Raya JM, Bailly F, Gattermann N et al. Clinical features and course of refractory anemia with ring sideroblasts associated with marked thrombocytosis. Haematologica. 2012; 97: 1036-1041.
30. De Renzis B, Mansat-De Mas V, Wattel E, Beyne-Rauzy O, Knoops L, Cabrespine A, Azgui Z, Ades L, Kiladjian JJ and Fenaux P; Groupe Francophone des Myelodysplasies (GFM), French Intergroup of Myeloproliferative disorders (FIM). Prognostic impact of JAK2V617F mutation in myelodysplatic syndromes: A matched case control study. Leuk Res Rep. 2013; 2: 64-66.
31. Cilloni D, Gottardi E, Messa F, Fava M, Scaravaglio P, Bertini M, Girotto M, Marinone C, Ferrero D, Gallamini A, Levis A and Saglio G; Piedmont Study Group on Myelodysplastic Syndromes. Significant correlation between the degree of WT1 expression and the International Prognostic Scoring System Score in patients with myelodysplastic syndromes. J Clin Oncol. 2003; 21: 1988-1995.
32. Leeke B, Marsman J, O’Sullivan JM and Horsfield JA. Cohesin mutations in myeloid malignancies: underlying mechanisms. Exp Hematol Oncol. 2014; 3: 13. doi:10.1186/2162-3619-3-13.
33. Kitagawa M, Yoshida S, Kuwata T, Tanizawa T and Kamiyama R. p53 expression in myeloid cells of myelodysplastic syndromes. Association with evolution of overt leukemia. Am J Pathol. 1994; 145: 338-344.
34. Orazi A, Kahsai K, John K and Neiman RS. P53 overexpression in myeloid leukemic disorders is associated with increased apoptosis of hematopoietic marrow cells and ineffective hematopoiesis. Mod Pathol. 1996; 9: 48-52.
35. Ramos F, Fuertes-Núñez M, Suárez-Vilela D and Fernández-López A. What does apoptosis have to do with clinical features in myelodysplastic syndrome? Haematologica. 2002; 87: 381-391.
36. Saft L, Karimi M, Ghaderi M, Matolcsy A, Mufti GJ, Kulasekararaj A, Göhring G, Giagounidis A, Selleslag D, Muus P, Sanz G, Mittelman M, Bowen D et al. p53 protein expression independently predicts outcome in patients with lower-risk myelodysplastic syndromes with del(5q). Haematologica. 2014; 99: 1041-1049.
37. Sugimoto K, Hirano N, Toyoshima H, Chiba S, Mano H, Takaku F, Yazaki Y and Hirai H. Mutations of the p53 gene in myelodysplastic syndrome (MDS) and MDS-derived leukemia. Blood. 1993; 81: 3022-3026.
38. Mori N, Hidai H, Yokota J, Okada M, Motoji T, Oshimi K and Mizoguchi H. Mutations of the p53 gene in myelodysplastic syndrome and overt leukemia. Leuk Res. 1995; 19: 869-875.
39. Kita-Sasai Y, Horiike S, Misawa S, Kaneko H, Kobayashi M, Nakao M, Nakagawa H, Fujii H and Taniwaki M. International prognostic scoring system and TP53 mutations are independent prognostic indicators for patients with myelodysplastic syndrome. Br J Haematol. 2001; 115: 309-312.
40. Kikukawa M, Aoki N, Sakamoto Y and Mayumi M. Study of p53 in elderly patients with myelodysplastic syndromes by immunohistochemistry and DNA analysis. Am J Pathol. 1999; 155: 717-721.
41. Jädersten M, Saft L, Pellagatti A, Göhring G, Wainscoat JS, Boultwood J, Porwit A, Schlegelberger B and Hellström-Lindberg E. Clonal heterogeneity in the 5q- syndrome: p53 expressing progenitors prevail during lenalidomide treatment and expand at disease progression. Haematologica. 2009; 94: 1762-1766.
42. Jädersten M, Saft L, Smith A, Kulasekararaj A, Pomplun S, Göhring G, Hedlund A, Hast R, Schlegelberger B, Porwit A, Hellström-Lindberg E and Mufti GJ. TP53 mutations in low-risk myelodysplastic syndromes with del(5q) predict disease progression. J Clin Oncol. 2011; 29: 1971-1979.
43. Kulasekararaj AG, Smith AE, Mian SA, Mohamedali AM, Krishnamurthy P, Lea NC, Gäken J, Pennaneach C, Ireland R, Czepulkowski B, Pomplun S, Marsh JC and Mufti GJ. TP53 mutations in myelodysplastic syndrome are strongly correlated with aberrations of chromosome 5, and correlate with adverse prognosis. Br J Haematol. 2013; 160: 660-672.
44. Volkert S, Kohlmann A, Schnittger S, Kern W, Haferlach T and Haferlach C. Association of the type of 5q loss with complex karyotype, clonal evolution, TP53 mutation status, and prognosis in acute myeloid leukemia and myelodysplastic syndrome. Genes Chromosomes Cancer. 2014; 53: 402-410.
45. Del Principe MI, Del Poeta G, Venditti A, Buccisano F, Maurillo L, Marini R, Cox MC, Panetta P, Suppo G, Degan M, Bruno A, Gattei V, Amadori S. Clinical significance of soluble p53 protein in B-cell chronic lymphocytic leukemia. Haematologica. 2004; 89: 1468-1475.
46. Horton MR, Boodoo S and Powell JD. NF-kappa B activation mediates the cross-talk between extracellular matrix and interferon-gamma (IFN-gamma) leading to enhanced monokine induced by IFN-gamma (MIG) expression in macrophages. J Biol Chem. 2002; 277: 43757-43762.
47. Jiang D, Liang J, Hodge J, Lu B, Zhu Z, Yu S, Fan J, Gao Y, Yin Z, Homer R, Gerard C and Noble PW. Regulation of pulmonary fibrosis by chemokine receptor CXCR3. J Clin Invest. 2004; 114: 291-299.
48. Spanish Group for Myelodysplastic Syndromes (GESMD). Spanish Society of Haematology and Haemotherapy (SEHH). Spanish guidelines for the diagnosis and treatment of myelodysplastic syndromes and chronic myelomonocytic leukaemia. Haematologica (Spanish edition). 2012; 97: 6-10.
49. Malcovati L, Germing U, Kuendgen A, Della Porta MG, Pascutto C, Invernizzi R, Giagounidis A, Hildebrandt B, Bernasconi P, Knipp S, Strupp C, Lazzarino M, Aul C et al. Time-dependent prognostic scoring system for predicting survival and leukemic evolution in myelodysplastic syndromes. J Clin Oncol. 2007; 25: 3503-3510.
50. Malcovati L, Della Porta MG, Strupp C, Ambaglio I, Kuendgen A, Nachtkamp K, Travaglino E, Invernizzi R, Pascutto C, Lazzarino M, Germing U and Cazzola M. Impact of the degree of anaemia on the outcome of patients with myelodysplastic syndrome and its integration into the WHO classification-based Prognostic Scoring System (WPSS). Haematologica. 2011; 96: 1433-1440.
51. Wallvik J, Stenke L, Bernell P, Nordahl G, Hippe E and Hast R. Serum erythropoietin (EPO) levels correlate with survival and independently predict response to EPO treatment in patients with myelodysplastic syndromes. Eur J Haematol. 2002; 68: 180-185.
52. Tamaki H, Ogawa H, Ohyashiki K, Ohyashiki JH, Iwama H, Inoue K, Soma T, Oka Y, Tatekawa T, Oji Y, Tsuboi A, Kim EH, Kawakami M et al. The Wilms’ tumor gene is a good marker for diagnosis of disease progression of myelodysplastic syndromes. Leukemia. 1999; 13; 393-399.
53. Barragán E, Cervera J, Bolufer P, Ballester S, Martín G, Fernández P, Collado R, Sayas MJ and Sanz MA. Prognostic implications of Wilms’ tumor gene (WT1) expression in patients with de novo acute myeloid leukemia. Haematologica. 2004; 89: 926-933.