
INTRODUCTION
Bevacizumab (Bev) is a humanized monoclonal antibody with antiangiogenic activity that binds to the vascular endothelial growth factor (VEGF), leading to the inhibition of the circulating ligand and to the prevention of receptor activation [1]. The use of Bev combined with fluoropyrimidine-based chemotherapy (CT) is considered standard first-and second-line treatment for patients with metastatic colorectal cancer (mCRC).
Validated predictors of sensitivity or resistance to Bev are still not available, notwithstanding several studies have investigated this issue in recent years. The majority of these studies focused on the VEGF pathway, including tumor VEGF expression, whereas less attention was paid to the tumor microenvironment and inflammatory response [2].
It has increasingly been recognized that tumor infiltrating inflammatory cells are responsible for producing inflammatory mediators and cytokines that induce angiogenesis, tumor growth, invasion and metastasis [3-5]. Accordingly, serum white blood cells, neutrophils, lymphocytes, platelets and acute-phase proteins, such as C-reactive protein and albumin, have been evaluated in different malignancies and found to predict for prognosis and response to treatment [6-9]. Moreover, inflammatory indexes (II) obtained with different combinations of these factors, such as neutrophil-to-lymphocyte ratio (NLR) and platelet-lymphocyte ratio (PLR), have been reported to be useful prognostic factors in various malignant solid tumors, including CRC [10-18]. The systemic immune-inflammation index (SII) was recently investigated as a prognostic marker in several malignancies including renal cell carcinoma, small cell lung cancer and hepatocellular carcinoma [19-22].
In light of the close relationship that has emerged between inflammation and angiogenesis, considerable interest has been aroused in the role of II as predictors of the efficacy of Bev [23]. If validated, these parameters could represent a reproducible, inexpensive and easy method to select candidates for treatment with Bev.
We investigated the prognostic and predictive role of baseline II (SII, NLR and PLR) in mCRC patients treated with first-line CT with or without Bev in the phase III prospective multicenter randomized ITACa (Italian Trial in Advanced Colorectal Cancer) trial (EudraCT no. 2007-004539-44 and on ClinicalTrials.gov (NCT01878422) [24].
RESULTS
Patient population
Information on pre-treatment II levels was available for 289 of the 370 patients from the ITACa intention-to-treat population; 145 and 144 had low and high SII values, 168 and 121 had low and high NLR values, and 144 and 145 had low and high PLR values, respectively. Baseline characteristics of patients are shown in Table 1. Patients, divided into groups on the basis of marker cut-offs, were all comparable for age, gender, tumor localization, CT regimen, KRAS status and treatment arm. A higher proportion of patients with high II had a performance status (PS) of 1-2, the high SII and PLR groups included more stage IV tumors at diagnosis, and the high PLR groups had higher grade-tumors.
Table 1: Baseline patient characteristics (n = 289)
Patient characteristics |
NLR |
p |
PLR |
p |
SII |
p |
|||
|---|---|---|---|---|---|---|---|---|---|
<3 |
≥3 |
<169 |
≥169 |
<730 |
≥730 |
||||
n (%) |
n (%) |
n (%) |
n (%) |
n (%) |
n (%) |
||||
Median age, years (range) |
65 (33-83) |
66 (34-81) |
.662 |
66 (33-83) |
65 (34-81) |
.777 |
66 (33-83) |
65 (34-81) |
.351 |
Gender |
|||||||||
Male |
103 (61.3) |
71 (58.7) |
84 (62.2) |
90 (58.4) |
85 (58.6) |
89 (61.8) |
|||
Female |
65 (38.7) |
50 (41.3) |
.653 |
51 (37.8) |
64 (41.6) |
.593 |
60 (41.4) |
55 (38.2) |
.665 |
Performance Status ECOG |
|||||||||
0 |
148 (88.1) |
82 (67.8) |
118 (87.4) |
112 (72.7) |
127 (87.6) |
103 (71.5) |
|||
1-2 |
20 (11.9) |
39 (32.2) |
< .0001 |
17 (12.6) |
42 (27.3) |
.002 |
18 (12.4) |
41 (28.5) |
.0007 |
Tumor localisation |
|||||||||
Rectum |
41 (24.4) |
36 (29.7) |
33 (24.4) |
44 (28.6) |
39 (26.9) |
38 (26.4) |
|||
Colon |
127 (75.6) |
85 (70.3) |
.379 |
102 (75.6) |
110 (71.4) |
.429 |
106 (73.1) |
106 (73.6) |
.922 |
Stage at diagnosis |
|||||||||
I-III |
44 (27.8) |
25 (21.2) |
40 (31.0) |
29 (19.7) |
43 (31.6) |
26 (18.6) |
|||
IV |
114 (72.2) |
93 (78.8) |
.261 |
89 (69.0) |
118 (80.3) |
.031 |
93 (68.4) |
114 (81.4) |
.012 |
Grade |
|||||||||
1 |
9 (6.7) |
4 (4.4) |
9 (7.9) |
4 (3.6) |
7 (5.7) |
6 (5.8) |
|||
2 |
92 (68.1) |
51 (56.0) |
78 (68.4) |
65 (58.0) |
82 (66.7) |
61 (59.2) |
|||
3 |
34 (25.2) |
36 (39.6) |
0.068 |
27 (23.7) |
43 (38.4) |
0.034 |
34 (27.6) |
36 (34.9) |
0.482 |
CT regimen |
|||||||||
FOLFOX4 |
107 (63.7) |
72 (59.5) |
77 (57.0) |
102 (66.2) |
92 (63.4) |
87 (60.4) |
|||
FOLFIRI |
61 (36.3) |
49 (40.5) |
.548 |
58 (43.0) |
52 (33.8) |
.109 |
53 (36.6) |
57 (39.6) |
.596 |
KRAS statusa |
|||||||||
Wild type |
96 (61.2) |
56 (56.0) |
72 (59.0) |
80 (59.3) |
76 (57.1) |
76 (61.3) |
|||
Mutated |
61 (38.8) |
44 (44.0) |
.491 |
50 (41.0) |
55 (40.7) |
.968 |
57 (42.9) |
48 (38.7) |
.500 |
ITACa treatment |
|||||||||
CT+B |
86 (51.2) |
55 (45.5) |
67 (49.6) |
74 (48.1) |
75 (51.7) |
66 (45.8) |
|||
CT |
82 (48.8) |
66 (54.5) |
.399 |
68 (50.4) |
80 (51.9) |
.789 |
70 (48.3) |
78 (54.2) |
.317 |
aMandatory as consequence of amendment n. 1 of 3 May, 2009.
Abbreviations: NRL, neutrophil-to-lymphocyte ratio; PLR, platelet-lymphocyte ratio; SII, systemic immune-inflammation index; ECOG, Eastern Cooperative Oncology Group; ITACa, Italian Trial in Advanced Colorectal Cancer; CT, chemotherapy; B, bevacizumab; n, number.
Prognostic value of patient characteristics and II
Among patient characteristics, univariate analysis showed that PS was the only variable with a significant impact on survival. Patients with PS = 0 had higher median PFS (9.7 vs. 6.8 months; HR = 1.60, 95% CI 1.20-2.15; p = .001) and OS (24.8 vs. 13.7 months; HR = 2.60, 95% CI 1.90-3.56; p < .0001) than those with PS =1-2. No other characteristics correlated with survival (Supplementary Table S1, available online only). Patients with high NLR had a lower median PFS (7.8 vs. 10.2 months, p = .0001) and lower median OS (16.8 vs. 25.2 months, p < .0001) than those with low NLR. Patients with high PLR had a lower median PFS (8.3 vs. 10.2 months, p = .004) and lower median OS (19.0 vs. 25.2 months, p = .008) than those with high PLR. Patients with high SII levels had a lower median PFS (8.3 vs. 10.1 months, p < .015) and lower median OS (19.0 vs. 25.4 months, p = .002) than those with low SII (Table 2).
Table 2: Prognostic value of II in the overall population
No. patients |
PFS |
HR (95%CI)a |
p |
OS |
HR (95% CI)a |
p |
|||||
|---|---|---|---|---|---|---|---|---|---|---|---|
No. events |
Median PFS (months) (95% CI) |
p |
No. events |
Median OS (months) (95% CI) |
p |
||||||
Overall |
289 |
270 |
9.1 (8.4-9.8) |
- |
- |
- |
228 |
21.3 (19.7-24.5) |
- |
- |
- |
NLR <3 |
168 |
155 |
10.2 (9.1-11.3) |
1.00 |
127 |
25.4 (21.8-31.6) |
1.00 |
||||
≥3 |
121 |
115 |
7.8 (6.3-8.9) |
0.0001 |
1.58 (1.21-2.07) |
0.0009 |
101 |
16.8 (13.7-19.9) |
<0 .0001 |
1.68 (1.25-2.27) |
0.0006 |
PLR <169 |
144 |
132 |
10.2 (9.1-11.3) |
1.00 |
111 |
25.2 (21.3-29.2) |
1.00 |
||||
≥169 |
145 |
138 |
8.3 (6.9-9.0) |
0.004 |
1.42 (1.09-1.85) |
0.008 |
117 |
19.0 (16.2-21.4) |
0.008 |
1.50 (1.13-2.00) |
0.006 |
SII <730 |
145 |
134 |
10.1 (9.0-10.9) |
1.00 |
110 |
25.4 (21.6-29.9) |
1.00 |
||||
≥730 |
144 |
136 |
8.3 (6.9-9.1) |
0.015 |
1.16 (0.89-1.49) |
0.265 |
118 |
19.0 (16.2-20.9) |
0.002 |
1.37 (1.03-1.82) |
0.030 |
aadjusted by ITACa treatment, center, CT regimen, KRAS status and baseline characteristics.
Abbreviations: NRL, neutrophil-to-lymphocyte ratio; PLR, platelet-lymphocyte ratio; SII, systemic immune-inflammation index; PFS, progression-free survival; OS, overall survival; HR, hazard ratio; CI, confidence interval.
In multivariable analysis, a backward elimination approach confirmed NLR, tumor localization and PS as independent predictors of PFS (p = .001, .064 and .010, respectively) and OS (p < .0001, .006 and < .0001, respectively) (Table 3).
Table 3: Multivariable analysis of PFS and OS
PFS |
OS |
|||
|---|---|---|---|---|
HR (95%CI) |
p |
HR (95% CI) |
p |
|
NLR (≥3 vs. <3) |
1.52 (1.07-2.17) |
0.020 |
1.78 (1.17-2.70) |
0.007 |
PLR (≥169 vs. <169) |
1.38 (0.99-1.91) |
0.051 |
1.27 (0.89-1.80) |
0.186 |
SII (≥730 vs. <730) |
0.79 (0.53-1.16) |
0.226 |
0.84 (0.53-1.31) |
0.433 |
Gender (male vs. female) |
0.97 (0.76-1.25) |
0.827 |
1.04 (0.79-1.37) |
0.767 |
ECOG PS (1-2 vs. 0) |
1.47 (1.09-1.99) |
0.012 |
2.52 (1.82-3.48) |
<0.0001 |
Tumor localization (colon vs. rectum) |
1.34 (1.01-1.77) |
0.042 |
1.58 (1.16-2.16) |
0.004 |
CT regimen (FOLFIRI vs. FOLFOX4) |
1.26 (0.98-1.63) |
0.076 |
1.23 (0.94-1.63) |
0.135 |
KRAS status (mutated vs. wild type) |
0.98 (0.76-1.26) |
0.891 |
1.07 (0.81-1.41) |
0.635 |
ITACa treatment (CT+B vs. CT) |
0.84 (0.66-1.07) |
0.162 |
1.28 (0.98-1.67) |
0.070 |
After backward procedure: |
||||
NLR (≥3 vs. <3) |
1.51 (1.18-1.95) |
0.001 |
1.76 (1.33-2.32) |
<0.0001 |
Gender (male vs. female) |
0.95 (0.74-1.22) |
0.677 |
1.02 (0.77-1.34) |
0.906 |
ECOG PS (1-2 vs. 0) |
1.48 (1.10-2.00) |
0.010 |
2.51 (1.82-3.47) |
<0.0001 |
Tumor localization (colon vs. rectum) |
1.30 (0.98-1.71) |
0.064 |
1.54 (1.13-2.09) |
0.006 |
CT regimen (FOLFIRI vs. FOLFOX4) |
1.19 (0.93-1.53) |
.167 |
1.18 (0.90-1.55) |
.217 |
KRAS status (mutated vs. wild type) |
1.00 (0.78-1.28) |
.995 |
1.08 (0.82-1.42) |
.592 |
ITACa treatment (CT+B vs. CT) |
0.85 (0.66-1.09) |
.193 |
1.29 (0.98-1.68) |
.064 |
Abbreviations: NRL, neutrophil-to-lymphocyte ratio; PLR, platelet-lymphocyte ratio; SII, systemic immune-inflammation index;
PFS, progression-free survival; OS, overall survival; HR, hazard ratio; CI, confidence interval; ECOG, Eastern Cooperative Oncology Group;
PS, performance status; ITACa, Italian Trial in Advanced Colorectal Cancer; CT, chemotherapy; B, bevacizumab
Predictive value of the II
Results of the impact of treatment (CT plus Bev and CT alone) on PFS and OS according to the analyzed II, together with 95% CI and HR data, are summarized in Table 4.
Table 4: Predictive value of II in the CT plus Bev and CT-only treatment arms
No. patients |
PFS |
HR (95%CI)a |
p |
OS |
HR (95% CI)a |
p |
|||||
|---|---|---|---|---|---|---|---|---|---|---|---|
No. events |
Median PFS (months) (95% CI) |
p |
No. events |
Median OS (months) (95% CI) |
p |
||||||
NLR |
|||||||||||
CT+B |
|||||||||||
NLR <3 |
86 |
77 |
12.4 (10.3-14.0) |
1.00 |
65 |
30.4 (22.6-36.1) |
1.00 |
||||
≥3 |
55 |
54 |
6.9 (4.7-9.0) |
< 0.0001 |
2.27 (1.53-3.37) |
< 0.0001 |
48 |
12.7 (7.9-15.3) |
< 0.0001 |
2.48 (1.61-3.83) |
< 0.0001 |
CT |
|||||||||||
NLR <3 |
82 |
78 |
8.9 (7.2-9.8) |
1.00 |
62 |
24.3 (20.2-28.0) |
1.00 |
||||
≥3 |
66 |
61 |
8.0 (6.2-9.1) |
0.315 |
1.12 (0.77-1.62) |
0.556 |
53 |
21.3 (16.8-24.5) |
0.143 |
1.19 (0.78-1.81) |
0.415 |
PLR |
|||||||||||
CT+B |
|||||||||||
PLR <169 |
72 |
64 |
11.4 (9.8-13.4) |
1.00 |
56 |
27.0 (20.6-34.5) |
1.00 |
||||
≥169 |
69 |
67 |
8.8 (6.4-9.9) |
0.006 |
1.62 (1.09-2.40) |
0.017 |
57 |
15.9 (12.9-20.9) |
0.061 |
1.67 (1.09-2.56) |
0.019 |
CT |
|||||||||||
PLR <169 |
72 |
68 |
9.3 (8.3-10.3) |
1.00 |
55 |
24.8 (20.3-29.2) |
1.00 |
||||
≥169 |
76 |
71 |
7.3 (5.5-8.9) |
0.158 |
1.26 (0.88-1.80) |
0.214 |
60 |
20.4 (16.8-24.5) |
0.106 |
1.39 (0.93-2.08) |
0.105 |
SII |
|||||||||||
CT+B |
|||||||||||
SII <730 |
75 |
68 |
11.5 (9.8-13.2) |
1.00 |
58 |
27.4 (21.8-34.5) |
1.00 |
||||
≥730 |
66 |
63 |
8.6 (6.4-9.9) |
0.014 |
1.41 (0.97-2.06) |
0.072 |
55 |
15.1 (11.6-19.3) |
0.002 |
1.68 (1.10-2.57) |
0.016 |
CT |
|||||||||||
SII <730 |
70 |
66 |
9.0 (7.0-9.8) |
1.00 |
52 |
24.8 (20.2-29.9) |
1.00 |
||||
≥730 |
78 |
73 |
8.1 (6.5-9.1) |
0.408 |
0.99 (0.70-1.42) |
0.978 |
63 |
20.4 (17.1-24.3) |
0.114 |
1.21 (0.80-1.82) |
0.369 |
aadjusted by ITACa treatment, center, CT regimen, KRAS status and baseline characteristics.
Abbreviations: NRL, neutrophil-to-lymphocyte ratio; PLR, platelet-lymphocyte ratio; SII, systemic immune-inflammation index; PFS, progression-free survival; OS, overall survival; HR, hazard ratio; CI, confidence interval; CT, chemotherapy; B, bevacizumab.
SII
Median PFS in the CT plus Bev group was 11.5 (95% CI 9.8-13.2) and 8.6 (95% CI 6.4-9.9) months in patients with low and high SII, respectively (p = .014), while in the CT-only arm it was 9.0 (95% CI 7.0-9.8) and 8.1 (95% CI 6.5-9.1) months in patients with low and high SII, respectively (p = .408). Median OS was significantly associated with SII levels in the CT plus Bev group (27.4 vs.15.1 months in low and high SII patients, respectively, p = .002), but not in the CT-only arm (24.8 vs. 20.4 months, p = .114). The interaction test did not reveal a significant correlation between SII levels on the basis of cut-off and treatment for either PFS or OS (p = .290 and .279, respectively). In contrast, the evaluation of SII as a continuous variable showed a positive interaction test for both PFS (p = .033) and OS (p = .043).
NLR
In the CT plus Bev group, median PFS was 12.4 (95% CI 10.3-14.0) and 6.9 (95% CI 4.7-9.0) months in patients with low and high NLR, respectively (p < .0001), and median OS was 30.4 (95% CI 22.6-36.1) and 12.7 (95% CI 7.9-15.3), respectively (p < .0001). In the CT-only arm, median PFS was 8.9 (95% CI 7.2-9.8) and 8.0 (95% CI 6.2-9.1) months in patients with low and high NLR, respectively (p = .315), and median OS was 24.3 (95% CI 20.2-28.0) and 21.3 (95% CI 16.8-24.5), respectively (p = .143).
The interaction test involving NLR levels and the effect of treatment in either group suggested that the correlation between NLR levels and improved outcome was significantly associated with the addition of Bev for both PFS (HR 1.75; 95% CI 1.08-2.84; p = .024) and OS (HR = 1.90; 95% CI 1.12-3.22; p = .017). This association was confirmed by evaluating the index as a continuous variable (PFS, p = .022; OS, p = .013).
PLR
In the CT plus Bev group, median PFS was 11.4 (95% CI 9.8-13.4) and 8.8 (95% CI 6.4-9.9) months in patients with low and high PLR, respectively (p = .006), and median OS was 27.0 and 15.9 months (p = .061). In the CT-only arm, median PFS was 9.3 (95% CI 8.3-10.3) and 7.3 (95% CI 5.5-8.9) months in patients with low and high PLR, respectively (p = .158), and median OS was 24.8 and 20.4 months, respectively (p = .106). The interaction tests, which considered the cut-off or the continuous variable, did not show any significant correlation between PLR levels and the effect of Bev on outcome (data not shown).
Efficacy of Bev as a function of II
The effect of adding Bev to CT as a function of II was also investigated. Among patients with low SII, a higher, albeit non significant, PFS was observed in those treated with CT plus Bev than in those receiving CT alone (HR = 0.74, 95% CI 0.52-1.04; p = .079). In high SII patients, PFS did not differ between the 2 treatment arms (HR = 0.97, 95% CI 0.69-1.36; p = .852) (Figure 1). Treatment with Bev did not lead to improved OS in patients with either high or low SII values (Supplementary Figure S1, available online only). Patients with low NLR in the CT plus Bev arm had a higher PFS than those treated with CT alone (HR 0.69, 95% CI 0.50-0.94, p = .021) (Figure 2), while Bev-treated patients with high NLR had a poorer OS than those receiving CT alone (HR = 1.69, 95% CI 1.14-2.51, p = .009) (Supplementary Figure S2, available online only).
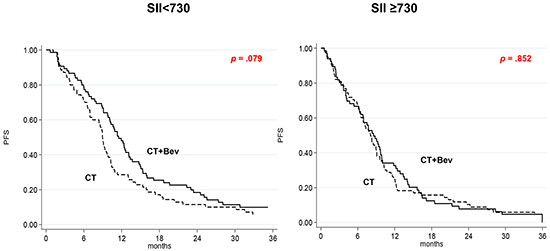
Figure 1: Kaplan-Meier curves of progression-free survival according to treatment as a function of SII.
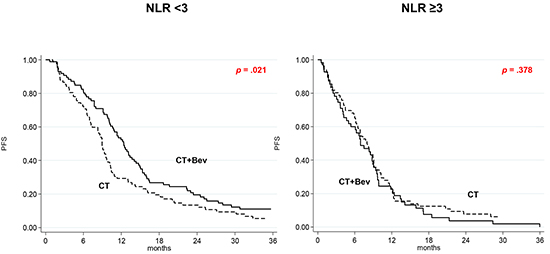
Figure 2: Kaplan-Meier curves of progression-free survival according to treatment as a function of NLR.
Patients with low PLR baseline values in the CT plus Bev arm had a trend towards higher PFS than those in the CT-only arm (HR = 0.74, 95% CI 0.53-1.05; p = .090), while those with high PLR showed a similar PFS in both treatment arms (HR = 0.93, 95% CI 0.67-1.31; p = .691) (Figure 3). OS was not affected by the addition of Bev in patients with either high or low PLR values (Supplementary Figure S3, available online only).
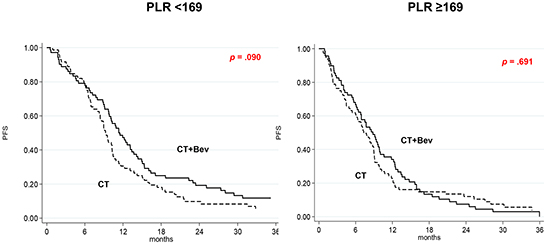
Figure 3: Kaplan-Meier curves of progression-free survival according to treatment as a function of PLR.
DISCUSSION
Inflammation produced by the secretion of cytokines and chemokines promotes tumor growth, angiogenesis and metastasis [3]. Several studies have shown that platelets induce circulating tumor cell epithelial-mesenchymal transition and promote extravasation to metastatic sites [25, 26]. Neutrophils promote adhesion and seeding of distant organ sites through the secretion of circulating growth factors such as VEGF and proteases [27, 28]. Lymphocytes play a crucial role in tumor defense by inducing cytotoxic cell death and inhibiting tumor cell proliferation and migration, thereby dictating the host’s immune response to malignancy [29]. Thus, inflammation induces changes in the cancer microenvironment that favor cancer progression.
In light of this, several II have been investigated as possible predictors of prognosis and response to treatment in different tumor types. Among these, NLR and PLR represent the most common indices [10-18], while the SII was only recently introduced [19-22]. Compared with other potential markers, the measurement of these parameters has the advantage of being inexpensive and reproducible.
The aim of our study was to evaluate the potential usefulness of these II to estimate prognosis and to predict the efficacy of treatment with Bev. Univariate analysis in the overall population showed that, in addition to performance status, SII, NLR, and PLR were significantly associated with PFS and OS, whereas in multivariate analysis, only ECOG PS and NLR remained markers of PFS and OS.
The impact of adding Bev to CT differed on the basis of the II and the incorporation (PLR and SII) or not (NLR) of the platelet count. In the present study, NLR appeared to be the most powerful indicator of prognosis. Patients with high NLR treated with Bev had a poorer OS than those treated with CT alone, whereas the addition of Bev did not lead to any significant difference in OS in the SII or PLR groups. Moreover, patients with low NLR in the CT plus Bev arm had a higher PFS than those treated with CT alone.
In addition to promoting tumor angiogenesis, there is evidence that VEGF favors tumor immune evasion and immune response suppression through different mechanisms mainly regulated by myeloid-derived suppressor cells (MDSCs) [30]. Bev, as an anti-VEGF agent, may thus induce immune response through several mechanisms including increased trafficking of T cells into tumors, reduction of suppressive cytokines and tumor-infiltrating T regulatory cells and MDSCs, increased CD8+ and CD4+ central memory T cells, and reduced frequency of MDSCs [31-34]. Whilst the inhibition of VEGF signaling appears to enhance CT efficacy in front-line treatment of patients with low II, high NLR is associated with a poor prognosis and may be correlated with a detrimental immunological effect of Bev. Overall, the role of VEGF in the immune response and its critical role in CRC pathogenesis may represent a rationale to test whether the inhibition of the PD-L1/PD-1 pathway by immune checkpoint inhibitors in combination with anti-VEGF therapies enhances clinical response in mCRC patients. The combined use of II and histological biomarkers (e.g. PDL1 expression) could help to select suitable candidates for these treatments.
In conclusion, II are powerful prognostic and predictive indicators of poor outcome in mCRC patients treated with CT +/- Bev. The addition of Bev to CT only appears to improve clinical outcome in those with favorable II values. Validation in a larger prospective data set is warranted.
MATERIALS AND METHODS
Patient population and treatment regimens
Two hundred and eighty-nine patients enrolled onto the first-line ITACa trial were considered. The study design and key eligibility and exclusion criteria have previously been described in detail [24]. Patients were recruited from 14th November 2007 to 6th March 2012 and followed up until 31st December 2013. After randomization, 176 patients underwent CT (either FOLFIRI or FOLFOX4) plus Bev, while 194 patients received CT alone. Patients were treated until disease progression or unacceptable toxicity occurred. All patients provided written informed consent. The study was carried out in accordance with the Declaration of Helsinki under good clinical practice conditions and after ethics committee approval of all participating centers. Tumor response was radiologically evaluated every 8 weeks according to the Response Evaluation Criteria in Solid Tumors (RECIST) until disease progression or withdrawal. The primary endpoint of the trial was progression-free survival (PFS) and secondary endpoints included overall survival (OS).
Information on neutrophil, lymphocyte and platelet counts from blood tests carried out at baseline (before systemic treatment) was collected. SII was calculated as platelet count × neutrophil count/lymphocyte count, NLR was obtained by dividing the absolute neutrophil count by the absolute lymphocyte count, and PLR was calculated as the ratio of absolute platelet count to absolute lymphocyte count.
Statistical analysis
The aim of this secondary analysis was to examine the association between baseline II levels and PFS and OS in the overall population, and separately in the 2 treatment arms. The data cut-off for analysis was 31st December 2013 when the median duration of follow-up was 36 months (range 1-65). PFS was defined as the time from random assignment to the first documentation of PD (per investigator assessment), or death from any cause. Patients undergoing curative metastasectomy were censored at the time of surgery. OS was defined as the time interval between random assignment and death or last follow-up visit. PFS and OS were estimated by the Kaplan-Meier method and curves were compared by the log-rank test (at a significance level of 5%). Estimated hazard ratios (HRs) and their two-sided 95% Confidence Intervals (95% CI) were calculated using the Cox proportional-hazard model. HRs adjusted by center and baseline characteristics (gender, age, ECOG performance status, KRAS status, tumor localization (rectum/colon) and CT regimen (FOLFOX4/FOLFIRI) were calculated using the Cox proportional hazards model. Covariate selection was based on a list of suspected prognostic factors derived from the ITACa study [24].
The effect of the interaction between II levels and treatment on PFS/OS was evaluated using Cox regression models for the entire population (CT+B and CT-only arms) including II levels, treatment and treatment-by-II levels. X-tile 3.6.1 software (Yale University, New Haven, CT) was used for bioinformatic analysis of baseline data to determine the cutoff value for pre-treatment levels of each II. SII ≥730, NLR ≥3 and PLR ≥169 were considered as elevated levels.
All p values were based on two-sided testing and statistical analyses were performed using SAS statistical software version 9.4 (SAS Inc., Cary, NC, USA).
ACKNOWLEDGMENTS
The authors thank Ursula Elbling for editorial assistance and Camilla Di Nunzio, Maria Angela Palladino (Piacenza), Caterina Accettura, Luciana Petrucelli, Abbondanza Gambino, Laura Lupo, Valeria Saracino (Lecce), Antonella Pasqualini, Giorgia Razzini (Carpi), Annalisa Fontana (Modena), Angela Ragazzini (Meldola), Britt Rudnas (Rimini), Barbara Venturini (Cattolica), Alessandra Piancastelli (Lugo), Bernadette Vertogen, Federica Zumaglini (Ravenna), Rosalba Poggi, Enrico Franceschi and Stefania Bartolini (Bologna) for participating in this study.
FUNDING
This trial was partially supported by the Italian Medicines Agency (AIFA - research grant no. FARM6FJJAY).
CONFICTS OF INTEREST
The authors have declared that no competing interests exist.
Authors’ contributions
AP, ES, UD conceived and designed the study, performed the analyses, interpreted data and drafted the article. All authors were involved in data acquisition and in revising the manuscript. All gave their approval for the present version of the manuscript to be submitted for publication.
REFERENCES
1. Ferrara N, Hillan KJ, Gerber HP, Novotny W. Discovery and development of bevacizumab, an anti-VEGF antibody for treating cancer. Nat Rev Drug Discov. 2004;3:391-400.
2. Lambrechts D, Lenz HJ, de Haas S, Carmeliet P, Scherer SJ. Markers of response for the antiangiogenic agent bevacizumab. J Clin Oncol. 2013;31:1219-1230.
3. Mantovani A, Allavena P, Sica A, Balkwill F. Cancer-related inflammation. Nature. 2008;454:436-444.
4. Lu H, Ouyang W, Huang C. Inflammation, a key event in cancer development. Mol Cancer Res. 2006;4:221-233.
5. Kusumanto YH, Dam WA, Hospers GA, Meijer C, Mulder NH. Platelets and granulocytes, in particular the neutrophils, form important compartments for circulating vascular endothelial growth factor. Angiogenesis. 2003;6:283-287.
6. Nozoe T, Matsumata T, Kitamura M, Sugimachi K. Significance of preoperative elevation of serum C-reactive protein as an indicator for prognosis in colorectal cancer. Am J Surg. 1998;176:335-338.
7. Toiyama Y, Inoue Y, Saigusa S, Kawamura M, Kawamoto A, Okugawa Y, Hiro J, Tanaka K, Mohri Y, Kusunoki M. C-reactive protein as predictor of recurrence in patients with rectal cancer undergoing chemoradiotherapy followed by surgery. Anticancer Res. 2013;33:5065-5074.
8. Shibutani M, Maeda K, Nagahara H, Noda E, Ohtani H, Nishiguchi Y, Hirakawa K. Prognostic significance of the preoperative serum C-reactive protein level in patients with stage IV colorectal cancer. Surg Today. 2015;45:315-321.
9. Guillem-Llobat P, Dovizio M, Alberti S, Bruno A, Patrignani P. Platelets, cyclooxygenases, and colon cancer. Semin Oncol. 2014;41:385-396.
10. Walsh SR, Cook EJ, Goulder F, Justin TA, Keeling NJ. Neutrophil-lymphocyte ratio as a prognostic factor in colorectal cancer. J Surg Oncol. 2005;91:181-184.
11. Kishi Y, Kopetz S, Chun YS, Palavecino M, Abdalla EK, Vauthey JN. Blood neutrophil-to-lymphocyte ratio predicts survival in patients with colorectal liver metastases treated with systemic chemotherapy. Ann Surg Oncol. 2009;16:614-622.
12. Chua W, Charles KA, Baracos VE, Clarke SJ. Neutrophil/lymphocyte ratio predicts chemotherapy outcomes in patients with advanced colorectal cancer. Br J Cancer. 2011;104:1288-1295.
13. Kwon HC, Kim SH, Oh SY, Lee S, Lee JH, Choi HJ, Park KJ, Roh MS, Kim SG, Kim HJ, Lee JH. Clinical significance of preoperative neutrophil-lymphocyte versus platelet-lymphocyte ratio in patients with operable colorectal cancer. Biomarkers. 2012;17:216-222.
14. Proctor MJ, McMilan DC, Morrison DS, Fletcher CD, Horgan PG, Clarke SJ. A derived neutrophil to lymphocyte ratio predicts survival in patients with cancer. Br J Cancer. 2012;107:695-699.
15. Shibutani M, Maeda K, Nagahara H, Noda E, Ohtani H, Nishiguchi Y, Hirakawa K. A high preoperative neutrophil-to-lymphocyte ratio is associated with poor survival in patients with colorectal cancer. Anticancer Res. 2013;33:3291-3294.
16. Li MX, Liu XM, Zhang XF, Zhang JF, Wang WL, Zhu Y, Dong J, Cheng JW, Liu ZW, Ma L, Lv Y. Prognostic role of neutrophil-to-lymphocyte ratio in colorectal cancer: a systematic review and meta-analysis. Int J Cancer. 2014;134:2403-2413.
17. Templeton AJ, McNamara MG, Seruga B, Vera-Badillo FE, Aneja P, Ocaña A, Leibowitz-Amit R, Sonpavde G, Knox JJ, Tran B, Tannock IF, Amir E. Prognostic role of neutrophil-to-lymphocyte ratio in solid tumors: a systematic review and meta analysis. J Natl Cancer Inst. 2014;106:dju124.
18. Maeda K, Shibutani M, Otani H, Nagahara H, Sugano K, Ikeya T, Amano R, Kimura K, Sakurai K, Kubo N, Muguruma K, Tanaka H, Inoue T, et al. Prognostic value of preoperative inflammation-based prognostic scores in patients with stage IV colorectal cancer who undergo palliative resection of asymptomatic primary tumors. Anticancer Res. 2013;33:5567-5573.
19. Hu B, Yang XR, Xu Y, Sun YF, Sun C, Guo W, Zhang X, Wang WM, Qiu SJ, Zhou J, Fan J. Systemic Immune-Inflammation Index Predicts Prognosis of Patients after Curative Resection for Hepatocellular Carcinoma. Clin Cancer Res. 2014;20:6212-6222.
20. Hong X, Cui B, Wang M, Yang Z, Wang L, Xu Q. Systemic Immune-inflammation Index, Based on Platelet Counts and Neutrophil-Lymphocyte Ratio, Is Useful for Predicting Prognosis in Small Cell Lung Cancer. Tohoku J Exp Med. 2015;236,297-304.
21. Yang Z, Zhang J, Lu Y, Xu Q, Tang B, Wang Q, Zhang W, Chen S, Lu L, Chen X. Aspartate aminotransferase-lymphocyte ratio index and systemic immune-inflammation index predict overall survival in HBV-related hepatocellular carcinoma patients after transcatheter arterial chemoembolization. Oncotarget. 2015;6:43090-43098.
22. De Giorgi U, Maruzzo M, Santoni M, Massari F, Wheater MJ, Scarpi E, Lolli C, Sotte V, Crabb SJ, Cascinu S, Basso U, Schepisi G. Systemic immune-inflammation index (SII) as prognostic/predictive factor in patients (pts) with metastatic renal cell cancer (mRCC) treated with sunitinib. J Clin Oncol. 2015;33(suppl; abstr e15595), submitted.
23. Clarke S, Burge M, Cordwell C, Gibbs P, Reece W, Tebbutt N. An australian translational study to evaluate the prognostic role of inflammatory markers in patients with metastatic colorectal cancer treated with bevacizumab (Avastin) [ASCENT]. BMC Cancer. 2013;13:120.
24. Passardi A, Nanni O, Tassinari D, Turci D, Cavanna L, Fontana A, Ruscelli S, Mucciarini C, Lorusso V, Ragazzini A, Frassineti GL, Amadori D. Effectiveness of bevacizumab added to standard chemotherapy in metastatic colorectal cancer: final results for first-line treatment from the ITACa randomized clinical trial. Ann Oncol. 2015;26:1201-1207.
25. Labelle M, Begum S, Hynes RO. Direct signaling between platelets and cancer cells induces epithelial-mesenchymal-like transition and promote metastasis. Cancer Cell. 2011;20:576-590.
26. Schumacher D, Strilic B, Sivaraj KK, Wettschureck N, Offermanns S. Platelet-derived nucleotides promote tumor-cell transendothelial migration and metastasis via P2Y2 receptor. Cancer Cell. 2013;24:130-137.
27. Cools-Lartigue J, Spicer J, McDonald B, Gowing S, Chow S, Giannias B, Bourdeau F, Kubes P, Ferri L. Neutrophyl extracellular traps sequester circulating tumor cells and promote metastasis. J Clin Invest. 2013;123:3446-3458.
28. Rossi L, Santoni M, Crabb SJ, Scarpi E, Burattini L, Chau C, Bianchi E, Savini A, Burgio SL, Conti A, Conteduca V, Cascinu S, De Giorgi U. High Neutrophil-to-lymphocyte Ratio Persistent During First-line Chemotherapy Predicts Poor Clinical Outcome in Patients with Advanced Urothelial Cancer. Ann Surg Oncol. 2015;22:1377-1384.
29. De Giorgi U, Mego M, Scarpi E, Giuliano M, Giordano A, Reuben JM, Valero V, Ueno NT, Hortobagyi GN, Cristofanilli M. Relationship between lymphocytopenia and circulating tumor cells as prognostic factors for overall survival in metastatic breast cancer. Clin Breast Cancer. 2012;12:264-269.
30. Gabrilovich DI, Ostrand-Rosenberg S, Bronte V. Coordinated regulation of myeloid cells by tumours. Nat Rev Immunol. 2012;12:253-268.
31. Hodi FS, Lawrence D, Lezcano C, Wu X, Zhou J, Sasada T, Zeng W, Giobbie-Hurder A, Atkins MB, Ibrahim N, Friedlander P, Flaherty KT, Murphy GF, et al. Bevacizumab plus ipilimumab in patients with metastatic melanoma. Cancer Immunol Res. 2014;2:632-642.
32. Manning EA, Ullman JG, Leatherman JM, Asquith JM, Hansen TR, Armstrong TD, Hicklin DJ, Jaffee EM, Emens LA. A vascular endothelial growth factor receptor-2 inhibitor enhances antitumor immunity through an immune-based mechanism. Clin Cancer Res. 2007;13:3951-3959.
33. Roland CL, Lynn KD, Toombs JE, Dineen SP, Udugamasooriya DG, Brekken RA. Cytokine levels correlate with immune cell infiltration after anti-VEGF therapy in preclinical mouse models of breast cancer. PLoS One. 2009;4:e7669.
34. Shrimali RK, Yu Z, Theoret MR, Chinnasamy D, Restifo NP, Rosenberg SA. Antiangiogenic agents can increase lymphocyte infiltration into tumor and enhance the effectiveness of adoptive immunotherapy of cancer. Cancer Res. 2010;70:6171-6180.