
INTRODUCTION
Cutaneous melanoma is a malignant tumor with a number of rather unique characteristics. In terms of etiology, there is strong evidence that exposure to sunlight/UV light is a causative factor [1]. Concerning the biology, although melanoma is a skin tumor, it originates from the neural crest and contains stem cells with distinctive features [2]. With respect to clinical course, whereas early stage melanoma can be cured by surgery, metastatic melanoma is a highly lethal condition because, although it may respond to MAPK pathway inhibitors and/or immunotherapy, to date it is rarely cured [3].
Driver mutations in BRAF and NRAS are the most prevalent oncogenic alterations in melanoma [4]. However, these mutations cannot fully explain melanoma oncogenesis, as they are found at similar rates also in benign nevi [5]. These skin lesions infrequently undergo malignant transformation into melanoma, but remain in their growth-arrested state and undergo senescence. This implies that additional genomic changes must be involved in transformation to melanoma. In recent years, genomic sequencing studies of melanoma have uncovered mutations in multiple genes [6-10]. However, the majority of these studies have investigated advanced primary or metastatic melanomas, but to our knowledge there are no data on early stages.
At the moment there is no way to predict whether surgical excision of a melanoma will be a definitive cure or not. We reasoned that comparative analysis of thin (< 1mm) and thick (> 4mm) melanomas with their different clinico-pathological features could be informative. First, thick melanomas have high risk of recurrence, whereas thin melanomas are at low risk [11, 12]. Second, a thick melanoma that after excision has produced metastasis could help to tell us which one(s) among many mutations drive metastasis. Third, a rare thin melanoma with poor prognosis would be complementary to the above and might give a clear pointer to metastasis-driving alterations. Accordingly, we have carried out whole-exome sequencing of 5 thin and 5 thick primary melanomas.
RESULTS
Genetic alterations in thin and thick primary melanomas
In total, we identified 3815 mutations: 1192 were synonymous and 2623 non-synonymous. The latter included 2150 missense, 138 non-sense, 58 splice-site variants and 277 small insertions/deletions (Supplementary Table). Thin melanomas had higher mutation frequency (340±124.4, mean±SEM) compared to thick melanomas (184.6±70.9, mean±SEM), although this difference was not statistically different (p = 0.3) due the limited number of samples and the high variability among them. Analysis of SCNAs revealed a total of 289 gains and 143 losses across all samples; SCNAs were more numerous in thick (58±6.5) than in thin (28.4±13.6) melanomas (Figure 1). Four out of ten melanomas had the BRAF V600E mutation and one a non-canonical BRAF D594N mutation. The latter presented also a missense mutation of KRAS (A146T) and one of ARAF (P194A/Q). Alterations in the tumor suppressor NF1, a negative effector of Ras [13], were present in a thin melanoma (M16, non-sense mutation and copy loss) harboring wt BRAF and in a thick melanoma (M9, non-sense mutation) with BRAF V600E. KIT missense mutations were present in M16 (L576P) and M2 (D816Y), respectively a thin and a thick melanoma harboring wt BRAF. Several melanoma-related genes were found altered (mutated and/or affected by SCNAs), including protein tyrosine kinases (EGFR, FGFR4, ERBB3, ERBB4, MET), members of DNA damage response pathway (TP53, TP53BP2, BRCA1), ionotropic and metabotropic glutamate receptors (GRIA1, GRIN3A, GRIN3B, GRM3, GRM4, GRM8), the methyltransferase KMT2C (MLL3), the negative regulator of mTOR pathway TSC2, the RAC exchange factor PREX1, NOTCH4 and the protein phosphatase PPP6C (Figure 1). Most of these mutations were predicted to be damaging by Sorting Intolerant from Tolerant (SIFT) or by PolyPhen2 algorithms.
The thin microinvasive melanoma M16 (thickness 0.3mm) had the highest number of mutations and of SCNAs. The thin melanoma M4 (thickness 0.96mm) was the second most mutated tumor but it presented a very low number of SCNAs (Figure 1). This patient died 2 years after diagnosis from complications of influenza vaccine in presence of severe cardiac disease. Among patients with thick melanomas, M6 died of pneumonia. Patients M11, M2 and M14 developed metastases and two of them (M2 and M14) died during follow-up.
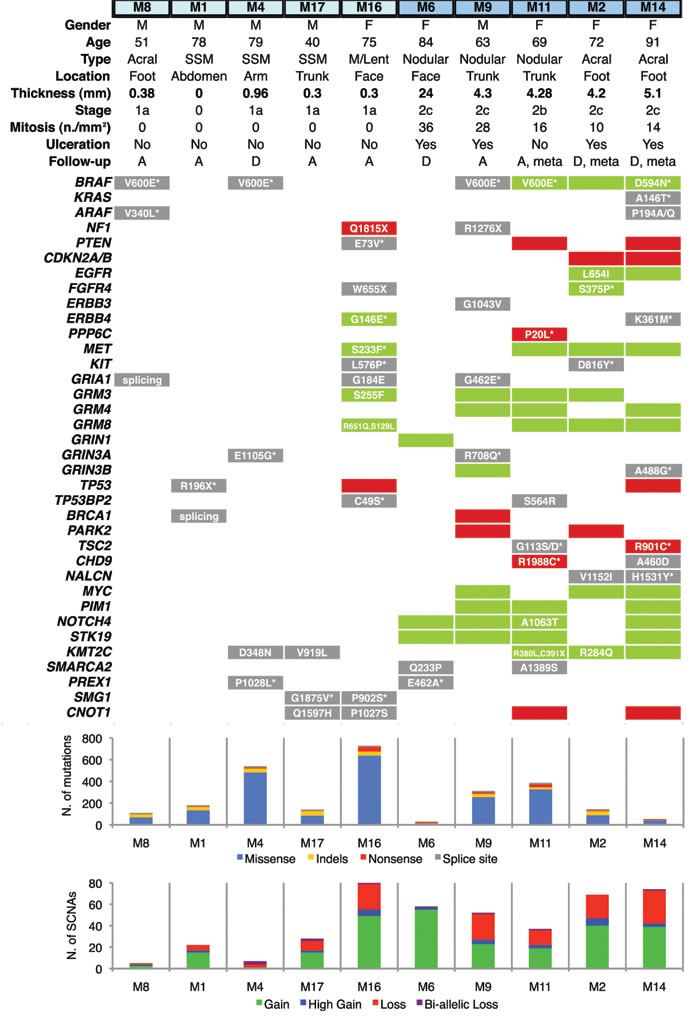
Figure 1: Distribution of genetic alterations in melanoma-related genes in thin and thick primary melanomas. Thin melanomas are labeled in light blue and thick in deep blue (top). Gene copy gains are shown by green bars and copy losses by red bars. Point mutations are shown in a grey background; when associated with concomitant copy gain/loss of the gene, mutations are shown in a green/red background. Histograms show total number of mutations (upper) and of SCNAs (bottom). Copy gains are classified as duplications (gain) or as amplification of more than 2 times (high gain). Copy losses are classified as heterozygous deletions (loss) or homozygous deletions (bi-allelic loss). M: male; F: female; SSM: Superficial Spreading Melanoma; M/Lent: Microinvasive melanoma on Lentigo; A: alive; D: deceased; meta: melanomas that produced metastasis during follow-up; SCNA: Somatic Copy Number Alteration. Asterix denotes that the amino acid substitution is potentially damaging. All reported genes are expressed in melanocytes and/or malignant melanoma.
Analysis of somatic copy number alterations distinguishes between thin and thick melanomas
Unsupervised hierarchical clustering analysis of SCNAs identified two distinct clusters corresponding to thin and thick melanomas, suggesting distinct genetic differences between those two groups (Figure 2A). Consistently, frequency plot showed high frequency of copy losses and copy gains in thick melanomas, whereas thin melanomas presented only few (Figure 2B). The most prevalent SCNAs were very short (focal SCNAs, 79%) (Figure 2C). Only few SCNAs involved more than 45% of the chromosome arm. These aberrations were detected only in four thick melanomas, three of which gave rise to metastasis during follow-up. We detected arm-level SCNAs, including complete gain of 8q (M2, M14) and 8p (M9), complete loss of 19q (M9), of 10p (M14), and entire gain of chromosome 18 (M14). Common aberrations involved gain of chromosome arms 6p, 7p, 8p, 11p and 18q, and losses of 6q and 9p (Supplementary Figure 1).
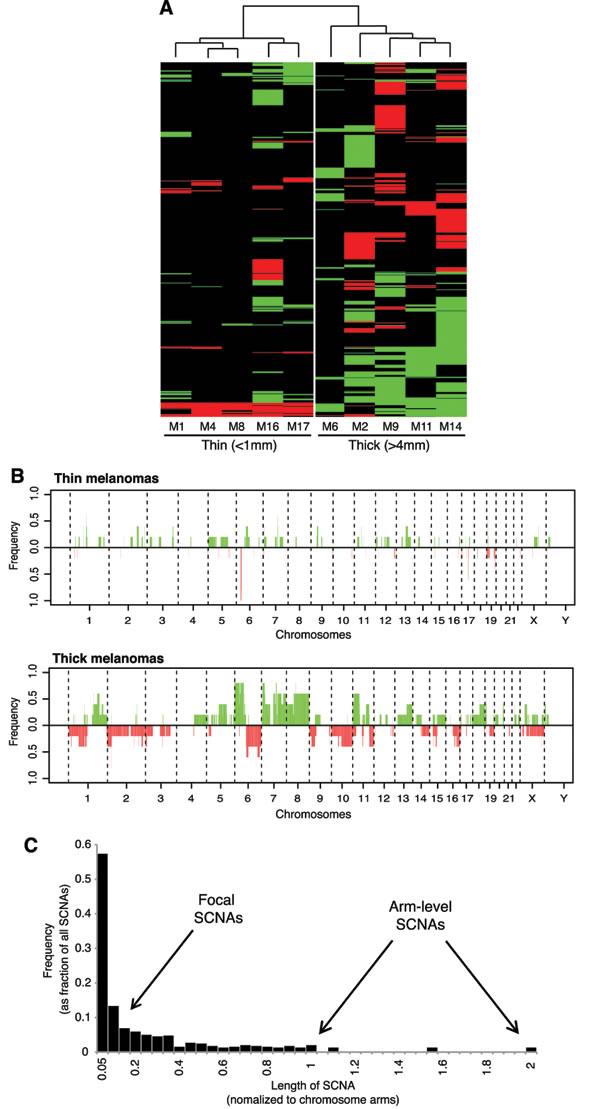
Figure 2: Different pattern of SCNAs in thin versus thick melanomas. A. Unsupervised clustering analysis of SCNAs in thin and thick primary melanomas. Copy gains are indicated in green and copy losses in red. B. Frequency plot of copy gains (green) and copy losses (red). C. Length distribution of SCNAs across the 10 melanomas. Note that the majority (79%) of SCNAs are focal (less than 20% of the chromosome arm).
Mapping of focal SCNAs has a great power to pinpoint important genes targeted by loss or gain events [14]. Therefore, we analyzed regions with recurrent (present in at least 2 out of 10 samples) focal SCNAs. The majority of focal SCNAs were found in thick melanomas (Supplementary Figure 2A). Among regions with copy losses we identified several known and putative tumor suppressors, including CDKN2A, CDKN2B, p53, WWOX, PARK2, PTEN, SUFU and ATM, consistent with a previous report [6] (Figure 3A). Recurrent focal amplifications of 6p12.1 and 7p21.1, that contain the TGFβ member BMP5 and TWIST1, respectively, occurred in 50% of the samples. Other recurrent amplifications were found in 40% of samples at 7q21.11 (HGF), 7q31-32 (MET, WNT2, WNT16, GRM8, POT1 and PAX4), 1q31.3 (PTPRC and ASPM) and 6q21 (RUNX2, NOTCH4 and STK19). Two other amplifications (involving c-MYC and PIM1) were found, respectively, on chromosomes 8p24.21 and 6p21.2 in 30% of the samples. The presence of the BRAF V600E mutation was associated with a lower number of focal SCNAs (15.8±6.2, mean±SEM) compared to tumors not carrying this mutation (46.5±7.8, mean±SEM), although not statistically significant (p = 0.08) (Supplementary Figure 2B) due the limited number of samples.
Alterations found in primary melanomas that developed metastasis
We reasoned that SCNAs and mutated genes present in those three thick melanomas that gave rise to metastasis during follow-up (M11, M2, M14) and not in the other seven samples must be regarded as candidates for being involved in metastasis. All three melanomas that developed metastasis displayed amplification of BRAF at 7q34 (amplicon size, 6 genes), which is a common event in melanoma [6, 15] and it is associated with worse clinical outcome [16]. Those three melanomas presented also amplification of 7q36.1 (amplicon size, 78 genes), which includes the epigenetic modifier EZH2. Amplification of EZH2 locus in melanomas that developed metastasis is consistent with the higher EZH2 mRNA expression in metastatic compared with primary melanomas (p < 0.001) in public microarrays (Figure 3B). This finding suggests that EZH2 might be a candidate gene involved in melanoma metastasis, in line with a recent report [17]. Other “metastasis-associated” recurrent amplifications occurred at 7q36.3 (SHH), at 7p11.2 (EGFR), at 7q32 (SMO, PLXNA4, KLF14) and at 7q34 (ADCK2) (Figure 3A). Among genes mutated in at least two of those three melanomas, we identified TSC2 (tuberous sclerosis 2), CHD9 (chromodomain-helicase-DNA-binding protein 9) and NALCN (sodium leak channel, non-selective) (Figure 1).
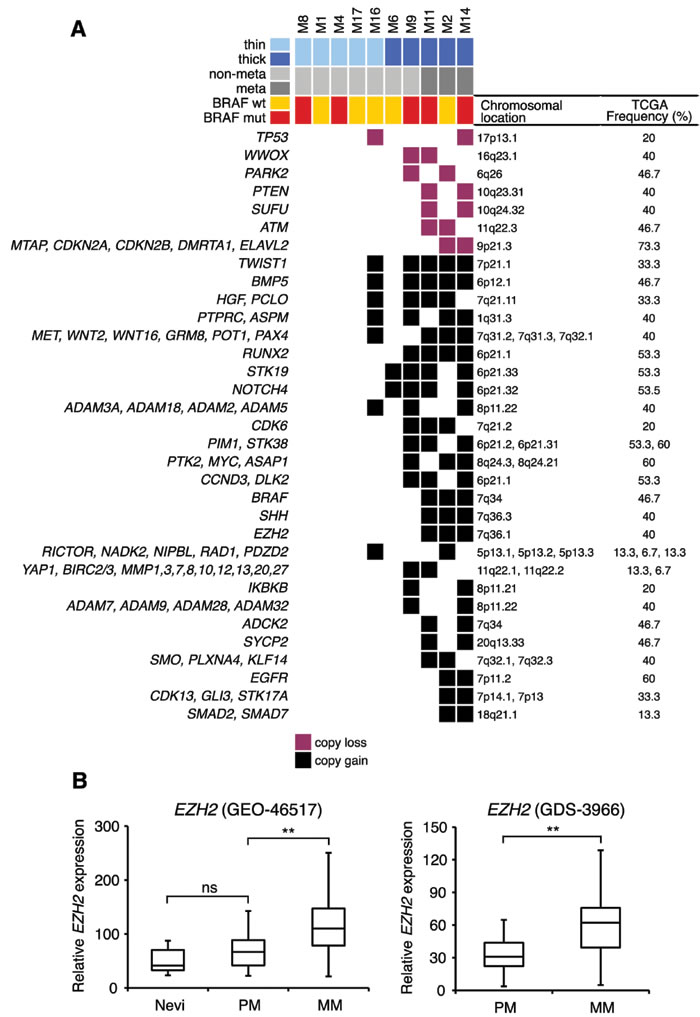
Figure 3: Recurrent focal SCNAs in primary melanomas. A. Only recurrent (present in at least 20% of melanomas) SCNAs are shown. Focal SCNAs were observed mainly in thick melanomas. Known and putative tumor suppressor genes are present in regions with copy losses; several oncogenes are present in regions of copy gains. Frequencies of SCNAs were validated in primary melanomas in the TCGA database. B. Expression of EZH2 mRNA in two different microarray data sets (GEO-46517 and GDS-3966). In GEO-46517 nevi (n = 9), primary (n = 31) and metastatic (n = 73) melanomas. In GDS-3966 primary melanomas (n = 31) and metastatic melanomas (n = 52). PM, primary melanomas; MM, metastatic melanomas. **, p < 0.001.
Alterations in axon guidance genes
We identified mutations and SCNAs in axon guidance genes, particularly Slit/Robo signaling, Ephrins and Semaphorins/Plexins. These are important regulators of normal neural migration and positioning during embryonic development. Recently, they have been implicated in cancer cell growth, survival, invasion and angiogenesis [18]; however, aberrations of this class of genes have never been reported in melanoma.
Slit glycoproteins (SLIT1-3) signal through their Roundabout receptors (ROBO1-4) to elicit their effects inside the cell [19]. Missense mutations in SLIT3 were found in M4 (S268L) and in M9 (G575R). The latter is located in the leucine-rich repeat domain, which is involved in protein-protein interaction. Melanoma M4 had also a concomitant missense mutations in SLIT2 (L224F) (Figure 4A). All these mutations were predicted to be damaging or probably damaging by SIFT or PolyPhen2. Consistently, SLIT3 was reported mutated in 15% of human melanomas in cBioPortal database (http://www.cbioportal.org/). Down-regulation of ROBO1 is part of a molecular signature that predicts the metastatic risk associated with cutaneous melanoma [20], therefore we examined the survival of patients with SLIT3 mutations. We found that patients with wild type SLIT3 had a prolonged disease free survival (median months 52) compared with those harboring mutated SLIT3 (median months 26.3) (p = 0.042, log-rank test, Figure 4B). These results altogether suggest that aberrant Slit/Robo signaling might be a potential feature of human melanoma and that mutations in SLIT3 might associate with poor clinical outcome.
Several classes of Ephrin receptors and Ephrin ligands exhibited SCNAs, particularly in thick melanomas (Figure 4A). EPHA1, EPHA3 and EPHB6 were contained in regions of copy gain, suggesting their oncogenic role during melanoma progression. Interestingly, we found both EPHA4 and EPHA7 in regions of copy loss in 20% of the samples (Figure 4A). Deletion of EPHA4 and EPHA7 loci in thick melanomas is consistent with decreased expression of EPHA4 and EPHA7 mRNA in metastatic compared to primary melanomas (Figure 4C-4D, Supplementary Figure 3A). The Ephrin ligand EFNB3 was contained in a region of copy loss and EFNB3 mRNA expression was significantly decreased in metastatic compared to primary melanomas (Supplementary Figure 3B). These findings suggest that EPHA4, EPHA7 and EFNB3 might act as tumor suppressors during melanoma progression.
Class 3 semaphorins exhibited SCNAs and mutations (Figure 4A). In particular, amplification of SEMA5A and SEMA6A loci (found in 20% and 30% of the melanoma, respectively) were consistent with their increased mRNA expression in melanomas compared to nevi (Supplementary Figure 4). These results are in line with the role of SEMA5A in promoting invasion of gastric cancer cells [21] and of SEMA6A in controlling cell growth of BRAFV600E mutant melanomas [22]. Semaphorins signal through Plexin and Neuropilin receptors to elicit their effects inside the cells [23]. Plexins A and B were also found altered in our cohort, although at lesser extent than Semaphorins. PLXNA1 and PLXNB2 were in a region of copy loss in 10% of the samples and PLXNA4 was in a region of copy gain in two of the three melanomas that produced metastasis (Figure 4A), suggesting that human melanomas harbor alterations of Plexins, in particular PLXNA4 amplification, as previously reported [24].
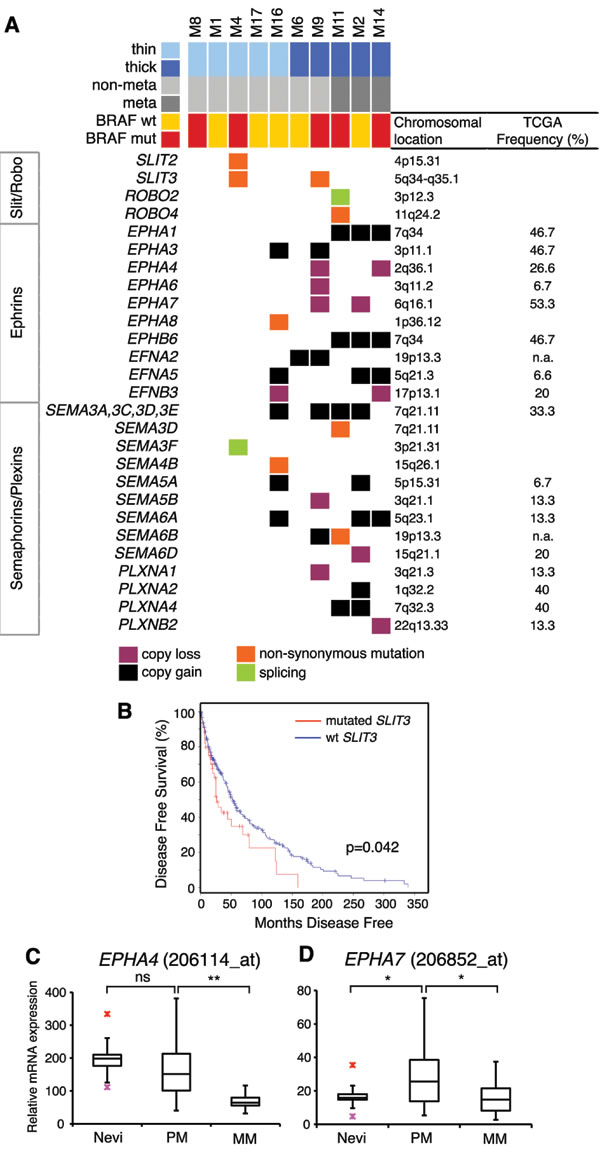
Figure 4: Mutations and SCNAs in axon guidance genes. A. Axon guidance genes with mutations and/or SCNAs. Frequencies of SCNAs were validated in primary melanomas in the TCGA database (on the right). B. Kaplan-Meier disease free survival in patients with wild type SLIT3 (n = 254, median months 52) compared with those with mutated SLIT3 (n = 45, median months 26.3) (p = 0.042, log-rank test). Disease free survival curve was obtained from cBioportal database. C.-D. Expression of EPHA4 (C) and EPHA7 (D) mRNA in human nevi (n = 9), primary (n = 31) and metastatic (n = 73) melanomas, as determined by publicly available microarray data set (GEO-46517). PM, primary melanomas; MM, metastatic melanomas. Red crosses indicate outliner values. *, p < 0.05; **, p < 0.001.
Pathway analysis
In addition to the MAPK pathway, we found alterations in multiple additional pathways, including NOTCH and HEDGEHOG signaling, several tyrosine kinases and epigenetic regulators (Figure 5). Specifically, the HEDGEHOG pathway exhibited alterations indicative of activation, such as amplification of the transmembrane receptor SMOOTHENED (SMO) and of the ligand Sonic Hedgehog (SHH), and missense mutations in the highly conserved region of the transactivator domain of GLI1, the downstream effector of the HH signaling. In addition, we observed copy losses of the negative regulators SUFU, as well as of the tumor suppressor WWOX, a newly identified negative modulator of GLI1 in breast cancer [25]. Similarly, aberrant activation of the NOTCH pathway is suggested by the alterations in several NOTCH pathway components, such as copy gains of the ligand JAG1, the receptors NOTCH4 and NOTCH2, the co-activator MAML2, and the targets HES7 and MYC. Among tyrosine kinases, we identified a region of amplification (7q31.2) in 40% of melanomas that contained the MET oncogene, which is involved in development and progression of melanoma [26]. Missense mutations were found in ERBB4, ERBB3, KIT, FGFR4 and several other kinases. Multiple epigenetic regulators were found mutated or involved in regions of copy gains. For instance, the histone-lysine N-methyltransferase MLL3 (KMT2C) was altered in 50% of the samples. Other epigenetic modulators found frequently mutated are the member of the SWI/SNF family SMARCA2, and ASXL3 and CHD9.
Many of these altered pathways represent therapeutic targets that are actionable in preclinical models and in the clinic [27-29]. For example, the NOTCH pathway can be targeted by the MK-0752, an inhibitor of γ-secretase in phase I clinical trial for patients with advanced solid tumors, including melanoma [30]. Activation of cMYC and Hedgehog pathway can be targeted by BET-bromodomain inhibition with the small molecule JQ1 [31, 32]. Similarly, the small molecule Glabrescione B has been shown to interfere with the Hedgehog pathway by inhibiting GLI1/DNA interaction in preclinical models of Hedgehog-dependent tumors [33]. The epigenetic modifier EZH2 can be targeted with the specific inhibitor GSK126 in melanoma [34]. Importantly, a number of these alterations could be targeted in combination with the BRAFV600E inhibitor vemurafenib.
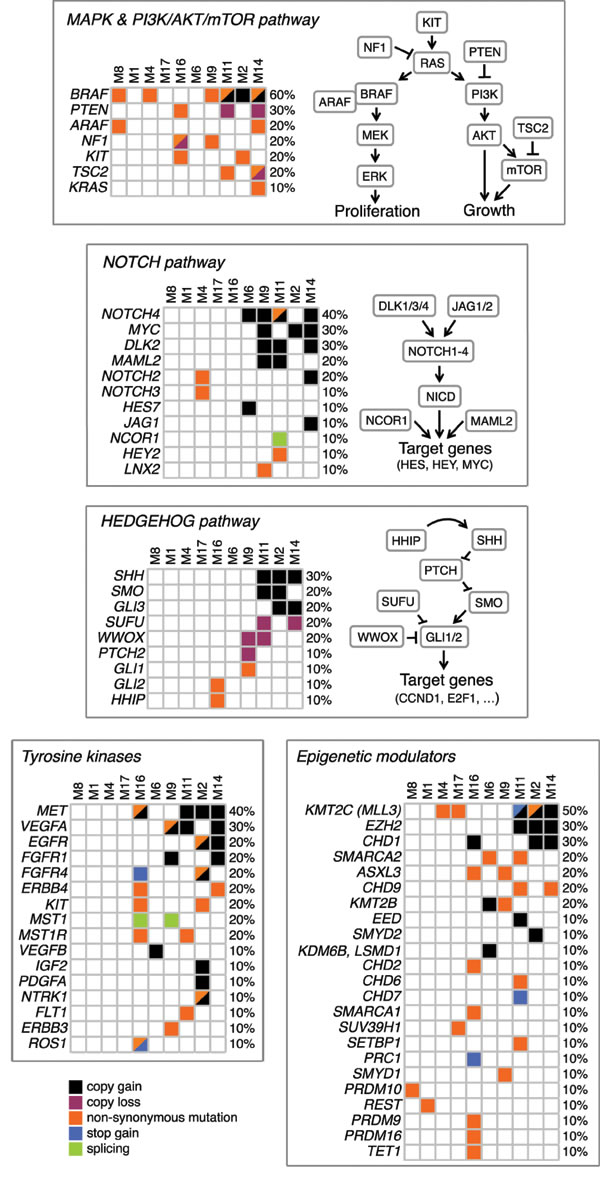
Figure 5: Altered pathways in primary melanomas. Schematics of pathways with mutations and SCNAs occurring in at least one patient. All reported genes are expressed in melanocytes and/or malignant melanoma.
DISCUSSION
For some 20 years it has been known that thickness of cutaneous melanoma is a major prognostic factor. Thin melanoma has a much better prognosis than thick melanoma: so much so that thickness is an established criterion in dictating management. The dividing line between thin and thick has been set at 1 mm [11, 12]. It is reasonable to think that most of the thick melanomas have been thin before they became thick; a less obvious question is whether in some cases (or perhaps in the majority) thin melanoma is not just an early stage, but from the outset a different type of tumor.
In the aim to answer this question we undertook whole-exome sequencing of both thin and thick melanomas. Since our study was started, a wealth of data have accumulated on the mutational landscape of thick melanoma [6-10, 15]; but hardly any have been published on thin melanomas. In part this may be due simply to the fact that with a thin melanoma little or no material is left once histopathological examination has been properly carried out. We have been able to obtain material from a small number (n = 5) of thin melanomas. This has enabled us to demonstrate - for the first time to the best of our knowledge - that, although with considerable variation among samples, the number of point mutations in thin and thick melanomas is similar (Figure 1). This finding suggests that point mutations occur early during tumor development, as previously reported [8]. On the other hand, the number of SCNAs greatly increases from thin to thick melanomas (Figure 2), indicating that SCNAs might play a role in melanoma progression. A possible explanation is that thin and thick melanomas might have the same origin and tumor progression occurs through accumulation of SCNAs. However, since the number of point mutations does not increase from thin to thick melanomas, it is conceivable to hypothesize that from the outset there are two types of melanomas that differ in their tendency to undergo SCNAs: only those prone to make SCNAs are likely to progress. This is not surprising given the high number of evolving clones described in normal human skin [35].
At the moment is it not known whether the high number of SCNAs in thick melanomas might simply reflect the accumulation of new alterations during tumor progression, or whether they actually drive melanoma progression. What is clear is that an increased tendency to generate SCNAs is an important difference between thin melanomas and those that were analyzed when they were already thick. The mechanisms underlying the formation of focal SCNAs have not been fully elucidated. It can be speculated that activated oncogenes might induce breakage of DNA replication forks, leading to DNA replication stress and DNA double strand breaks [36]. A recent report suggests that break-induced replication repair of damaged forks promotes segmental duplications in the genome of cancer cells [37].
An outstanding challenge is to predict whether a thin melanoma will become thick and/or eventually develop metastasis. Indeed, there might be two types of thin melanomas: some are simply on their way to become thick, others remain thin for many years and may be intrinsically different from the former. For instance the thin melanoma M16 harbors the highest number of SCNAs and point mutations. In principle, the thickness of 0.3 mm was predictive of good prognosis; however, the set of alterations resembled that of a thick melanoma (Figure 1). Since the primary lesion was surgically removed, we cannot say how it might have otherwise evolved. In the event, this patient has no evidence of disease recurrence after a follow-up of 6 years: in spite of the fact that point mutations in several key melanoma genes (NF1, PTEN, MET and KIT) and the high number of SCNAs made us speculate that this tumor, though thin, might have become a fast-growing melanoma. This observation underscores the importance of periodical skin examination and early diagnosis.
Another interesting finding of our study is the involvement of axon guidance genes in melanoma. Axon guidance is an important component of organogenesis, regeneration, wound healing and other basic cellular processes. The numerous point mutations and SCNAs observed in axon guidance genes suggest that they might play a role in melanoma. In this respect, there are precedents in other tumors [18], including pancreatic cancers [38]. Slits have been shown to impair migration of neural crest cells [39], from which melanocytes originate. In most of the cancers, SLIT/ROBO signaling acts as a tumor suppressor by inhibiting cell invasion and migration [19]. Alterations in several components of the axon guidance signaling have been reported in brain metastases from melanomas [40]. The functional role of SLIT3 mutations identified in this study is currently unknown. Nevertheless, the association between SLIT3 mutations and reduced disease free survival suggests that SLIT3 might play an important role in melanoma. In agreement with a previous study showing the inhibitory role of SLIT3 in melanoma cell migration [41], we can hypothesis that SLIT3 acts as tumor suppressor in melanoma. Both oncogenic and tumor suppressor roles have been described for specific Ephrin receptors and their ligands [42]. Deletion of EPHA4 and EPHA7 loci, that we found in two out of five thick melanomas, correlates with their reduced expression in metastatic compared to primary melanomas, suggesting that EPHA4 and EPHA7 might act as tumor suppressor during melanoma progression. This is also supported by recent studies that showed inhibition of invasion and tumor growth by EPHA7 in follicular lymphoma and by EPHA4 in lung adenocarcinoma [43, 44].
A major signaling mode frequently altered in melanoma is the MAPK pathway, which regulates cell proliferation and survival [45, 46]. Seven out of ten melanomas have alterations in the MAPK pathway, including point mutations/SCNAs in BRAF and NF1, and mutations in KRAS and ARAF. Melanoma with BRAF D594N substitution had also a mutation in KRAS (A146T) and one in ARAF (P194A/Q). BRAF D594N is a kinase-dead protein; nevertheless, considering results in mice [47] co-occurrence of BRAF D594N and KRAS mutations might contribute to tumor progression. Some of these mutations are likely to have important implications for therapy. For instance, KRAS A146T and other exon 4 KRAS mutations are expected to respond to MEK inhibitors and to be resistant to EGFR inhibitors [48]. Likewise, KIT L576P, the most common KIT mutation in melanoma, has been shown to induce structural changes in KIT that reduce the affinity for imatinib but not for dasatinib [49]. Similarly, loss of NF1 function is associated with RAS activation, responsiveness to MEK inhibitors and, in the presence of concurrent BRAF mutations, vemurafenib resistance [50]. At any rate, our study confirms the predominance of alterations in the MAPK pathway [6, 15]. At the same time, unlike previous next-generation sequencing studies that have analyzed thick melanomas [6-8], we did not find a significant difference in mutation load between BRAF wt and BRAF V600E melanomas [8], although BRAF V600E melanomas tend to have a lower number of focal SCNAs.
In conclusion, we report for the first time an analysis of the mutational landscape of a small set of thin melanomas: they have numerous point mutations but very few SCNAs. In addition, we have identified a set of SCNAs, including amplification of BRAF and EZH2, in thick melanomas that subsequently developed metastasis. Although this finding needs to be confirmed on a larger cohort of samples, it suggests that these SCNAs might become useful prognostic markers in melanoma. In addition, thick melanomas often have alterations in multiple pathways, including MAPK, SLIT/ROBO, NOTCH and HEDGEHOG signaling, Ephrin receptors and tyrosine kinases (Figure 5). Therefore, it is not altogether surprising that targeting a single pathway results in therapeutic failure: it may be imperative to target at least two signaling pathways at one time.
MATERIALS AND METHODS
Melanoma samples
Fresh-frozen tissues from ten untreated primary cutaneous melanomas were collected from the Plastic Surgery Unit of the S.M. Annunziata Hospital (Florence, Italy). Samples were selected according to thickness: five melanomas were thin ( < 1mm) and five thick ( > 4mm). Matched patient blood was also collected to distinguish somatic from germline mutations. All patients gave informed consent and the protocol was approved by the local Ethic Committee. All patient studies were conducted in accordance with the declaration of Helsinki. Histological variables such as Breslow thickness (mm), melanoma subtypes, stage, presence of ulceration, mitotic rate (n./mm2) and follow-up were assessed. Only M1 was an in situ melanoma. Melanoma subtypes were: superficial spreading melanoma (SSM) (n = 3) (M1, M4, M17), nodular melanoma (n = 3) (M6, M9, M11), acral melanoma (n = 3) (M8, M2, M14) and microinvasive melanoma developed on Hutchinson lentigo (n = 1) (M16) (Figure 1). Samples M11, M2 and M14 developed metastases during follow-up; in patient M11 metastases occurred in the lungs, M2 had intra-abdominal and peritoneal metastases, M14 liver and lung metastases.
Whole exome sequencing
Genomic DNA was extracted from the tumor and matched peripheral blood using the QIAamp DNA Minikit (Qiagen, Milan, Italy). One microgram of genomic DNA was sheared by sonication. Exome enrichment was conducted using the Illumina TruSeq Exome Enrichment kit (Illumina, San Diego, CA). Sequencing was carried out on an illumina HiScan SQ instrument. Samples were loaded in an indexed pool of 4 samples per lane, and an average coverage of 84x and 46x was achieved for tumor and matched normal samples, respectively (Supplementary Table), that is adequate for detecting a Single Nucleotide Variant (SNVs) [10].
Sequencing alignment and variant calling
Reads were aligned against human reference genome (hg19) with BWA MEM [51]. GATK version 2.5.2 [52] was used to recalibrate base qualities and realign mapped reads around indels. PicardTools’ MarkDuplicates (version 1.98) was used to remove optical and PCR duplicates. In order to identify somatic SNVs and small Insertions/Deletions (InDels), matched normal/tumor samples were analysed by MuTect version 1.14 [53] and IndelGenotyperV2 of GATK, respectively. Functional annotation of somatic variants was carried out by ANNOVAR [54]. SIFT [55] and Polyphen [56] scores were used to determine the potential impact of point mutations. Somatic Copy Number Alterations (SCNAs) were detected by EXCAVATOR version 2.2 [57] (with cellularity = 0.7). Ward’s hierarchical clustering of SCNAs was performed by using Pearson correlation coefficient to cluster tumor samples (columns) and the euclidean distance to cluster genomic events (rows). Frequency analysis of SCNAs was performed by bedtools [58] and R custom scripts as follow: for each 1Mbp genome window, alteration frequency (AF) for both gains and losses was calculated as the fraction of samples having at least 1 SCNAs in that genomic window. TCGA data were downloaded from The Cancer Genome Atlas (TCGA) Data Portal (https://tcga-data.nci.nih.gov/tcga/).
Analysis of mutations and SCNAs
The BRAF mutation status was validated using Sanger sequencing. Fifteen primary melanomas (thickness ≥ 1.92mm) from the TCGA Data Portal were interrogated to confirm frequencies of SCNAs found in our samples. Two publicly available microarray data sets (GEO-46517 [59] and GDS3966), which included nevi, primary and metastatic melanoma samples profiled on Affymetrix U133 platforms, were used to assess the expression of genes involved in regions of copy loss and gains.
Length and amplitude thresholds of SCNAs
Length of each SCNA was converted into chromosome-arm unit by calculating the fraction of each chromosome arm covered by SCNA [14]; for the SCNAs that cross the centromere, the length is expressed as the sum of the fractions of each chromosome arm covered by the SCNA. This normalization results in value ranging between 0 to 2. SCNA with lengths < 0.2 ( < 20% of the chromosome arm) were considered as focal SCNA, while SCNA covering more than 45% of the chromosome arm (lengths > 0.45) were considered as genomic aberrations.
Statistical analysis
Survival curves were plotted according to the Kaplan-Meier method, using cBioportal database [60, 61] (http://www.cbioportal.org/). Nonparametric Spearman correlation was used to evaluate the association between the number of mutations or SCNAs and continuous variables (age and mitotic rate). The Mann-Whitney U test was used to assess the association between the number of mutations or SCNAs and dichotomous variables (gender, BRAFV600E, BRAF mutational status and metastasis evolution). Kruskal-Wallis test was used to investigate the association between the number of mutations or SCNAs and variables with three or more categories (location and tumor type). mRNA levels were investigated for class-specific expression using t-test and visualized by boxplots.
Acknowledgments
We thank Rosario Notaro and Silvestro Conticello (CRL-ITT, Florence) for helpful comments on the paper and discussion, and Lorenzo Tofani (ITT, Florence) for assistance with statistical analysis.
Conflicts of Interest
There are no potential conflicts of interest
Grant Support
This work was partially supported by grants from AIRC (Italian Association for Cancer Research, IG-14184) and Fondazione Cassa di Risparmio di Firenze (2011.1072, FiorGen Foundation) to BS.
Authors’ contributions
B.S. and L.L. designed the study and wrote the manuscript; V.M., M.B., A.A., C.P. and D.L. prepared the samples and analyzed the data; C.U., G.G. and L.B. were involved in sample collection; all authors approved the manuscript.
Editorial note
This paper has been accepted based in part on peer-review conducted by another journal and the authors’ response and revisions as well as expedited peer-review in Oncotarget.
References
1. Leiter U, Garbe C. Epidemiology of melanoma and nonmelanoma skin cancer-the role of sunlight. Adv Exp Med Biol. 2008; 624: 89-103.
2. Murphy G.F, Wilson BJ, Girouard SD, Frank NY, Frank MH. Stem cells and targeted approaches to melanoma cure. Mol Aspects Med. 2014; 39: 33-49.
3. Lo JA, Fisher DE. The melanoma revolution: from UV carcinogenesis to a new era in therapeutics. Science. 2014; 346: 945-949.
4. Siroy AE, Boland GM, Milton DR, Roszik J, Frankian S, Malke J, Haydu L, Prieto VG, Tetzlaff M, Ivan D, Wang WL, Torres-Cabala C, Curry J, et al. Beyond BRAF(V600): clinical mutation panel testing by next-generation sequencing in advanced melanoma. J Invest Dermatol. 2015; 135: 508-515.
5. Pollock PM, Harper UL, Hansen KS, Yudt LM, Stark M, Robbins CM, Moses TY, Hostetter G, Wagner U, Kakareka J, Salem G, Pohida T, Heenan P, et al. High frequency of BRAF mutations in nevi. Nat Genet. 2003; 33: 19-20.
6. Krauthammer M, Kong Y, Ha BH, Evans P, Bacchiocchi A, McCusker JP, Cheng E, Davis MJ, Goh G, Choi M, Ariyan S, Narayan D, Dutton-Regester K, et al. Exome sequencing identifies recurrent somatic RAC1 mutations in melanoma. Nat Genet. 2012; 44: 1006-1014.
7. Hodis E, Watson IR, Kryukov GV, Arold ST, Imielinski M, Theurillat JP, Nickerson E, Auclair D, Li L, Place C, Dicara D, Ramos AH, Lawrence MS, et al. A landscape of driver mutations in melanoma. Cell. 2012; 150: 251-263.
8. Mar VJ, Wong SQ, Li J, Scolyer RA, McLean C, Papenfuss AT, Tothill RW, Kakavand H, Mann GJ, Thompson JF, Behren A, Cebon JS, Wolfe R, et al. BRAF/NRAS wild-type melanomas have a high mutation load correlating with histologic and molecular signatures of UV damage. Clin Cancer Res. 2013; 19: 4589-4598.
9. Krauthammer M, Kong Y, Bacchiocchi A, Evans P, Pornputtapong N, Wu C, McCusker JP, Ma S, Cheng E, Straub R, Serin M, Bosenberg M, Ariyan S, et al. Exome sequencing identifies recurrent mutations in NF1 and RASopathy genes in sun-exposed melanomas. Nat Genet. 2015; 47: 996-1002.
10. Cancer Genome Atlas Research Network et al. Genomic Classification of Cutaneous Melanoma. Cell. 2015; 161: 1681-1696.
11. Balch CM, Gershenwald JE, Soong SJ, Thompson JF, Atkins MB, Byrd DR, Buzaid AC, Cochran AJ, Coit DG, Ding S, Eggermont AM, Flaherty KT, Gimotty PA, et al. Final version of 2009 AJCC melanoma staging and classification. J Clin Oncol. 2009; 27: 6199-6206.
12. Maurichi A, Miceli R, Camerini T, Mariani L, Patuzzo R, Ruggeri R, Gallino G, Tolomio E, Tragni G, Valeri B, Anichini A, Mortarini R, Moglia D, et al. Prediction of survival in patients with thin melanoma: results from a multi-institution study. J Clin Oncol. 2014; 32: 2479-2485.
13. Basu TN, Gutmann DH, Fletcher JA, Glover TW, Collins FS, Downward J. Aberrant regulation of ras proteins in malignant tumour cells from type 1 neurofibromatosis patients. Nature. 1992; 356: 713-715.
14. Beroukhim R, Mermel CH, Porter D, Wei G, Raychaudhuri S, Donovan J, Barretina J, Boehm JS, Dobson J, Urashima M, Mc Henry KT, Pinchback RM, Ligon AH, et al. The landscape of somatic copy-number alteration across human cancers. Nature. 2010; 463: 899-905.
15. Nikolaev SI, Rimoldi D, Iseli C, Valsesia A, Robyr D, Gehrig C, Harshman K, Guipponi M, Bukach O, Zoete V, Michielin O, Muehlethaler K, Speiser D, et al. Exome sequencing identifies recurrent somatic MAP2K1 and MAP2K2 mutations in melanoma. Nat Genet. 2011; 44:133-139.
16. Wilson MA, Zhao F, Khare S, Roszik J, Woodman SE, D’Andrea K, Wubbenhorst B, Rimm DL, Kirkwood JM, Kluger HM, Schuchter LM, Lee SJ, Flaherty KT, et al. Copy Number Changes Are Associated with Response to Treatment with Carboplatin, Paclitaxel, and Sorafenib in Melanoma. Clin Cancer Res. 2016; 22: 374-382.
17. Zingg D, Debbache J, Schaefer SM, Tuncer E, Frommel SC, Cheng P, Arenas-Ramirez N, Haeusel J, Zhang Y, Bonalli M, McCabe MT, Creasy CL, Levesque MP, et al. The epigenetic modifier EZH2 controls melanoma growth and metastasis through silencing of distinct tumour suppressors. Nat Commun. 2015; 6: 6051.
18. Mehlen P, Delloye-Bourgeois C, Chédotal A. Novel roles for Slits and netrins: axon guidance cues as anticancer targets? Nat Rev Cancer. 2011; 11: 188-197.
19. Gara RK, Kumari S, Ganju A, Yallapu MM, Jaggi M, Chauhan SC. Slit/Robo pathway: a promising therapeutic target for cancer. Drug Discov Today. 2015; 20: 156-164.
20. Gerami P, Cook RW, Wilkinson J, Russell MC, Dhillon N, Amaria RN, Gonzalez R, Lyle S, Johnson CE, Oelschlager KM, Jackson GL, Greisinger AJ, Maetzold D, et al. Development of a prognostic genetic signature to predict the metastatic risk associated with cutaneous melanoma. Clin Cancer Res. 2015; 21: 175-183.
21. Pan G, Zhu Z, Huang J, Yang C, Yang Y, Wang Y, Tuo X, Su G, Zhang X, Yang Z, Liu T. Semaphorin 5A promotes gastric cancer invasion/metastasis via urokinase-type plasminogen activator/phosphoinositide 3-kinase/protein kinase B. Dig Dis Sci. 2013; 58: 2197-2204.
22. Loria R, Bon G, Perotti V, Gallo E, Bersani I, Baldassari P, Porru M, Leonetti C, Di Carlo S, Visca P, Brizzi MF, Anichini A, Mortarini R, et al. Sema6A and Mical1 control cell growth and survival of BRAFV600E human melanoma cells. Oncotarget. 2015; 6: 2779-2793. doi: 10.18632/oncotarget.2995.
23. Cagnoni, G. & Tamagnone, L. Semaphorin receptors meet receptor tyrosine kinases on the way of tumor progression. Oncogene. 2014; 33: 4795-4802.
24. Balakrishnan A, Penachioni JY, Lamba S, Bleeker FE, Zanon C, Rodolfo M, Vallacchi V, Scarpa A, Felicioni L, Buck M, Marchetti A, Comoglio PM, Bardelli A, et al. Molecular profiling of the “plexinome” in melanoma and pancreatic cancer. Hum Mutat. 2009; 30: 1167-1174.
25. Xiong A, Wei L, Ying M, Wu H, Hua J, Wang Y. Wwox suppresses breast cancer cell growth through modulation of the hedgehog-GLI1 signaling pathway. Biochem Biophys Res Commun. 2014; 443: 1200-1205.
26. Otsuka T, Takayama H, Sharp R, Celli G, LaRochelle WJ, Bottaro DP, Ellmore N, Vieira W, Owens JW, Anver M, Merlino G. c-Met autocrine activation induces development of malignant melanoma and acquisition of the metastatic phenotype. Cancer Res. 1998; 58: 5157-5167.
27. Mochin MT, Underwood KF, Cooper B, McLenithan JC, Pierce AD, Nalvarte C, Arbiser J, Karlsson AI, Moise AR, Moskovitz J, Passaniti A. Hyperglycemia and redox status regulate RUNX2 DNA-binding and an angiogenic phenotype in endothelial cells. Microvasc Res. 2015; 97:55-64.
28. Bhandarkar SS, Jaconi M, Fried LE, Bonner MY, Lefkove B, Govindarajan B, Perry BN, Parhar R, Mackelfresh J, Sohn A, Stouffs M, Knaus U, Yancopoulos G, et al. Fulvene-5 potently inhibits NADPH oxidase 4 and blocks the growth of endothelial tumors in mice. J Clin Invest. 2009; 119: 2359-65.
29. Bonner MY, Karlsson I, Rodolfo M, Arnold RS, Vergani E, Arbiser JL. Honokiol bis-dichloroacetate (Honokiol DCA) demonstrates activity in vemurafenib-resistant melanoma in vivo. Oncotarget. 2016; doi: 10.18632/oncotarget.7289.
30. Krop I, Demuth T, Guthrie T, Wen PY, Mason WP, Chinnaiyan P, Butowski N, Groves MD, Kesari S, Freedman SJ, Blackman S, Watters J, Loboda A, et al. Phase I pharmacologic and pharmacodynamic study of the gamma secretase (Notch) inhibitor MK-0752 in adult patients with advanced solid tumors. J Clin Oncol. 2012; 30: 2307-2313.
31. Delmore JE, Issa GC, Lemieux ME, Rahl PB, Shi J, Jacobs HM, Kastritis E, Gilpatrick T, Paranal RM, Qi J, Chesi M, Schinzel AC, McKeown MR et al. BET bromodomain inhibition as a therapeutic strategy to target c-Myc. Cell. 2011; 146: 904-917.
32. Tang Y, Gholamin S, Schubert S, Willardson MI, Lee A, Bandopadhayay P, Bergthold G, Masoud S, Nguyen B, Vue N, Balansay B, Yu F, Oh S, et al. Epigenetic targeting of Hedgehog pathway transcriptional output through BET bromodomain inhibition. Nat Med. 2014; 20: 732-40.
33. Infante P, Mori M, Alfonsi R, Ghirga F, Aiello F, Toscano S, Ingallina C, Siler M, Cucchi D, Po A, Miele E, D’Amico D, Canettieri G, et al. Gli1/DNA interaction is a druggable target for Hedgehog-dependent tumors. EMBO J. 2015; 34: 200-217.
34. Tiffen JC, Gunatilake D, Gallagher SJ, Gowrishankar K, Heinemann A, Cullinane C, Dutton-Regester K, Pupo GM, Strbenac D, Yang JY, Madore J, Mann GJ, Hayward NK, et al. Targeting activating mutations of EZH2 leads to potent cell growth inhibition in human melanoma by derepression of tumor suppressor genes. Oncotarget. 2015; 6: 27023-27036. doi: 10.18632/oncotarget.4809.
35. Martincorena I, Roshan A, Gerstung M, Ellis P, Van Loo P, McLaren S, Wedge DC, Fullam A, Alexandrov LB, Tubio JM, Stebbings L, Menzies A, Widaa S, et al. Tumor evolution. High burden and pervasive positive selection of somatic mutations in normal human skin. Science. 2015; 348: 880-886.
36. Halazonetis TD, Gorgoulis VG, Bartek J. An oncogene-induced DNA damage model for cancer development. Science. 2008; 319: 1352-1355.
37. Costantino L, Sotiriou SK, Rantala JK, Magin S, Mladenov E, Helleday T, Haber JE, Iliakis G, Kallioniemi OP, Halazonetis TD. Break-induced replication repair of damaged forks induces genomic duplications in human cells. Science. 2014; 343: 88-91.
38. Biankin AV, Waddell N, Kassahn KS, Gingras MC, Muthuswamy LB, Johns AL, Miller DK, Wilson PJ, Patch AM, Wu J, Chang DK, Cowley MJ, Gardiner BB, et al. Pancreatic cancer genomes reveal aberrations in axon guidance pathway genes. Nature. 2012; 491: 399-405.
39. Giovannone D, Reyes M, Reyes R, Correa L, Martinez D, Ra H, Gomez G, Kaiser J, Ma L, Stein MP, De Bellard ME. Slits affect the timely migration of neural crest cells via Robo receptor. Dev Dyn. 2012; 241: 1274-1288.
40. Saunus JM, Quinn MC, Patch AM, Pearson JV, Bailey PJ, Nones K, McCart Reed AE, Miller D, Wilson PJ, Al-Ejeh F, Mariasegaram M, Lau Q, Withers T, et al. Integrated genomic and transcriptomic analysis of human brain metastases identifies alterations of potential clinical significance. J Pathol. 2015; 237: 363-378.
41. Denk AE, Braig S, Schubert T, Bosserhoff AK. Slit3 inhibits activator protein 1-mediated migration of malignant melanoma cells. Int J Mol Med. 2011; 28: 721-726.
42. Pasquale EB. Eph receptors and ephrins in cancer: bidirectional signalling and beyond. Nat Rev Cancer. 2010; 10: 165-180.
43. Oricchio E, Nanjangud G, Wolfe AL, Schatz JH, Mavrakis KJ, Jiang M, Liu X, Bruno J, Heguy A, Olshen AB, Socci ND, Teruya-Feldstein J, Weis-Garcia F, et al. The Eph-receptor A7 is a soluble tumor suppressor for follicular lymphoma. Cell. 2011; 147: 554-564.
44. Saintigny P, Peng S, Zhang L, Sen B, Wistuba II, Lippman SM, Girard L, Minna JD, Heymach JV, Johnson FM. Global evaluation of Eph receptors and ephrins in lung adenocarcinomas identifies EphA4 as an inhibitor of cell migration and invasion. Mol Cancer Ther. 2012; 11: 2021-2032.
45. Fecher, L. A., Amaravadi, R. K., Flaherty, K.T. The MAPK pathway in melanoma. Curr Opin Oncol. 2008; 20: 183-189.
46. Cohen C, Zavala-Pompa A, Sequeira JH, Shoji M, Sexton DG, Cotsonis G, Cerimele F, Govindarajan B, Macaron N, Arbiser JL. Mitogen-actived protein kinase activation is an early event in melanoma progression. Clin Cancer Res. 2002; 8: 3728-33.
47. Heidorn SJ, Milagre C, Whittaker S, Nourry A, Niculescu-Duvas I, Dhomen N, Hussain J, Reis-Filho JS, Springer CJ, Pritchard C, Marais R. Kinase-dead BRAF and oncogenic RAS cooperate to drive tumor progression through CRAF. Cell. 2010; 140: 209-221.
48. Janakiraman M, Vakiani E, Zeng Z, Pratilas CA, Taylor BS, Chitale D, Halilovic E, Wilson M, Huberman K, Ricarte Filho JC, Persaud Y, Levine DA, Fagin JA, et al. Genomic and biological characterization of exon 4 KRAS mutations in human cancer. Cancer Res. 2010; 70: 5901-5911.
49. Woodman SE, Trent JC, Stemke-Hale K, Lazar AJ, Pricl S, Pavan GM, Fermeglia M, Gopal YN, Yang D, Podoloff DA, Ivan D, Kim KB, Papadopoulos N, et al. Activity of dasatinib against L576P KIT mutant melanoma: molecular, cellular, and clinical correlates. Mol Cancer Ther. 2009; 8: 2079-2085.
50. Nissan MH, Pratilas CA, Jones AM, Ramirez R, Won H, Liu C, Tiwari S, Kong L, Hanrahan AJ, Yao Z, Merghoub T, Ribas A, Chapman PB, et al. Loss of NF1 in cutaneous melanoma is associated with RAS activation and MEK dependence. Cancer Res. 2014; 74: 2340-2350.
51. Li H, Durbin R. Fast and accurate long-read alignment with Burrows-Wheeler transform. Bioinformatics. 2010; 26: 589-595.
52. McKenna, A. Hanna M, Banks E, Sivachenko A, Cibulskis K, Kernytsky A, Garimella K, Altshuler D, Gabriel S, Daly M, DePristo MA.The Genome Analysis Toolkit: a MapReduce framework for analyzing next-generation DNA sequencing data. Genome Res. 2010; 20: 1297-1303.
53. Cibulskis, K. Lawrence MS, Carter SL, Sivachenko A, Jaffe D, Sougnez C, Gabriel S, Meyerson M, Lander ES, Getz G. Sensitive detection of somatic point mutations in impure and heterogeneous cancer samples. Nat Biotechnol. 2013; 31: 213-219.
54. Wang K, Li M, Hakonarson H. ANNOVAR: functional annotation of genetic variants from high-throughput sequencing data. Nucleic Acids Res. 2010; 38: e164.
55. Ng PC, Henikoff S. Predicting deleterious amino acid substitutions. Genome Res. 2001; 11: 863-874.
56. Adzhubei IA Schmidt S, Peshkin L, Ramensky VE, Gerasimova A, Bork P, Kondrashov AS, Sunyaev SR. A method and server for predicting damaging missense mutations. Nat Methods. 2010; 7: 248-249.
57. Magi A, Tattini L, Cifola I, D’Aurizio R, Benelli M, Mangano E, Battaglia C, Bonora E, Kurg A, Seri M, Magini P, Giusti B, Romeo G, et al. EXCAVATOR: detecting copy number variants from whole-exome sequencing data. Genome Biol. 2013; 14: R120.
58. Quinlan AR, Hall IM. BEDTools: a flexible suite of utilities for comparing genomic features. Bioinformatics. 2010; 26: 841-842.
59. Kabbarah, O. Nogueira C, Feng B, Nazarian RM, Bosenberg M, Wu M, Scott KL, Kwong LN, Xiao Y, Cordon-Cardo C, Granter SR, Ramaswamy S, Golub T, et al. Integrative genome comparison of primary and metastatic melanomas. PLoS One. 2010; 5: e10770.
60. Gao, J. Aksoy BA, Dogrusoz U, Dresdner G, Gross B, Sumer SO, Sun Y, Jacobsen A, Sinha R, Larsson E, Cerami E, Sander C, Schultz N. Integrative analysis of complex cancer genomics and clinical profiles using the cBioPortal. Sci Signal. 2013; 6: p11.
61. Cerami E, Gao J, Dogrusoz U, Gross BE, Sumer SO, Aksoy BA, Jacobsen A, Byrne CJ, Heuer ML, Larsson E, Antipin Y, Reva B, Goldberg AP, et al. The cBio cancer genomics portal: an open platform for exploring multidimensional cancer genomics data. Cancer Discov. 2012; 2: 401-404.