
INTRODUCTION
Aberrant CpG island methylation, especially in promoter regions of tumor suppressor genes, is related to tumorigenesis. For example, RUNX3 promoter methylation (PM) is related to esophageal squamous cell carcinoma [1]. WIF1 and DKK3 to poor prognosis in breast cancer [2]; FGR3 mutation and hypermethylation to bladder cancer [3] and SFRP2 hypermethylation to gastric cancer (GC) [4, 5]. CpG island methylation can inactivate or downregulate tumor suppressor genes, ultimately leading to tumor development and progression. In recent years, relationships between the PM of tumor suppressor genes and carcinoma risk have attracted much attention in methylation research [6, 7].
Really Interesting, new gene (RING) Finger (RNF) is a family of ubiquitin ligases that function as tumor suppressors [8–10]. RNF180 is a recently discovered member of the RNF family—an E3 ubiquitin ligase that reportedly participates in proliferation and differentiation [11]. Although the PM status of RNF180 is known to affect GC prognosis [12–14]; however, its effect on risk of GC, or on its most important precancerous state, atrophic gastritis (AG), remain unclear.
Helicobactor pylori (H.pylori) is a major carcinogen of gastric cancer and can also lead to abnormal DNA methylation [15–19]. Whether H.pylori infection would modify RNF180 DNA methylation has not been revealed yet. This study focused on the relationships between RNF180 PM and risk of GC and AG, and the effect of H.pylori infection on RNF180 PM.
RESULTS
Relationship between AMR of RNF180 promoter and GC or AG
We amplified the RNF180 promoter area from −224 bp to +94 bp (a 318-bp fragment). The results show AMR in the RNF180 promoter to increase with disease severity, such that CON < AG < GC (GC vs. AG: P < 0.021; AG vs. CON: P < 0.001; Figure 1A).
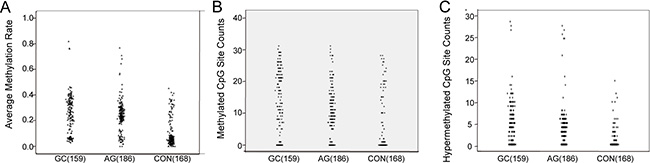
Figure 1: The scatter plot of RNF180 gene promoter methylation. (A) The average methylation rate of RNF 180 gene in different gastric diseases; (B) The methylated CpG site counts of RNF 180 gene in different gastric diseases; (C) The hypemethylated CpG site counts RNF 180 gene in different gastric diseases.
We also evaluated the validity of RNF180 promoter area AMR in distinguishing AG or GC from controls, by ROC curves. We found that AMR > 0.153 was 78.6% sensitive and 77.4% specific (AUC = 0.802) in distinguishing [GC + AG] from controls (Figure 2A); and at 0.316, was 41.5% sensitive and 87.9% specific for GC vs. [AG + CON] (Figure 2B).
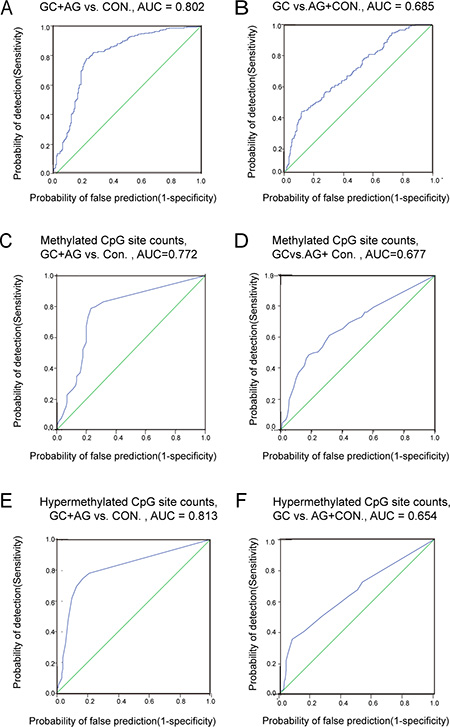
Figure 2: The ROC curve of RNF180 gene promoter methylation. (A) GC + AG vs. CON., AUC = 0.802; (B) GC vs. AG + Con., AUC = 0.685; (C) Methylated CpG site counts, GC + AG vs. CON., AUC = 0.772; (D) Methylated CpG site counts, GC vs. AG + CON., AUC = 0.677; (E) Hypermethylated CpG site counts, GC + AG vs. CON., AUC = 0.813; (F) Hypermethylated CpG site counts, GC vs. AG + CON AUC = 0.654.
Relationships between MSC and HSC of the RNF180 promoter area and GC or AG
Relationships between MSC or HSC and GC or AG were analyzed by the Mann–Whitney U test. As with AMR, MSC increased with disease severity (i.e., CON < AG < GC, Figure 1B). However, HSC in the GC and AG groups were higher than for controls, (P < 0.001 for both), but did not significantly differ between the GC and AG groups (P = 0.301; Figure 1C).
We further evaluated RNF180 promoter MSC and HSC as biomarkers for AG or GC, using ROC curves. We found MSC > 4 was 78.6% sensitive and 77.4% specific (AUC = 0.772) in distinguishing [GC + AG] groups from controls (Figure 2C); MSC > 15 was 48.4% sensitive and 87.9% specific (AUC = 0.772) in distinguishing GC from [AG + CON] (Figure 2D). We found that HSC > 1 was 74.5% sensitive and 83.3% specific (AUC = 0.813) in distinguishing GC+AG from controls (Figure 2E); and at HSC > 6, was 35.2% sensitive and 92.1% specific(AUC = 0.654) at distinguishing GC from [AG + CON] (Figure 2F).
Relationship between hypermethylated of RNF180 promoter CpG sites and GC or AG
The location of every hypermethylation site in RNF180 gene and distribution of hypermethylation frequency in GC, AG and control groups were shown in Supplementary Table S1, Based on a comparative analysis of relationships between MSC or HSC and GC or AG, we selected 8 CpG sites with which hypermethylation frequencies > 25% among a total 513 individuals—M3(−165), M5(−148), M7(−133), M8(−130), M20(−57), M25(−34), M27(−26) and M30(+5)—to evaluate the risk of AG or GC. All results were analyzed using logistic regression. P values and odd ratio (OR) were adjusted by sex, age, smoking, drinking and H.pylori infection.
We found hypermethylation frequencies of M5(−148) and M27(−26) in the GC group were higher than in the AG + CON group, and were associated with increased GC risks of 5.85 folds (95% confidence interval [CI]: 3.20–10.69) and 4.27 folds (95% CI: 2.54–7.19), respectively. We also found that hypermethylation in 5 CpG sites—M3(−165), M7(−133), M20(−57), M25(−34) and M30(+5)—could increase the risks for AG and GC and there is significant difference when compares to random two groups of GC AG CON(GC vs. CON, AG vs. CON and GC vs. AG, Table 1).
Table 1: Association between hypermethylation frequency and risks of gastric cancer and atrophic gastritis
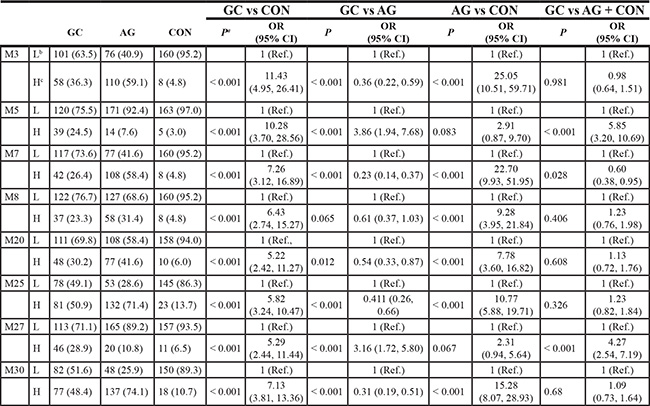
Note: a: P value and odd ratio(OR) were adjusted by sex, age, smoking, drinking and H.pylori infection. P value OR and corresponding 95% interval confidence were calculated to measure the association between hypermethylation of CpG site and the risks of different groups. b: the number of hypomethylated cases; c: H:hypermethylation. GC: gastric cancer; AG: atrophic gastritis; CON: control; OR: odd ratio; CI: interval confidence.
Relationship of hypermethylation of RNF180 AND RNF180 mRNA expression
To explore the possible effect of RNF180 promoter methylation on gene expression, we further evaluated the relationship of the hypermethylation and the expression of RNF180 mRNA using the Mann–Whitney U test. In tumor specimens, the RNF180 mRNA levels were significantly lower than those in non-tumor specimens (P = 0.003). In addition, the RNF180 mRNA levels were decreased in tend from hypermethylation to hypomethylation, although the P value did not reach the statistical significance (P = 0.075, Table 2).
Table 2: Relationship between RNF180 expression and gastric diseases, RNF180 hypermethylation
group |
ΔCt (Mean ± SD) |
Normalized 2-ΔΔCt |
P |
|
|---|---|---|---|---|
gastric diseases |
non-tumor |
4.58 ± 1.65 |
1.0 (0.32, 3.14) |
Ref. |
tumor |
5.58 ± 2.00 |
0.5 (0.13, 2.00) |
0.003 |
|
methylation |
hypomethylation |
4.99 ± 1.90 |
1.0 (0.27, 3.73) |
Ref. |
hypermethylation |
6.46 ± 1.50 |
0.36 (0.13, 1.02) |
0.075 |
|
Effect of H.pylori infection on RNF180 PM
To explore the effect on methylation by H.pylori infection, we subdivided the CON, AG and GC groups by their H.pylori infection status, using the Mann–Whitney U test. AMR did not significantly differ between the H.pylori− and H.pylori+ subgroups for in GC (P = 0.761) or AG (P = 0.581), but was higher in H.pylori+ sub-group than H.pylori− subgroup among the controls (P = 0.012). A similar pattern was seen in the control group for HSC (P = 0.037; Table 3). In the H.pylori+ sub-groups, we found 8 CpG sites with hypermethylation frequency > 25% of all 513 individuals. The results also showed that 3 CpG sites—M3(−165) (OR: 2.74; 95% CI: 1.37–5.47), M25(−34) (OR: 2.62; 95% CI: 1.29–5.31) and M30(+5) (OR: 2.80; 95% CI: 1.38–5.71), had higher hypermethylation risk in the H.pylori+ AG subgroup; whereas M27(−26) had a higher methylation risk in the H.pylori− AG subgroup. The M30(+5) site also had a higher methylation risk in the H.pylori+ CON subgroup (Table 4).
Table 3: Relationship between H.pylori infection and DNA methylation of RNF180 promoter area in different gastric diseases
Group |
H.pylori |
n |
Average |
|
Methylated CpG sites count |
|
Hypermethylated CpG sites count |
|
|---|---|---|---|---|---|---|---|---|
Median (25th, 75th) |
P |
Median (25th, 75th) |
P |
Median (25th, 75th) |
P |
|||
GC |
(–) |
84 |
0.28 (0.15, 0.36) |
0.761 |
14 (3.5, 23.75) |
0.744 |
5 (0, 8) |
0.697 |
|
(+) |
75 |
0.26 (0.17, 0.34) |
14 (4, 21) |
4 (0, 7) |
|||
AG |
(–) |
55 |
0.23 (0.09, 0.31) |
0.581 |
9 (1, 16) |
0.494 |
4 (0, 6) |
0.634 |
|
(+) |
131 |
0.24 (0.21, 0.29) |
10 (7, 14) |
4 (3, 5) |
|||
CON |
(–) |
143 |
0.05 (0.03, 0.12) |
0.012 |
0 (0, 1) |
0.108 |
0 (0, 0) |
0.037 |
|
(+) |
25 |
0.08 (0.51, 0.32) |
0 (0, 19) |
0 (0, 3) |
P value for Mann-Whitney U test comparing the difference of variables between H.pylori positive and negative groups. GC: gastric cancer; AG: atrophic gastritis; CON:control.
Table 4: Association between H.pylori infection and the risks of Hypermethylation frequency in different gastric diseases
H.pylori |
GC |
AG |
CON |
||||
|---|---|---|---|---|---|---|---|
(–)a |
(+)b |
(–) |
(+) |
(–) |
(+) |
||
M3 |
n (%) |
84 (52.8) |
75 (47.2) |
55 (29.6) |
131 (70.4) |
143 (85.1) |
25 (14.9) |
Hyperc |
31 (53.4) |
27 (46.6) |
25 (22.7) |
85 (77.3) |
6 (75.0) |
2 (25.0) |
|
Hypod |
53 (52.5) |
48 (47.5) |
30 (39.5) |
46 (60.5) |
137 (85.6) |
23 (11.4) |
|
P |
|
0.769 |
|
0.004 |
|
0.509 |
|
CI (95%) |
1 (Ref.) |
0.91 (0.47, 1.76) |
1 (Ref.) |
2.74 (1.37, 5.47) |
1 (Ref.) |
2.33 (0.19, 28.88) |
|
M5 |
Hyper |
22 (56.4%) |
17 (43.6%) |
5 (35.7%) |
9 (64.3%) |
4 (80.0%) |
1 (20.0%) |
Hypo |
62 (51.7%) |
58 (48.3%) |
50 (29.1%) |
122 (70.9%) |
139 (85.3%) |
24 (14.7%) |
|
P |
|
0.694 |
|
0.515 |
|
0.286 |
|
CI (95%) |
1 (Ref.) |
0.86 (0.41, 1.82) |
1 (Ref.) |
0.67 (0.20, 2.23) |
1 (Ref.) |
4.03 (0.31, 52.06) |
|
M7 |
Hyper |
23 (54.8%) |
19 (45.2%) |
27 (25.0%) |
81 (75.0%) |
7 (87.5%) |
1 (12.5%) |
Hypo |
61 (52.1%) |
56 (47.9%) |
28 (35.9%) |
50 (64.1%) |
136 (85.0%) |
24 (15.0%) |
|
P |
|
0.574 |
|
0.064 |
|
0.798 |
|
CI (95%) |
1 (Ref.) |
0.81 (0.39, 1.69) |
1 (Ref.) |
1.87 (0.97, 3.62) |
1 (Ref.) |
0.75 (0.84, 6.69) |
|
M8 |
Hyper |
21 (56.8%) |
16 (43.2%) |
17 (29.3%) |
41 (70.7%) |
7 (87.5%) |
1 (12.5%) |
Hypo |
63 (51.6%) |
59 (48.4%) |
38 (29.7%) |
90 (70.3%) |
136 (85.0%) |
24 (15.0%) |
|
P |
|
0.393 |
|
0.967 |
|
0.827 |
|
CI (95%) |
1 (Ref.) |
0.71 (0.33, 1.55) |
1 (Ref.) |
1.02 (0.51, 2.03) |
1 (Ref.) |
0.782 (0.09, 7.05) |
|
M20 |
Hyper |
26 (54.2%) |
22 (45.8%) |
18 (23.4%) |
59 (76.6%) |
6 (60.0%) |
4 (40.0%) |
Hypo |
58 (52.3%) |
53 (47.7%) |
37 (33.9%) |
72 (66.1%) |
137 (86.7%) |
21 (13.3%) |
|
P |
|
0.76 |
|
0.071 |
|
0.089 |
|
CI (95%) |
1 (Ref.) |
0.90 (0.44, 1.81) |
1 (Ref.) |
1.88 (0.95, 3.73) |
1 (Ref.) |
3.34 (0.83, 13.41) |
|
M25 |
Hyper |
44 (54.3%) |
37 (45.7%) |
31 (23.5%) |
101 (76.5%) |
17 (73.9%) |
6 (26.1%) |
Hypo |
40 (51.3%) |
38 (48.7%) |
24 (44.4%) |
30 (55.6%) |
126 (86.9%) |
19 (13.1%) |
|
P |
|
0.499 |
|
0.007 |
|
0.125 |
|
CI (95%) |
1 (Ref.) |
0.80 (0.42, 1.53) |
1 (Ref.) |
2.62 (1.29, 5.31) |
1 (Ref.) |
2.37 (0.79, 7.10) |
|
M27 |
Hyper |
23 (50.0%) |
23 (50.0%) |
11 (55.0%) |
9 (45.0%) |
7 (63.6%) |
4 (36.4%) |
Hypo |
61 (54.0%) |
61 (54.0%) |
44 (26.5%) |
122 (73.5%) |
136 (86.6%) |
21 (13.4%) |
|
P |
|
0.623 |
|
0.014 |
|
0.052 |
|
CI (95%) |
1 (Ref.) |
1.19 (0.59, 2.41) |
1 (Ref.) |
0.30 (0.11, 0.78) |
1 (Ref.) |
4.02 (0.99, 16.29) |
|
M30 |
Hyper |
45 (58.4%) |
32 (41.6%) |
33 (24.1%) |
104 (75.9%) |
12 (66.7%) |
6 (33.3%) |
Hypo |
39 (47.6%) |
43 (52.4%) |
22 (44.9%) |
27 (55.1%) |
131 (87.3%) |
19 (12.7%) |
|
P |
|
0.133 |
|
0.005 |
|
0.031 |
|
CI (95%) |
1 (Ref.) |
0.61 (0.32, 1.16) |
1 (Ref.) |
2.80 (1.38, 5.71) |
1 (Ref.) |
3.62 (1.13, 11.63) |
|
a: H.pylori infection positive. b: H.pylori infection negative. c: Hypermethylated cases d: Hypomethylated or no-methylation cases. P value was adjusted by sex age smoking and drinking. P value OR and corresponding 95% interval confidence were calculated to measure the association between H.pylori infection and the risks of hypermethylated CpG site. GC: gastric cancer; AG: atrophic gastritis; CON: control; OR: odd ratio; CI: interval confidence.
DISCUSSION
Products of tumor suppressor genes regulate various cellular functions, and expression of these products can be modified by DNA methylation [22]. Under methylated conditions, RNA polymerase cannot effectively combine with the promoter and thus transcribe the gene, which can lead to tumorigenesis and development of cancer [23]. RNF180 is a recently discovered suppressor gene; its product, Rines, is a membrane-bound E3 ubiquitin ligase with a coiled-coil domain and RING finger [11]. Function studies discovered the RNF180 product could activate apoptosis by up-regulating the factors TIMP3 and CDK2A. It also could inhibit cell proliferation by up-regulating anti-proliferation factors MTSS1 and CDKN2A [12]. Further studies showed RNF180 PM occurred more frequently in GC tissues, and RNF180 was thus less expressed in patients with GC [13]. RNF180 can inhibit tumorigenesis, and its methylation is related to poor prognosis [13, 14]. However, until now, the relationship between the RNF180 PM and the risk of GC or its precancerous condition had not been deeply analyzed. To our knowledge, this is the first report about RNF180 PM and risk of GC or AG. We calculated differences in methylation distribution between CON, AG and GC groups, to identify CpG sites with high sensitivity in distinguishing AG or GC from normal controls. We explored the relationship of the hypermethylation and the expression of RNF180 mRNA and also analyzed the effect of H.pylori infection on RNF180 PM.
First, we compared differences in AMR among the control group (CON), atrophy gastritis group (AG) and gastric cancer group (GC) and found AMR significantly differed between CON, AG and GC, increasing with gastric disease severity (GC > AG > CON). We further evaluated the diagnosis efficacy of AMR. At > 0.153, AMR distinguished GC + AG from controls at 78.6% sensitivity and 77.4% specificity (AUC = 0.802); at > 0.316, AMR distinguished GC from AG + CON was 41.5% sensitive and 87.9% specific (AUC = 0.685).
Reportedly, PM of tumor suppressor genes (RUNX3, CDH1, CDH13, DAPK, GSTP1, etc.) may gradually accumulate with the severity of disease and stimulation of environment factors [24, 25]. We speculate that AG may be part of gastric carcinogenesis, in which RNF180 PM gradually increases, especially the average methylation rate of the RNF180 promoter area. As overall methylation increases over time, RNA polymerase is less able to combine with the promoter area, with expression and translation of RNF180 products down-regulating further, eventually silencing RNF180 [12]. When this process hit a certain level, the cells could undergo an oncologic change [26]. Thus, RNF180 PM is associated with the transformation of gastric cancer.
We therefore propose that AMR could be a biomarker for gastric cancer and its precursor, AG. At AMR > 0.153, we found the highest possibility that gastric tissue was no longer healthy, but was either gastric cancer or precancerous AG, with AMR > 0.316 to be the best cut-off value between GC and AG. Thus, among patients who were already suffering from AG, an RNF180 PM average rate > 0.316 could be considered an indicator of high likelihood of gastric cancer, and of a need for intervention or treatment.
We also analyzed the distribution of methylated or hypermethylated CpG sites count (MSC or HSC) in the CON, AG and GC groups. The results showed that HSC increased gradually with disease severity (GC > AG > CON), although it did not significantly differ between the GC and AG groups. We also found that MSC > 4, among a total 31 CpG sites, was 78.6% sensitive and 77.4% specific (AUC = 0.772) in identifying GC + AG; and MSC > 15 was 81.9% specific in predicting GC. When HSC > 1 among the 31 targeted CpG sites, it was 74.5% sensitive and 83.3% specific in identifying GC and AG (AUC = 0.813); HSC > 6 was 92.1% specific in predicting GC. The results were consistent previous results with AMR. Beside all these results, Therefore, MSC and HSC could also be indicators of GC or GC + AG, and generally rise with the severity of disease. Considering MSC and HSC results were shown almost the same, we advice that these results could be used according to the actual needs. For example, if we want to use lower sensitive method such as MSP or COBRA to identification GC or AG we could use hypermethylated CpG site as a biomarker for primer designing. Besides methylated CpG site can be used to achieve higher sensitivity, so that may achieve early detection of precancerous or gastric cancer.
To find CpG sites with hypermethylation that is most indicative of AG or GC, we further selected hypermethylation occurrence frequency in gastric cancer or atrophic gastritis over than 25% among all 513 individuals are been analyzed. We found that in 5 CpG sites—M3(−165), M7 (−133), M20(−57), M25(−34) and M30(+5)—hypermethylation frequency was highest in the AG group, second-highest in the GC group, and lowest in the control group, and their differences were statistically significant. Besides M5(−148) and M27(−26) hypermethylation frequency was higher in GC group than Non-GC group (AG + CON). Hypermethylation of M5(−148), M27(−26) CpG sites were associated with 5.85 OR (95% CI: 3.20–10.69) and 4.27 OR (95% CI: 2.54–7.19) in GC risk, respectively. Reportedly, 3 CpG sites in the DACT1 gene promoter are related to GC prognosis [27]. Another study showed that hypermethylation of certain CpG sites were related to AG severity [28]. Our study found 5 CpG sites in RNF180 promoter region that were related to AG progression, and 2 CpG sites related to GC risk. These specific CpG sites could be used for early warning of precancerous disease or gastric cancer.
In the previous study, RNF180 transcript was identified to be specially silenced or down-regulated in gastric cancer cells and primary gastric cancer tissues, and the promoter methylation was found to directly mediate RNF180 transcription silencing in vitro [12]. In this study, we detected the quantitative methylation of RNF180 promoter and RNF180 mRNA expression simultaneously in gastric cancer and paired non-tumor tissues. The mRNA expressive level of RNF180 was demonstrated to be significantly lower in tumor tissues than that in non-tumor tissues, and with the same tend as which in hypermethylation tissues than that in hypomethylation tissues. The results of RNF180 gene expression were consistent with Deng’s report [13], and which further suggesting that the aberrant RNF180 mRNA transcription might be resulted from the DNA promoter methylation in vivo.
H.pylori as a class I carcinogen involved in gastric carcinogenesis, and was considered to affect some of tumor suppressor genes through hypermethylation [29]. To determine whether H.pylori infection affected methylation of RNF180 promoter region, we further stratified the CON, AG and GC groups by H.pylori infection to calculate differences of AMR, MSC and HSC between the H.pylori− and H.pylori+ subgroups. We found that AMR and HSC in CON/H.pylori+ subgroup were higher than in the CON/H.pylori− subgroup. In the AG group, the M3(−165), M25(−34) and M30(+5) sites had increased hypermethylation risks of 2.74 folds (95% CI: 1.37–5.47), 2.62 folds (95% CI: 1.29–5.31), 2.80 folds (95% CI: 1.38–5.71), respectively, in the H.pylori+ subgroup than in the H.pylori− subgroup; whereas hypermethylation of the M27(−26) site was higher in H.pylori− subgroup than in the H.pylori+ subgroup. However, only 9 cases showed M27(−26) hypermethylated in the AG subgroup. H.pylori can release a variety of virulent determinants, such as CagA, VacA etc., that are involved in biological changes that eventually lead to AG or GC [21, 30]. H.pylori infection can also lead to abnormal methylation of FOXD3, E-cadherin and other genes, but the methylation status of these genes can be restored after removal of the H.pylori infection, with increases in the products of these genes [17–19]. H.pylori can affect methylation in two ways: overall CpG site methylation, and methylation of certain single CpG sites [31–33]. Our results, together with those of previous reports, indicate that H.pylori infection can increase overall methylation in normal or slightly superficial gastritis tissues, but after AG develops, H.pylori can increase hypermethylation at M3(−165), M25(−34) and M30(+5) in the RNF180 promoter region. Thus, H.pylori infection may vary its modification of RNF180 gene PM under the different disease conditions.
This study had some limitations. First, all subjects were from northern China, and we did not include other geographical or ethnic populations, which may have affected our results. However, considering that 42% of gastric cancers occur in China [34], this study has important reference value. Second, our cohort was rather small, especially the H.pylori+ subgroup with a hypermethylated RNF180 promoter. Therefore, our results should be verified and expanded with a larger and more varied study group.
In summary, this study focused on relationships between methylation of RNF180 promoter and gastric cancer or atrophic gastritis and the effect of H.pylori infection on RNF180 PM. We found, for the first time, that AMR, MSC, and HSC at particular CpG sites within RNF180 promoter region could potentially be an early indicator of gastric cancer and atrophic gastritis. The aberrant expression of RNF180 mRNA levels in tumor might be resulted from the DNA promoter methylation. We also found that H.pylori infection may vary how it modifies methylation in the RNF180 gene promoter under different disease conditions. That is, in normal or superficial gastritis H.pylori tend to affect overall methylation status rather than hypermethylating certain CpG sites. But in atrophic gastritis, H.pylori was more likely to affect certain CpG sites rather than the overall methylation status. This study provides an experimental basis to evaluate RNF180 promoter methylation as a biomarker for early warning and diagnosis of gastric cancer or atrophic gastritis.
MATERIALS AND METHODS
Sample collection
This study was approved by the Human Ethics Review Committee of the First Affiliated Hospital of China Medical University (Shenyang, China). All subjects gave informed consents in accordance with the declaration of Helsinki and its latest revision. We enrolled a total of 513 subjects who had undergone endoscopic examination at the Zhuanghe Gastric Diseases Screening Program and the Surgical Oncology Department in the First Affiliated Hospital of China Medical University between July, 2008 and June, 2010. Out of 513 tissue samples, 168 were normal gastric mucosa or slightly superficial gastritis tissues for the control group (CON), 186 were AG tissues, and 159 were GC tissues. In addition, we collected 55 pairs of fresh tumor tissues and non-tumor tissues from GC patients who underwent curative gastrectomy between 10, 2012 and 10, 2015 at the First Affiliated Hospital of China Medical University for RNF180 gene expression analysis. All the gastric mucosa tissues were histologically verified and their corresponding histological information was collected. Atrophic gastritis and superficial gastritis were classified by the Sydney classification system [20]. Although AG can be histologically classified as mild, moderate or severe, only moderate or severe AG were included in this study. We diagnosed CON tissues as normal stomach, or as mild superficial gastritis if mesenchymal lymphocyte counts were < 30% after excluding other systemic and gastric diseases. None of the patients had received preoperative radiotherapy or chemotherapy. We collected subjects’ age, sex and other relevant clinical information by questionnaire and computerized medical records. Their GC histological diagnoses were based on the World Health Organization’s criteria [16]. Participants’ clinicopathological characteristics are listed in Table 5.
Table 5: Clinicopathological characteristics
|
|
GC (%) |
AG (%) |
CON (%) |
P value |
|---|---|---|---|---|---|
Sex |
Male |
105 (66.0) |
112 (60.2) |
99 (58.9) |
|
|
Female |
54 (34.0) |
74 (39.8) |
69 (41.1) |
0.363 |
Age |
Ave. ± Std. |
58.9 ± 11.7 |
53.4 ± 8.3 |
54.0 ± 7.9 |
< 0.001 |
Smoking |
(–) |
87 (54.7) |
133 (71.4) |
119 (70.8) |
|
|
(+) |
72 (45.3) |
53 (28.5) |
49 (29.2) |
0.001 |
Drinking |
(–) |
104 (65.4) |
144 (77.4) |
129 (76.8) |
|
|
(+) |
55 (34.6) |
42 (22.6) |
39 (23.2) |
0.022 |
H.pylori |
(–) |
84 (52.8) |
55 (29.6) |
143 (85.1) |
|
|
(+) |
75 (47.2) |
131 (70.4) |
25 (14.9) |
< 0.001 |
Total |
513 |
159 |
186 |
168 |
|
GC: gastric cancer; AG: atrophic gastritis; CON:control.
DNA extraction and sodium bisulfite modification
We extracted genomic DNA from 20-μm sections of paraffin-embedded gastric epithelial tissues using paraffin tissue extraction kit (TianGen Biochemistry, Beijing). Sodium bisulfite modification of DNA was preceded by use of the Zymo DNA Methylation-Gold kit (Zymo Research, US). All procedures followed the manufacturers’ instructions.
Enzyme-linked immunosorbent assay (ELISA) for H.pylori infection
Serum immunoglobulin (Ig) G antibodies to H. pylori were detected by H. pylori–IgG enzyme-linked immunosorbent assay (ELISA; Biohit, Helsinki, Finland). Antibody titers were quantified by optical density readings according to manufacturer’s protocol; titers > 34 EIU (threshold value) were considered positive for H.pylori infection.
Bisulfite genomic sequencing
All samples were quantitatively analyzed using bisulfite genomic sequencing (BGS) for the RNF180 promoter area. We amplified the RNF180 promoter area from −224 to +94, for a 319-bp fragment, with these primers: F: 5′-GTGGTTTTGGTAAGGGGATGATCC-3′; R: 5′-AACAACCAAACTCTAAAAACTC-3′ [13]. All methylation PCRs were used HotStart Taq 2.0 Version (Takara, Japan), and these conditions: initial denaturation at 94°C for 3 min; 45 cycles (94°C for 20 sec, 58.5°C for 30 sec, 72°C for 45 sec); followed by a final extension at 72°C for 10 minutes, with a final termination at 4°C. All PCR products were electrophoresed with 2% agarose gel, and staining with Genefinder (Xiamen, Zeeshan Biotechnology); remaining PCR products that shown bright band were used for backward sequence analysis after product purification.
According to the theory of bisulfite modification, unmethylated cytosine changes into uracil, and uracil is replaced by thymine during PCR; whereas methylated cytosine remains the same. The methylation rate of forward sequencing was: Meth% = [C/(C + T)]*100%. Therefore, complementary base pairing should show a methylation rate of reverse sequencing as: Meth% = [G/(G+A)]*100%. The average methylation rate (AMR; the average methylation rate for all CpG sites in each sample) methylated (methylation rate > 0.25) CpG sites count (MSC) and hypermethylated (methylation rate > 0.50) CpG sites count (HSC) was used to quantify methylation status.
In order to further confirm credibility test result, we randomly selected 10 cases of cloning sequencing DNA samples as quality control. The purified PCR products were cloned into the pUC18-T vector (Biodee, Beijing, China), and ten clones for each sample were randomly selected and sequenced (Beijing, Genomics Biotechnology). No significant differences were found between these two methods (P = 0.648, Supplementary Table S2).
Quantitative real-time PCR analysis of RNF180 mRNA expression
55 pairs of gastric cancer tissues and adjacent non-cancer tissues were detected the RNF180 expression by using the quantitative real-time PCR for demonstration the difference of RNF180 mRNA expression between two groups of tissues. RNA was extracted using TRIzol reagent (Life Technologies, Carlsbad, CA) according to the manufacturer’s instructions. Total RNA was converted into complementary DNA using Quantscript RT kit (Tiangen Biotech, Beijing, China). The mRNA levels specific for RNF180 genes and an internal-control gene glyceraldehyde 3-phosphate dehydrogenase (GAPDH) were examined using SYBR Premix Ex Taq II (TaKaRa Biotech, Dalian, China) according to the manufacturer’s protocol. Primers designed and utilized for RNF180 was as follows: Forward sequence: 5′-GTGCAGTGTGTCTGGACGTT-3′, and Reverse sequence: 5′-AATGGGCATGGAGTGCTTGA-3′. Primers designed and utilized for GAPDH was as follows: Forward sequence: 5′-TGCACCACCAACTGCTTAG-3′, and Reverse sequence: 5′-GGATGCAGGGATGATGTTCC-3′. Melting curve analysis was performed to exclude the presence of non-specific products and primer-dimers. Each reaction was performed in duplicates, and no-template controls were included in each experiment.
The relative quantification of gene mRNA expression was calculated using the 2−ΔΔCt method [21]. The expression levels of RNF180 were normalized to those of GAPDH in each sample using the equation: ΔCt (delta Ct) = Cttarget−CtGAPDH. Relative expression levels were derived from ΔCt values as 2−ΔCt. The relative expression of tissues with tumor or hypermethylation were set to a unity, and the relative expression of tissues with non-tumor or hypomethylation were expressed relative to those of tissues with tumor or hypermethylation, thus deriving normalized 2−ΔΔCt values.
Statistical analysis
All statistical analysis was performed using SPSS 20.0 software (SPSS, Chicago, IL, USA). The Paired samples t-test was used to compare differences of the methods between Direct sequencing and Cloning sequencing. The Mann–Whitney U test was used to compare differences in AMR, MSC, HSC and relative mRNA levels among different groups. Receiver operating characteristic (ROC) curves and areas under curves (AUC) were used to analyze GC, AG and CON groups with regard to AMR, MSC and HSC. Multivariate logistic regression with adjustments for age, sex, smoking, drinking and H.pylori infection was used to assess associations between hypermethylation frequency of individual CpG sites and disease risk, and hypermethylation risk for H.pylori infection.
Abbreviations
GC: Gastric cancer; AG: Atrophic gastritis; CON: Control; AMR: Methylation rates; MSC: Methylated CpG site counts; HSC: Hypermethylated CpG site counts; PM: Promoter methylation; H.pylori: Helicobacter pylori. ELISA: Enzyme-linked immunosorbent assay; ROC: Receiver operating characteristic; AUC: Curves and areas under curves.
GRANT SUPPORT
This work is supported by grants from the National Key Basic Research Program of China (973 Program ref no. 2010CB529304).
CONFLICTS OF INTEREST
All authors disclose any conflicts of interest that might bias their work.
REFERENCES
1. Sugiura H, Ishiguro H, Kuwabara Y, Kimura M, Mitsui A, Mori Y, Ogawa R, Katada T, Harata K, Fujii Y. Decreased expression of RUNX3 is correlated with tumor progression and poor prognosis in patients with esophageal squamous cell carcinoma. Oncol Rep. 2008; 19:713–9. doi: 10.3892/or.19.3.713.
2. Veeck J, Wild PJ, Fuchs T, Schuffler PJ, Hartmann A, Knuchel R, Dahl E. Prognostic relevance of Wnt-inhibitory factor-1 (WIF1) and Dickkopf-3 (DKK3) promoter methylation in human breast cancer. BMC Cancer. 2009; 9:217. doi: 10.1186/1471-2407-9-217.
3. Serizawa RR, Ralfkiaer U, Steven K, Lam GW, Schmiedel S, Schuz J, Hansen AB, Horn T, Guldberg P. Integrated genetic and epigenetic analysis of bladder cancer reveals an additive diagnostic value of FGFR3 mutations and hypermethylation events. Int J Cancer. 2011; 129:78–87. doi: 10.1002/ijc.25651.
4. Cheng YY, Yu J, Wong YP, Man EP, To KF, Jin VX, Li J, Tao Q, Sung JJ, Chan FK, Leung WK. Frequent epigenetic inactivation of secreted frizzled-related protein 2 (SFRP2) by promoter methylation in human gastric cancer. Br J Cancer. 2007; 97:895–901. doi: 10.1038/sj.bjc.6603968.
5. Zhang X, Zhang X, Sun B, Lu H, Wang D, Yuan X, Huang Z. Detection of aberrant promoter methylation of RNF180, DAPK1 and SFRP2 in plasma DNA of patients with gastric cancer. Oncol Lett. 2014; 8:1745–50. doi: 10.3892/ol.2014.2410.
6. Mehta A, Dobersch S, Romero-Olmedo AJ, Barreto G. Epigenetics in lung cancer diagnosis and therapy. Cancer Metastasis Rev. 2015; 34:229–41. doi: 10.1007/s10555-015-9563-3.
7. Langevin SM, Kratzke RA, Kelsey KT. Epigenetics of lung cancer. Transl Res. 2015; 165:74–90. doi: 10.1016/j.trsl.2014.03.001.
8. Fanelli M, Fantozzi A, De Luca P, Caprodossi S, Matsuzawa S, Lazar MA, Pelicci PG, Minucci S. The coiled-coil domain is the structural determinant for mammalian homologues of Drosophila Sina-mediated degradation of promyelocytic leukemia protein and other tripartite motif proteins by the proteasome. J Biol Chem. 2004; 279:5374–9. doi:10.1074/jbc.M306407200.
9. Balastik M, Ferraguti F, Pires-da Silva A, Lee TH, Alvarez-Bolado G, Lu KP, Gruss P. Deficiency in ubiquitin ligase TRIM2 causes accumulation of neurofilament light chain and neurodegeneration. Proc Natl Acad Sci U S A. 2008; 105:12016–21. doi: 10.1073/pnas.0802261105.
10. Neumuller RA, Betschinger J, Fischer A, Bushati N, Poernbacher I, Mechtler K, Cohen SM, Knoblich JA. Mei-P26 regulates microRNAs and cell growth in the Drosophila ovarian stem cell lineage. Nature. 2008; 454:241–5. doi: 10.1038/nature07014.
11. Ogawa M, Mizugishi K, Ishiguro A, Koyabu Y, Imai Y, Takahashi R, Mikoshiba K, Aruga J. Rines/RNF180, a novel RING finger gene-encoded product, is a membrane-bound ubiquitin ligase. Genes Cells. 2008; 13:397–409. doi: 10.1111/j.1365-2443.
12. Cheung KF, Lam CN, Wu K, Ng EK, Chong WW, Cheng AS, To KF, Fan D, Sung JJ, Yu J. Characterization of the gene structure, functional significance, and clinical application of RNF180, a novel gene in gastric cancer. Cancer. 2012; 118:947–59. doi: 10.1002/cncr.26189.
13. Deng J, Liang H, Ying G, Zhang R, Wang B, Yu J, Fan D, Hao X. Methylation of CpG sites in RNF180 DNA promoter prediction poor survival of gastric cancer. Oncotarget. 2014; 5:3173–83. doi: 10.18632/oncotarget.1888
14. Xie X, Deng J, Hou Y, Cui J, Wu W, Ying G, Dong Q, Hao X, Liang H. Evaluating the clinical feasibility: The direct bisulfite genomic sequencing for examination of methylated status of E3 ubiquitin ligase RNF180 DNA promoter to predict the survival of gastric cancer. Cancer Biomark. 2015; 15:259–65. doi: 10.3233/CBM-150466.
15. Bhardwaj V, Noto JM, Wei J1, Andl C, El-Rifai W, Peek RM, Zaika AI. Helicobacter pylori bacteria alter the p53 stress response via ERK-HDM2 pathway. Oncotarget. 2015; 6:1531–43. doi: 10.18632/oncotarget.2828.
16. Zaika A, Wei J, Noto J, Peek R, Jr. Regulation of the p53 tumor suppressor by gastric pathogen Helicobacter pylori pathogen. Oncotarget. 2012; 3:1057–8. doi: 10.18632/oncotarget.698.
17. Cheng AS, Li MS, Kang W, Cheng VY, Chou JL, Lau SS, Go MY, Lee CC, Ling TK, Ng EK, Yu J, Huang TH, To KF, et al. Helicobacter pylori causes epigenetic dysregulation of FOXD3 to promote gastric carcinogenesis. Gastroenterology. 2013; 144:122–33. doi: 10.1053/j.gastro.2012.10.002.
18. Leung WK, Man EP, Yu J, Go MY, To KF, Yamaoka Y, Cheng VY, Ng EK, Sung JJ. Effects of Helicobacter pylori eradication on methylation status of E-cadherin gene in noncancerous stomach. Clin Cancer Res. 2006; 12:3216–21. doi: 10.1158/1078-0432.CCR-05-2442
19. Chan AO, Peng JZ, Lam SK, Lai KC, Yuen MF, Cheung HK, Kwong YL, Rashid A, Chan CK, Wong BC. Eradication of Helicobacter pylori infection reverses E-cadherin promoter hypermethylation. Gut. 2006; 55:463–8. doi: 10.1136/gut.2005.077776.
20. Dixon MF, Genta RM, Yardley JH, Correa P. Classification and grading of gastritis. The updated Sydney System. International Workshop on the Histopathology of Gastritis, Houston 1994. Am J Surg Pathol. 1996; 20:1161–81.
21. He C, Tu H, Sun L, Xu Q, Li P, Gong Y, Dong N, Yuan Y. Helicobacter pylori-related host gene polymorphisms associated with susceptibility of gastric carcinogenesis: a two-stage case-control study in Chinese. Carcinogenesis. 2013; 34:1450–7. doi: 10.1093/carcin/bgt079.
22. Baylin SB, Ohm JE. Epigenetic gene silencing in cancer - a mechanism for early oncogenic pathway addiction? Nat Rev Cancer. 2006; 6:107–16. doi:10.1038/nrc1799
23. Jones PA, Baylin SB. The fundamental role of epigenetic events in cancer. Nat Rev Genet. 2002; 3:415–28. doi:10.1038/nrg816.
24. Esteller M. CpG island hypermethylation and tumor suppressor genes: a booming present, a brighter future. Oncogene. 2002; 21:5427–40. doi:10.1038/sj.onc.1205600.
25. Dammann R, Schagdarsurengin U, Seidel C, Strunnikova M, Rastetter M, Baier K, Pfeifer GP. The tumor suppressor RASSF1A in human carcinogenesis: an update. Histol Histopathol. 2005; 20:645–663.
26. Chen HY, Zhu BH, Zhang CH, Yang DJ, Peng JJ, Chen JH, Liu FK, He YL. High CpG island methylator phenotype is associated with lymph node metastasis and prognosis in gastric cancer. Cancer Sci. 2012; 103:73–9. doi: 10.1111/j.1349–7006.2011.02129.x.
27. Deng J, Liang H, Zhang R, Ying G, Xie X, Yu J, Fan D, Hao X. Methylated CpG site count of dapper homolog 1 (DACT1) promoter prediction the poor survival of gastric cancer. Am J Cancer Res. 2014; 4:518–27.
28. Tahara T, Arisawa T, Shibata T, Nakamura M, Yoshioka D, Okubo M, Maruyama N, Kamano T, Kamiya Y, Fujita H, Nakagawa Y, Nagasaka M, Iwata M, et al. Increased number of methylated CpG islands correlates with Helicobacter pylori infection, histological and serological severity of chronic gastritis. European journal of gastroenterology & hepatology. 2009; 21:613–9. doi: 10.1097/MEG.0b013e32830e28b2.
29. Zhang X, Zhang X, Sun B, Lu H, Wang D, Yuan X, Huang Z. Detection of aberrant promoter methylation of RNF180, DAPK1 and SFRP2 in plasma DNA of patients with gastric cancer. Oncol Lett. 2014; 8:1745–50. doi: 10.3892/ol.2014.2410.
30. Mégraud F, Bessède E, Varon C. Helicobacter pylori infection and gastric carcinoma. Clin Microbiol Infect. 2015; 21:984–90. doi: 10.1016/j.
31. Ling ZQ, Ge MH, Lu XX, Han J, Wu YC, Liu X, Zhu X, Hong LL. Ndrg2 promoter hypermethylation triggered by helicobacter pylori infection correlates with poor patients survival in human gastric carcinoma. Oncotarget. 2015; 6:8210–25. doi: 10.18632/oncotarget.3601.
32. Rodriguez-Paredes M, Esteller M. Cancer epigenetics reaches mainstream oncology. Nature medicine. 2011; 17:330–9. doi: 10.1038/nm.2305.
33. Taby R, Issa JP. Cancer epigenetics. CA Cancer J Clin. 2010; 60:376–92. doi: 10.3322/caac.20085.
34. World Health Organization. Fact Sheet No 297, Cancer. 2009.