
INTRODUCTION
Hepatocellular carcinoma (HCC) is one of the most common malignant tumors, with high morbidity and mortality rates worldwide, especially in the developing countries of East Asia [1–3]. It is responsible for > 600,000 deaths annually and ~750,000 new cases are diagnosed every year [1–3]. Metastasis, the phenomenon by which tumor cells break away from a primary site, circulate through the bloodstream, infiltrate vascular and lymphatic vessels, and settle and proliferate elsewhere in the body, is a complicated pathological process responsible for a poor prognosis [4]. Intervention in metastasis is a potential approach to treating cancer [5, 6]. Before migration, cells often exhibit a series of morphological changes, such as the epithelial-mesenchymal transition (EMT), which is recognized as a critical process that involves morphological changes and increases the invasiveness of cancer cells, cancer progression, and metastasis [7–10]. Cells that undergo the EMT often lose epithelial adhesion and cytoskeletal components, express mesenchymal components, and acquire a migratory phenotype [11]. Despite much research, the signaling mechanisms that trigger the EMT and migration are not fully understood.
Eukaryotic translation initiation factor 5A2 (eIF5A2), an isoform of eIF5A, is a well-conserved protein found in all organisms. eIF5A2 on human chromosome 3q26.2 has been identified as a novel oncogene in cancer [12, 13]. eIF5A2 is the only cellular protein that contains the unusual amino-acid hypusine [N(ε)-(4-amino-2-hydroxybutyl)lysine]. Inhibition of eIF5A2 activity by N1-guanyl-1, 7-diaminoheptane (GC7), an inhibitor of deoxyhypusine synthase, has strong anti-tumor effects on human cancer cells [14]. For example, GC7 combination therapy enhances the therapeutic efficacy of doxorubicin in bladder cancer and estrogen-negative breast cancer cells by inhibiting eIF5A2 activation and preventing the EMT [15, 16]. Moreover, in many cancers, eIF5A2 plays a vital role in EMT progression by transcriptional inhibition of different downstream molecules [17, 18].
Excessive reactive oxygen species (ROS) can cause fatal lesions in cells under oxidative stress conditions, leading to many diseases including cancers [19]. The connection between ROS and cancer is complicated, because each type of ROS has a specific effect on cancer cells [20]. Increasing numbers of studies suggest a close correlation between ROS and cancer metastasis [21], i.e., ROS serve as signaling molecules in cancer cell proliferation and migration and can directly oxidize important cellular proteins [22].
In this study, we first analyzed the distribution of eIF5A2 expression in tissue microarrays to explore its relationship with prognosis. eIF5A2 was significantly overexpressed in human HCC tissue samples compared with adjacent tissues. Interestingly, GC7 reduced the intracellular ROS levels. Thus, we performed further experiments to investigate the roles of ROS in the eIF5A2-induced EMT and HCC invasion and metastasis. The results implied that inhibition of eIF5A2 reduces the invasion and metastasis of HCC cells via pathways involving ROS.
RESULTS
Inhibition of eIF5A2 reduced the invasion and migration of HCC cells in vitro
Wound-healing assays were performed to determine the association between eIF5A2 and the migratory capacity of HCC cells, while their invasiveness was tested by transwell assays. Based on previous reports and preliminary experiments, 50 μM GC7, which inhibits eIF5A2 activation, and 100 nM eIF5A2 siRNA, which silences eIF5A2 expression, were used. Wound-closure in the GC7 and eIF5A2 siRNA groups was significantly slower than in the control groups. Particularly, changes in SUN449 cells demonstrated that suppression of eIF5A2 reduced the migratory ability of HCC cells in vitro (Figure 1A, 1B). Interestingly, all six HCC cell lines showed lower invasiveness in the presence of GC7 or eIF5A2 siRNA transfection (Figure 1C, 1D). To confirm the ability of eIF5A2 siRNA transfection to knock down the expression of eIF5A2, western blotting was used to assess eIF5A2 protein in the six cell lines (Figure 1E, 1F).
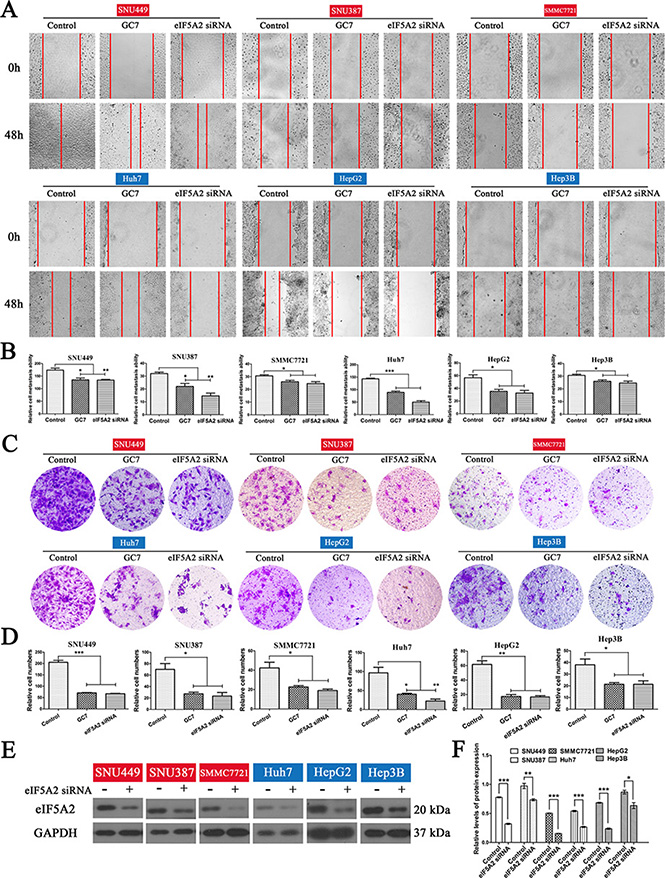
Figure 1: Effects of eIF5A2 on the invasion and metastasis of HCC cells. (A) Representative phase-contrast images of wound closure of six HCC cell lines treated with GC7 (50 μM) or transfected with eIF5A2 siRNA (100 nM) at 0 and 48 h after creating the wound (magnification 100 ×). (B) Bar graphs based on quantitative data from (A). Data are mean ± SEM. *P < 0.05, **P < 0.01, ***P < 0.001 versus control. (C) Representative photographs of invasion in the GC7 and eIF5A2 siRNA groups compared with the control groups in transwell assays (magnification 100 ×). (D) Graphs based on quantitative data from (C). Data are mean ± SEM. *P < 0.05, **P < 0.01, ***P < 0.001 versus control. (E) Western hybridization confirming the effect of eIF5A2 siRNA transfection. (F) Bar graphs based on quantitative data from (E). Data are mean ± SEM. *P < 0.05, **P < 0.01, ***P < 0.001 versus control. Each experiment was repeated at least three times.
Inhibition of eIF5A2 reduced the expression levels of ROS-related genes
On the basis of the gene expression profiles of HCC cells under various conditions, we identified a possible correlation between the inhibition of eIF5A2 and gene expression changes. Interestingly, the expression of a large number of genes was affected in SUN449 cells treated with 50 μM GC7, and the results suggested that GC7 inhibits the expression levels of some genes (Supplementary Figure S1A, S1C), especially ROS-related genes (Figure S1B). Real-time PCR results also reflected the mRNA levels of ROS-related genes, such as SOD1, CAT, and NOS3 (Figure S1D). To confirm the expression levels of ROS-related genes, western hybridization was used to assess the SOD1, SOD3, and NOS3 proteins in the six cell lines (Figure S1E). The SOD1, SOD3, and NOS3 expression in the six GC7-treated HCC cells was higher than in untreated HCC cells, especially SNU449 cells.
The expression of eIF5A2 was higher in the nuclei of HCC cells
To investigate the expression of eIF5A2 in HCC samples, an HCC tissue microarray containing 90 pairs of HCC specimens was analyzed. The results of nonparametric unpaired Wilcoxon tests showed that the expression of eIF5A2 in the nucleus of HCC samples was markedly higher than in adjacent tissues (P = 0.0001), but the eIF5A2 expression in the cytoplasm of HCC samples did not differ from that in adjacent tissues (P = 0.342) (Table 1). Immunohistochemical staining for the eIF5A2 protein in representative samples of HCC tissues and their paired adjacent tissues are shown in Figure 2A and 2B.
Table 1: Analysis of the differences in eIF5A2 expression between HCC and adjacent tissues
|
Mean ± SD |
P-value |
|---|---|---|
Intranuclear |
|
|
eIF5A2 expression in HCC tissues |
1.233 ± 2.249 |
0.0001 |
eIF5A2 expression in adjacent tissues |
0.092 ± 0.547 |
|
Intracytoplasmic |
|
|
eIF5A2 expression in HCC tissues |
5.117 ± 2.958 |
0.342 |
eIF5A2 expression in adjacent tissues |
4.622 ± 2.393 |
|
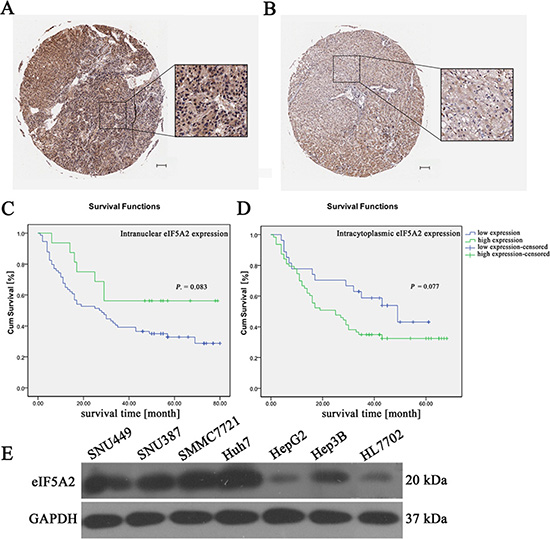
Figure 2: The relationship between eIF5A2 expression and overall survival. (A and B) Representative immunohistochemical images showing the overexpression of eIF5A2 in HCC tissue (A) and its expression in adjacent tissue (B) (scale bars, 100 μm). (C) Kaplan-Meier curves for overall survival time in 90 HCC patients plotted according to their intranuclear expressions of eIF5A2; P = 0.083 by the log-rank test. (D) Kaplan-Meier curves for overall survival rates of 90 HCC patients based on the intracytoplasmic expression of eIF5A2; P = 0.077 by the log-rank test. (E) Western hybridization reflecting the expression of eIF5A2 in six HCC cell lines and normal human liver cells (HL7702).
eIF5A2 overexpression was associated with poor overall survival and prognosis
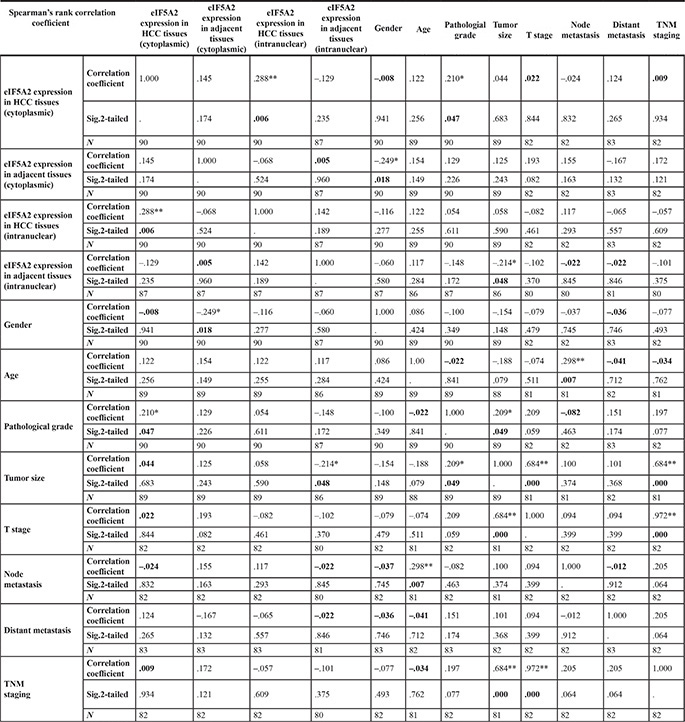
Correlation analysis of clinicopathological characteristics and eIF5A2 expression showed that the expression of eIF5A2 was closely associated with node metastasis, distant metastasis, and tumor-node-metastasis staging (Table 2). Kaplan-Meier curves showed that eIF5A2 overexpression in HCC was associated with poor overall survival and prognosis. Intranuclear expression of eIF5A2 differed between HCC tissues and their paired adjacent tissues (P = 0.083) (Figure 2C). The intracytoplasmic expression of eIF5A2 showed a similar predisposition (P = 0.077) (Figure 2D). Compared to normal human liver cells (HL7702), we also found that the eIF5A2 expression was increased in all HCC cell lines except for HepG2 cells (Figure 2E).
Table 2: Correlation analysis of clinicopathological characteristics and eIF5A2 expression
GC7 reduced intracellular ROS levels
To evaluate the changes in cellular ROS levels after GC7 treatment (50 μM) for 24 h, dichlorodihydro-fluorescein diacetate (DCFH-DA) was used as a probe. The mean fluorescence intensity from flow cytometry revealed that GC7 significantly reduced the intercellular levels of ROS (Figure 3A, 3B). N-acetylcysteine (NAC), a ROS inhibitor, eliminated cellular ROS (Figure 3C, 3D). GC7 did not reduce the intercellular levels of ROS further in the six HCC cell lines treated with 50 μM NAC (Figure 3E, 3F).
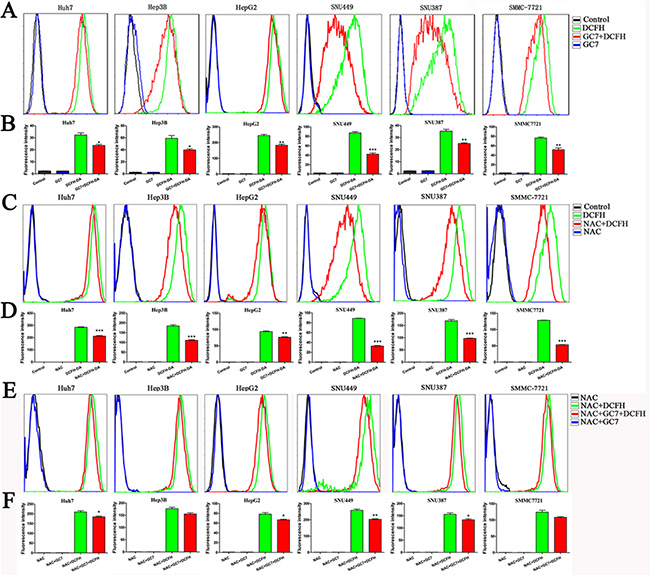
Figure 3: The changes of ROS levels under different conditions. (A) ROS levels quantified by flow cytometry in the presence or absence of 30 μM GC7, compared with the control group. The fluorescence intensity was used to reflect the ROS levels with DCFH-DA (20 μM), which is a common probe. (B) Bar graphs showing the data based on (A). Data are mean ± SEM. *P < 0.05, **P < 0.01, ***P < 0.001 versus control. (C) The fluorescence intensity changes showed that NAC eliminated cellular ROS compared with the control group probed by DCFH-DA. (D) Bar graphs showing the data according to (C). Data are mean ± SEM. *P < 0.05, **P < 0.01,***P < 0.001 versus control. (E) The changes of ROS levels in six HCC cell lines with 50 μM NAC in the presence or absence of 30 μM GC7, compared with the control group. The fluorescence intensity was used to reflect the ROS levels. (F) Bar graphs showing the data based on (E). Data are mean ± SEM. *P < 0.05, **P < 0.01,***P < 0.001 versus control. Each experiment was repeated at least three times.
Inhibition of ROS suppressed invasion and metastasis in HCC cells
To investigate whether the inhibition of ROS had any effect on the invasion and metastasis of HCC cells, the cell lines were cultured with NAC, which suppresses intracellular ROS. NAC significantly suppressed metastasis in liver cancer cells (Figure 4A, 4B). Notably, the results of transwell assays also showed that the NAC group had significantly lower invasiveness than the control group (Figure 4E, 4F).
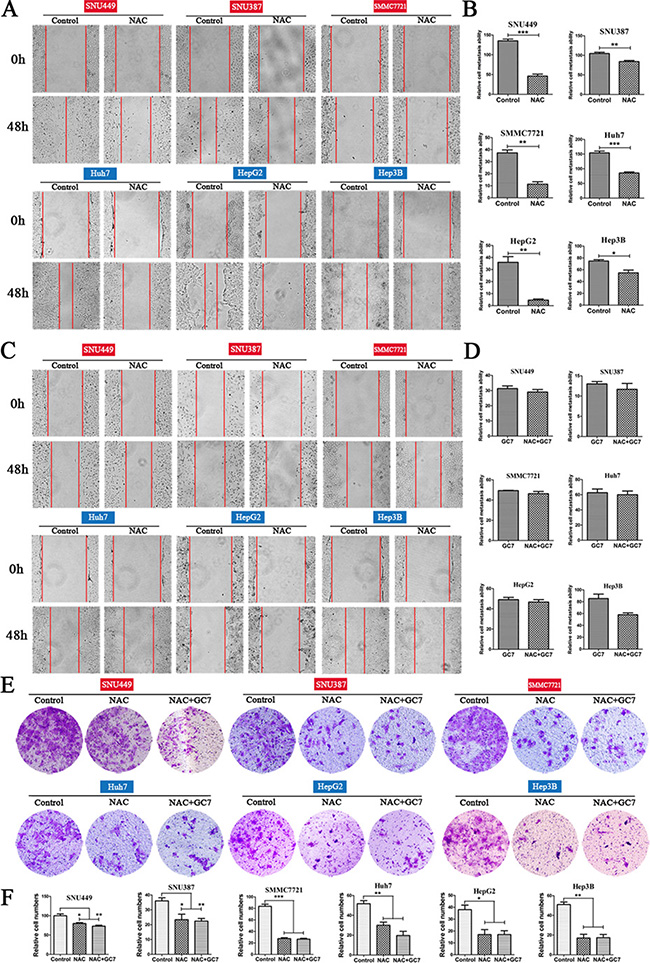
Figure 4: Effects of NAC and NAC plus GC7 on the invasion and metastasis of HCC cells. (A) Wound-closure in the presence or absence of NAC (representative phase-contrast images at 0 and 48 h after creating the wound; magnification 100 ×). (B) Bar graphs based on quantitative data from (A). Data are mean ± SEM. *P < 0.05, **P < 0.01,***P < 0.001 versus control. (C) Wound-closure of cells cultured with NAC (50 μM) in the presence or absence of GC7 (magnification 100 ×). (D) Graphs based on quantitative data from (C). Data are mean ± SEM. (E) Representative photographs of transwell experiments showing that NAC suppressed cell invasion. (F) Bar graphs based on quantitative data from (E). Data are mean ± SEM. *P < 0.05, **P < 0.01,***P < 0.001 versus control. Each experiment was repeated at least three times.
GC7 did not further suppress invasion and migration in HCC cells after NAC treatment
Interestingly, there was no significant difference in the metastatic activity of cells treated with NAC plus GC7 and those with NAC alone. This indicated that GC7 did not further suppress the invasion and migration in HCC cells treated with NAC (Figure 4C, 4D). Similarly, the results of transwell invasion assays showed that GC7 did not inhibit invasion when cells were treated with NAC (Figure 4E, 4F).
Inhibition of eIF5A2 and ROS level changes reversed the EMT in HCC cells
Since eIF5A2 triggers progression of the EMT [15], it is likely that inhibition of eIF5A2 reverses the EMT in HCC cells by affecting the expression of EMT markers. To test this hypothesis, the expression of epithelial and mesenchymal markers in liver cancer cells treated with GC7 or NAC for 24 h was assessed. We found that the administration of GC7 or NAC significantly enhanced the expression of E-cadherin (an epithelial marker), and decreased the expression of vimentin (a mesenchymal marker) in HCC cells, indicating that GC7 and NAC reverse progression of the EMT (Figure 5A, 5B, 6A, 6C). Moreover, the results of immunofluorescent staining were consistent with those of western blotting (Figure 5C, 6C).
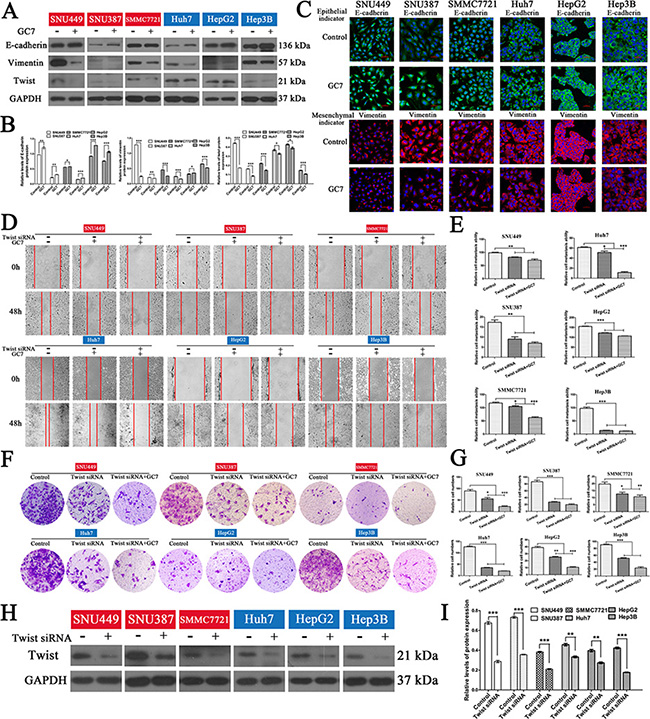
Figure 5: GC7 altered EMT progress and did not inhibit the invasion and migration of HCC cells after blocking the EMT. (A) Expression of E-cadherin, vimentin, and twist in cells were cultured in the presence or absence of GC7 (50 μM) for 24 h. GAPDH served as a loading control. (B) Bar graphs based on quantitative data from (A). Data are mean ± SEM. *P < 0.05, **P < 0.01,***P < 0.001 versus control. (C) Immunofluorescence staining for E-cadherin (green), an epithelial marker, and vimentin (red), a mesenchymal marker, in six HCC cell lines cultured in the presence or absence of GC7 for 24 h. Nuclei were counterstained with DAPI. Scale bars, 50 μm. (D) Representative photographs of wound-healing assays at 0 and 48 h after creating a wound (magnification 100 ×). Cells were divided into three groups: control, GC7, and GC7 plus twist siRNA transfection. (E) Bar graphs based on quantitative data from (D). Data are mean ± SEM. *P < 0.05, **P < 0.01,***P < 0.001 versus control. (F) Representative photographs of crystal violet-stained cells after twist siRNA transfection in the presence or absence of GC7 for 48 h in transwell experiments (magnification 100 ×). (G) Bar graphs based on quantitative data from (F). Data are mean ± SEM. *P < 0.05, **P < 0.01,***P < 0.001 versus control. (H) Western hybridization confirmed the effect of twist siRNA transfection. (I) Bar graphs based on quantitative data from (H). Data are mean ± SEM. *P < 0.05, **P < 0.01,***P < 0.001 versus control. Each experiment was repeated at least three times.
The effects of GC7 and NAC on invasion and migration in HCC cells were partially suppressed after blocking the EMT
In order to determine whether the effects of GC7 or NAC on invasion and metastasis act via the EMT in HCC cells, small interfering RNA (siRNA) experiments were performed to knock down the expression of twist to block the EMT in HCC cells. So, cells transfected with twist siRNA were incubated with NAC or GC7 for 24 h. Interestingly, the wound-healing and transwell assays revealed that the invasion and metastasis of cells treated with GC7 plus twist siRNA (Figure 5D, 5G) or NAC plus twist siRNA (Figure 6D, 6G) did not differ significantly from twist siRNA-transfected cells. To confirm the effect of twist siRNA transfection, western hybridization was performed to detect the twist expression in the six cell lines (Figure 5H, 5I, 6H, 6I). Taken together, these data demonstrated that the effects of GC7 and NAC on the invasion and migration of HCC cells were partly suppressed after blocking the EMT.
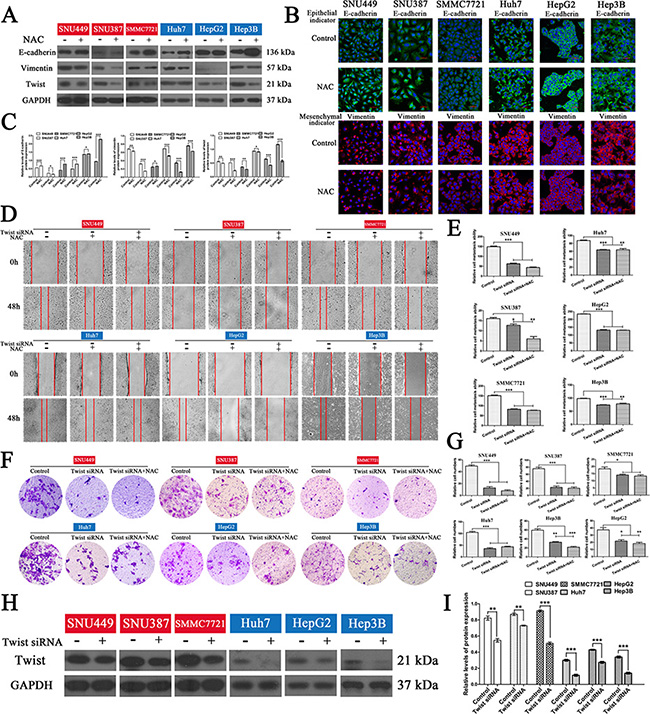
Figure 6: NAC reversed the EMT in HCC cells and the inhibitory effects on invasion and migration of HCC cells were reduced after blocking the EMT. (A) Western blotting and (B) inverted confocal microscopic images (scale bars, 50 μm) showing the expression of E-cadherin (epithelial marker: green) and vimentin (mesenchymal marker: red) in HCC cells. Nuclei were counterstained with DAPI. (C) Bar graphs based on quantitative data from (A). Data are mean ± SEM. *P < 0.05, **P < 0.01,***P < 0.001 versus control. (D) Wound-closure control, NAC, and NAC plus twist siRNA transfection groups. Representative photographs at 0 and 48 h after creating a wound (magnification 100 ×). (E) Bar graphs based on quantitative data from (D). Data are mean ± SEM. *P < 0.05, **P < 0.01, ***P < 0.001 versus control. (F) Transwell chambers were used to determine the invasion of cells after twist siRNA transfection in the presence or absence of NAC for 48 h (representative photographs, magnification 100 ×). (G) Bar graphs based on quantitative data from (F). Data are mean ± SEM. *P < 0.05, **P < 0.01,***P < 0.001 versus control. (H) Western hybridization confirmed the effect of twist siRNA transfection. (I) Bar graphs based on quantitative data from (H). Data are mean ± SEM. *P < 0.05, **P < 0.01,***P < 0.001 versus control. Each experiment was repeated at least three times.
DISCUSSION
Recent studies have reported that eIF5A2 is aberrantly expressed in several types of tumor cells, including rectal carcinoma, gastric cancer, ovarian cancer, bladder cancer, and colon cancer [18, 23–25]. Thus, it is believed that eIF5A2 is a vital oncogene in carcinogenesis. We detected the expression profiles of eIF5A2 in HCC tissues to explore the correlation between eIF5A2 and tumor prognosis. Compared with adjacent tissues, the expression of eIF5A2 in the nucleus of human HCC samples was markedly higher (P = 0.0001). In contrast, the intracytoplasmic expression of eIF5A2 in HCC tissues was somewhat lower than in adjacent tissues (P = 0.342). Kaplan-Meier curves clearly showed that eIF5A2 overexpression was associated with poor overall survival and the prognosis of HCC. The P value as analyzed by the log-rank test, which reflected the relationship between the intranuclear expression of eIF5A2 and overall survival in 90 HCC patients, was 0.083. In comparison, the P value of the intracytoplasmic expression of eIF5A2 was 0.077. These results suggested that eIF5A2 overexpression might play a role in the prognosis of HCC, although the P-values of the cytoplasmic expression of eIF5A2 were not less than 0.05, which might be explained by the small number of tissue samples investigated.
The EMT plays a vital role in cancer invasion and metastasis [26]. Moreover, previous reports have demonstrated that eIF5A2 is also associated with EMT progression in many cancers including colorectal carcinoma and HCC [18, 27]. However, the underlying mechanisms are not fully understood. Previous studies have shown that eIF5A2 eliminates the augmentation of carcinoma cell migration, invasion, and the EMT through down-regulating MTA1 (metastasis-associated 1) [18]. Interestingly, here we found relevant relationships between eIF5A2 and ROS gene expression as GC7 significantly reduced the intracellular levels of ROS. It is noteworthy that ours is the first to report this. To identify which genes might be affected by GC7, we treated cells with GC7 and used a microarray to identify genes showing differences in expression. The heat-map indicated that the mRNA levels of the ROS-related genes SOD1, SOD3, and NOS3 were affected. Superoxide dismutases (SODs) are enzymes that catalyze the removal of superoxide free-radicals [28]. The expression of SOD1 and SOD3 increased, and this may contribute to the elimination of intracellular ROS levels. These clues hinted at the effects of ROS on the eIF5A2-mediated EMT.
Previous studies have reported that the ROS-regulated genes relevant to the EMT, metastasis, and invasion include E-cadherin, integrin, and matrix metalloproteinases [29–31]. As signaling messengers, ROS are able to oxidize critical target molecules such as protein kinase C and protein tyrosine phosphatases [32]. In this research, we also found that ROS induced the EMT in HCC cells. Inhibition of ROS by NAC resulted in E-cadherin up-regulation and vimentin down-regulation. It is interesting that ROS suppression by NAC also inhibited the EMT progression induced by eIF5A2, which confirmed the effects of ROS on the process of eIF5A2-mediated EMT. Furthermore, our in vitro studies showed that ROS was responsible for the invasion and metastasis of HCC cells induced by eIF5A2, as the administration of GC7 did not attenuate the invasion and metastasis of HCC cells further after reduction of the ROS levels by NAC. The fact that the inhibitory effects of GC7 and NAC on invasion and migration were attenuated after blocking the EMT showed that both GC7 and NAC act via the EMT to suppress the invasion and migration of HCC cells.
In conclusion, our results indicated that inhibition of eIF5A2 reverses the EMT to reduce invasion and metastasis via ROS-related pathways. ROS might serve as potential targets in eIF5A2-induced HCC invasion and metastasis [33]. Therefore, further studies on how eIF5A2 changes ROS levels to increase cell migration are required.
MATERIALS AND METHODS
Cell lines and cell cultures
The six human HCC cell lines SNU387, SNU449, SMMC7721, Huh7, Hep3B, and HepG2 were obtained from the American Type Culture Collection (ATCC, Manassas, VA, USA). Huh7 and HepG2 cells were cultured in DMEM (Gibco, Carlsbad, CA, USA) supplemented with 10% fetal bovine serum (FBS) (Gibco). Hep3B cells were cultured in MEM (Gibco) with 10% FBS. SNU387, SNU449 and SMMC7721 cells were cultured in RPMI-1640 medium (Gibco) containing 10% FBS. All cells were maintained at 37°C in a humidified atmosphere containing 5% CO2 in air.
Chemicals and antibodies
NAC and DCFH-DA were from Sigma-Aldrich (St. Louis, MO, USA). GC7 was from Calbiochem (San Diego, CA, USA). The eIF5A2 siRNA, Twist 1 siRNA, Twist 2 siRNA, and the negative control siRNA were from Santa Cruz Biotechnology (Santa Cruz, CA, USA). The X-tremeGENE siRNA transfection reagent was from Roche (Roche Applied Science, Penzberg, Germany). Trizol reagent was from Invitrogen (Carlsbad, CA, USA). Monoclonal rabbit anti-human antibodies against E-cadherin and vimentin, and monoclonal mouse anti-human antibodies against Twist, eIF5A2, and GAPDH were from Santa Cruz Biotechnology. Secondary anti-rabbit HRP-conjugated antibodies and secondary anti-mouse HRP-conjugated antibodies were from Bioworld (Louis Park, MN, USA).
Intracellular ROS measurement
DCFH-DA is a widely-used probe for cellular ROS. Cells (2 × 10⁵/well) in a 6-well plate were incubated with GC7 (50 μM) or NAC (50 μM) for 24 h. After incubation in serum-free medium containing 20 μM DCFH-DA for 20 min, cells in each well were washed three times with phosphate buffer solution (PBS), digested by pancreatin, and immediately subjected to ROS measurement by flow cytometry (Cytomics FC 500 MCL, Beckman Coulter, USA). The wavelength was 488 nm for excitation and 525 nm for emission.
Western hybridization
Cells were cultured overnight at 5 × 10⁴ cells per well in six-well tissue culture plates. After adherence, the cells were treated with GC7 (50 μM) or NAC (50 μM) for 24 h. To assess the protein levels of E-cadherin, vimentin, and twist, cells were washed twice in ice-cold PBS and lysed in 100 μL cell lysis buffer (Cell Signaling, Danvers, MA, USA) with protease inhibitors (Sigma-Aldrich). After centrifugation, the supernatants were collected and protein concentrations were measured using a BCA protein kit (Thermo Fisher, Rockford, IL, USA). Cell lysates (50 μg/lane) were separated on 10% SDS-PAGE and proteins were transferred to polyvinylidene difluoride (PVDF) membranes (Millipore, Billerica, MA, USA). The membranes were then blocked with Tris-buffered saline (TBS) containing 0.1% Tween 20 (TBS/T) and 5% bovine serum albumin (BSA). The PVDF membranes were then incubated with rabbit monoclonal anti-E-cadherin, anti-vimentin (1:1 000), and mouse monoclonal anti-twist, anti-GAPDH, and anti-eIF5A2 (1:1 000) antibodies overnight at 4°C, washed three times with TBS/T, and then incubated with the appropriate HRP-conjugated secondary antibodies (1:1 000) for 2 h at room temperature. The protein bands were detected by chemiluminescence (GE Healthcare, Piscataway, NJ, USA) and visualized by autoradiography on X-ray films (Kodak, Rochester, NY, USA). The protein levels were normalized to that of GAPDH.
Small interfering RNAs
Cells were transfected with eIF5A2 siRNA, Twist 1 siRNA, Twist 2 siRNA, or negative control siRNA (100 nM) using the X-tremeGENE siRNA transfection reagent (Roche), according to the manufacturer’s instructions. The transfection medium (Opti-MEM; Gibco) was replaced with culture medium 8 h after transfection. All subsequent experiments were performed 24 h after transfection and repeated in triplicate.
Transwell-Matrigel invasion assay
After transfection with eIF5A2 siRNA, Twist 1 siRNA, or Twist 2 siRNA (100 nM) for 8 h or treatment with GC7 or NAC for 24 h, cells were seeded at 2 × 10⁵ cells/well in the upper chamber of 8-μm pore-size Transwell 24-insert plates (Corning, NY, USA) with appropriate medium without FBS. The upper chambers had been coated previously with 30 μg Matrigel (BD Biosciences, San Jose, CA, USA) and the lower chamber contained the appropriate medium with 10% FBS. After 48 h, cells on the upper side of the filters were cleansed with cotton swabs, and those on the bottom of the inserts were fixed in 4% paraformaldehyde for 30 min and stained with 0.05% crystal violet. Cells that had invaded to the lower surface were counted in at least 10 fields using an inverted phase-contrast microscope (Olympus; magnification, 20 ×) and photographed. Each experiment was repeated at least three times.
Wound-healing assay
Cells were seeded into six-well plates at 2 × 10⁵ cells/well and cultured for 16–24 h until cells reached ~90% confluence. After transfection with eIF5A2, Twist 1, or Twist 2 siRNA (10 μmol/mL), or treatment with GC7 or NAC for 24 h, a scratch wound was made with a sterile pipette tip in the middle of the confluent monolayer, and the medium was changed to the appropriate medium without FBS after the detached cells were washed away. Photographs were taken using an inverted phase-contrast microscope (Olympus; magnification, 40 ×) at 0, 24, and 48 h. The closing of the scratch wound was measured and wound closure was expressed as a percentage compared with the size of the initial opening caused by scratching. Each experiment was repeated at least three times.
Immunofluorescence confocal microscopy
Cells (5 × 10⁴ cells/mL) were maintained in 15-mm round-bottomed culture dishes (Nest Biotechnology, Ltd, China) for 24 h under various conditions, fixed with 4% paraformaldehyde for 30 min, permeabilized for 10 min at room temperature with 0.5% Triton X-100 in PBS, and blocked with 1% BSA for 1 h. Cells were incubated overnight at 4°C with primary antibodies recognizing E-cadherin and vimentin (1:200) in 5% FBS. The cells were then incubated with Alexa-Fluor 488-conjugated anti-rabbit (1:200) and Alexa-Fluor 550-conjugated anti-mouse (1:200) antibodies for 2 h at room temperature, washed three times with PBS, and mounted with 4′, 6-diamidino-2-phenylindole (DAPI) (Sigma). Fluorescence was visualized with an inverted confocal microscope (Nikon A1R; magnification, 40 ×). Images were captured using a Nikon digital camera and analyzed by NIS-Elements Viewer software. Each experiment was repeated at least three times.
Statistical analysis
Data are presented as mean ± standard error of the mean (SEM). In Table 1, data are presented as mean ± standard deviation (SD). For statistical analysis, unpaired t-tests were applied. A P value < 0.05 was considered statistically significant. All experiments were performed independently in triplicate.
ACKNOWLEDGMENTS AND FUNDING
We appreciate Prof. Xun Hu from the Second Affiliated Hospital of Zhejiang University School of Medicine for providing technical guidance in the completion of this article. This study was supported by the National 973 Basic Research Program of China (2013CB911303) and the National Natural Science Foundation of China (81450065).
CONFLICTS OF INTEREST
The authors have no potential conflicts of interest to disclose.
REFERENCES
1. Torre LA, Bray F, Siegel RL, Ferlay J, Lortet-Tieulent J, Jemal A. Global cancer statistics, 2012. CA Cancer J Clin. 2015; 65:87–108.
2. Singal AG, El-Serag HB. Hepatocellular carcinoma from epidemiology to prevention: translating knowledge into practice. Clin Gastroenterol Hepatol. 2015; 13:2140–2151.
3. He L, Tian DA, Li PY, He XX. Mouse models of liver cancer: Progress and recommendations. Oncotarget. 2015; 6:23306–23322. doi: 10.18632/oncotarget.4202.
4. Kopfstein L, Christofori G. Metastasis: cell-autonomous mechanisms versus contributions by the tumor microenvironment. Cell Mol Life Sci. 2006; 63:449–468.
5. Liu Z, Zhang B, Liu K, Ding Z, Hu X. Schisandrin B attenuates cancer invasion and metastasis via inhibiting epithelial-mesenchymal transition. PLoS One 2012; 7:e40480.
6. Zomer A, Maynard C, Verweij FJ, Kamermans A, Schäfer R, Beerling E, Schiffelers RM, de Wit E, Berenguer J, Ellenbroek SI, Wurdinger T, Pegtel DM, van Rheenen J. In vivo imaging reveals extracellular vesicle-mediated phenocopying of metastatic behavior. Cell. 2015; 161:1046–1057.
7. Gonzalez DM, Medici D. Signaling mechanisms of the epithelial-mesenchymal transition. Sci Signal. 2014; 7:re8.
8. Peinado H, Olmeda D, Cano A. Snail, Zeb and bHLH factors in tumour progression: an alliance against the epithelial phenotype? Nat Rev Cancer. 2007; 7:415–428.
9. Cannito S, Novo E, di Bonzo LV, Busletta C, Colombatto S, Parola M. Epithelial-mesenchymal transition: from molecular mechanisms, redox regulation to implications in human health and disease. Antioxid Redox Signal. 2010; 12:1383–1430.
10. Thiery JP, Acloque H, Huang RYJ, Nieto MA. Epithelial-mesenchymal transitions in development and disease. Cell. 2009; 139:871–890.
11. Liu H, Zhang X, Li J, Sun B, Qian H, Yin Z. The biological and clinical importance of epithelial-mesenchymal transition in circulating tumor cells. J Cancer Res Clin Oncol. 2015; 141:189–201.
12. Caraglia M, Park MH, Wolff EC, Marra M, Abbruzzese A. eIF5A isoforms and cancer: two brothers for two functions? Amino Acids. 2013; 44:103–109.
13. Wang FW, Cai MY, Mai SJ, Chen JW, Bai HY, Li Y, Liao YJ, Li CP, Tian XP, Kung HF, Guan XY, Xie D. Ablation of EIF5A2 induces tumor vasculature remodeling and improves tumor response to chemotherapy via regulation of matrix metalloproteinase 2 expression. Oncotarget. 2014; 5:6716–6733. doi: 10.18632/oncotarget.2236.
14. Lou B, Fan J, Wang K, Chen W, Zhou X, Zhang J, Lin S, Lv F, Chen Y. N1-guanyl-1, 7-diaminoheptane (GC7) enhances the therapeutic efficacy of doxorubicin by inhibiting activation of eukaryotic translation initiation factor 5A2 (eIF5A2) and preventing the epithelial-mesenchymal transition in hepatocellular carcinoma cells. Exp Cell Res. 2013; 319:2708–2717.
15. Yang J, Yu H, Shen M, Wei W, Xia L, Zhao P. N1-guanyl-1, 7-diaminoheptane sensitizes bladder cancer cells to doxorubicin by preventing epithelial mesenchymal transition through inhibition of eukaryotic translation initiation factor 5A2 activation. Cancer Sci. 2014; 105:219–227.
16. Liu Y, Liu R, Fu P, Du F, Hong Y, Yao M, Zhang X, Zheng S. N1-guanyl-1, 7-diaminoheptane sensitizes estrogen receptor negative breast cancer cells to Doxorubicin by preventing epithelial-mesenchymal transition through inhibition of eukaryotic translation initiation factor 5A2 activation. Cell Physiol Biochem. 2015; 36:2494–2503.
17. Zender L, Xue W, Zuber J, Semighini CP, Krasnitz A, Ma B, Zender P, Kubicka S, Luk JM, Schirmacher P, McCombie WR, Wigler M, Hicks J, et al. An oncogenomics-based in vivo RNAi screen identifies tumor suppressors in liver cancer. Cell. 2008; 135:852–864.
18. Zhu W, Cai MY, Tong ZT, Dong SS, Mai SJ, Liao YJ, Bian XW, Lin MC, Kung HF, Zeng YX, Guan XY, Xie D. Overexpression of EIF5A2 promotes colorectal carcinoma cell aggressiveness by upregulating MTA1 through C-myc to induce epithelial-mesenchymal transition. Gut. 2012; 61:562–575.
19. Tripathi DN, Chowdhury R, Trudel LJ, Tee AR, Slack RS, Walker CL, Wogan GN. Reactive nitrogen species regulate autophagy through ATM-AMPK-TSC2 mediated suppression of mTORC1. Proc Natl Acad Sci U S A. 2013; 110:E2950–E2957.
20. Veal E, Day A. Hydrogen peroxide as a signaling molecule. Antioxid Redox Signal. 2011; 15:147–151.
21. Pizzimenti S, Toaldo C, Pettazzoni P, Dianzani MU, Barrera G. The “two-faced” effects of reactive oxygen species and the lipid peroxidation product 4-hydroxynonenal in the hallmarks of cancer. Cancers (Basel). 2010; 2:338–363.
22. Benedetti S, Nuvoli B, Catalani S, Galati R. Reactive oxygen species a double-edged sword for mesothelioma. Oncotarget. 2015; 6:16848–16865. doi: 10.18632/oncotarget.4253.
23. Wei JH, Cao JZ, Zhang D, Liao B, Zhong WM, Lu J, Zhao HW, Zhang JX, Tong ZT, Fan S, Liang CZ, Liao YB, Pang J, et al. EIF5A2 predicts outcome in localised invasive bladder cancer and promotes bladder cancer cell aggressiveness in vitro and in vivo. Br J Cancer. 2014; 110:1767–1777.
24. Yang GF, Xie D, Li LJ, Hua WF, Wu HM, Kung HF, Zeng YX, Guan XY. Expression and amplification of eIF-5A2 in human epithelial ovarian tumors and overexpression of EIF-5A2 is a new independent predictor of outcome in patients with ovarian carcinoma. Gynecol Oncol. 2009; 112:314–318.
25. Meng QB, Kang WM, Yu JC, Liu YQ, Ma ZQ, Zhou L, Cui QC, Zhou WX. Overexpression of eukaryotic translation initiation factor 5A2 (EIF5A2) correlates with cell aggressiveness and poor survival in gastric cancer. PLoS One. 2015; 10:e0119229.
26. Saito A. EMT and EndMT: regulated in similar ways? J Biochem. 2013; 153:493–495.
27. Li Y, Fu L, Li JB, Qin Y, Zeng TT, Zhou J, Zeng ZL, Chen J, Cao TT, Ban X, Qian C, Cai Z, Xie D, et al. Increased expression of EIF5A2, via hypoxia or gene amplification, contributes to metastasis and angiogenesis of esophageal squamous cell carcinoma. Gastroenterology. 2014; 146:1701–1713.
28. Che M, Wang R, Li X, Wang HY, Zheng XF. Expanding roles of superoxide dismutases in cell regulation and cancer. Drug Discov Today. 2016; 21:143–149.
29. Wu WS, Tsai RK, Chang CH, Wang S, Wu JR, Chang YX. Reactive oxygen species mediated sustained activation of protein kinase C alpha and extracellular signal-regulated kinase for migration of human hepatoma cell Hepg2. Mol Cancer Res. 2006; 4:747–758.
30. Hung WY, Huang KH, Wu CW, Chi CW, Kao HL, Li AF, Yin PH, Lee HC. Mitochondrial dysfunction promotes cell migration via reactive oxygen species-enhancedβ5-integrin expression in human gastric cancer SC-M1 cells. Biochim Biophys Acta. 2012; 1820:1102–1110.
31. Cichon MA, Radisky DC. ROS-induced epithelial-mesenchymal transition in mammary epithelial cells is mediated by NF-kB-dependent activation of Snail. Oncotarget. 2014; 5:2827–2838. doi: 10.18632/oncotarget.1940.
32. Wu WS. The signaling mechanism of ROS in tumor progression. Cancer Metastasis Rev. 2006; 25:695–705.
33. Das TP, Suman S, Damodaran C. Induction of reactive oxygen species generation inhibits epithelial-mesenchymal transition and promotes growth arrest in prostate cancer cells. Mol Carcinog. 2014; 53:537–547.