
INTRODUCTION
Gastric cancer (GC) remains a common occurring malignancy among human cancers, representing the second leading cause of cancer deaths worldwide [1, 2]. Despite recent advances in medical technology for GC, the overall 5-year survival rate is still less than 30% [3]. Due to a lack of typical early symptoms, most GC patients are diagnosed at an advanced stage with high lymph node metastasis. Hence, early diagnosis is an important way to improve the overall survival rate of GC. Endoscopy is currently the most reliable diagnostic tool for early GC detection, but this method has suffered from lots of disadvantages as invasive, high cost and low efficient, etc [4]. The examination of blood tumor biomarkers as pepsinogen (PG), MG-7, carbohydrate antigen 19-9 (CA19-9), carbohydrate antigen (CA72-4) and carcinoembryonic antigen (CEA) are also available [4–6]. However, the accuracies of these markers are not yet satisfactory. In this respect, the identification of tumor markers for early GC diagnosis is highly needed in clinic.
Long noncoding RNAs (lncRNAs) are a class of newfound RNAs that greater than 200 bp but with no protein-coding capability [7]. In recent years, lncRNAs are rapidly gaining prominence due to the discovery of their crucial and functional importance in cancer occurrence and progression. Many human cancers include GC are frequently associated with altered lncRNA signature [8–10]. In addition to the role in tumor occurrence and progression, the diagnostic value of lncRNAs for GC was highlighted as well [11–26]. However, views on the diagnostic accuracy of lncRNAs were inconsistent, even conflictive among literature. Consequently, we conducted this meta-analysis and aimed to get an overall understanding of lncRNAs in diagnosing GC.
RESULTS
Literature search
Our initial literature search identified a total of 106 relevant publications concerning the current topic. The titles and abstracts from each article were carefully reviewed, and 90 of them were further excluded due to the status of review articles, letters, basic research, and so forth. The retrieved 16 studies received full test review, and 1 study was finally discarded due to the lack of sufficient data [12]. Hence, only 15 articles were screened out in this meta-analysis [11, 13–26]. The process of study selection was presented in Figure 1.
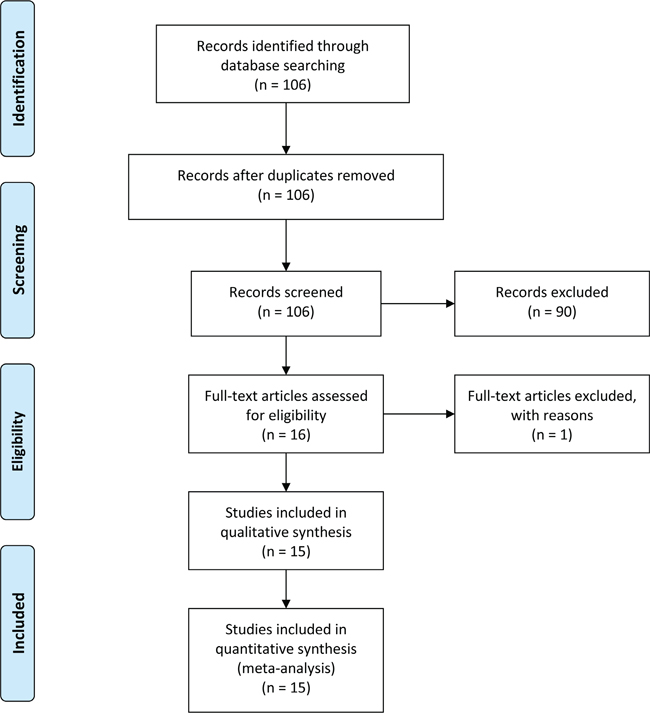
Figure 1: Flow diagram of study selection process.
Study characteristics and quality assessments
The 15 studies involved 1252 patients and 1283 matched controls, and the patient size in each study varied from 17 to 138 and all the GC patients had a definite diagnosis through the histopathological method. The quantitative reverse transcription PCR (qRT-PCR) method was used in evaluating lncRNA levels, and the reference gene contained GAPDH [11, 13, 15, 16, 18, 19, 20, 22-24] and β-actin [14, 17, 21, 25, 26]. Specimen type included plasma [11, 13, 14], serum [21], gastric juice [23] and tissue [15-20, 22, 24-26]. All studies were conducted in Chinese population. The main features of enrolled studies were displayed in Table 1.
Table 1: Main feature of the included studies
Author |
Year |
Population |
Patients (Controls) |
Control sources |
Sample type |
Cut-off value |
Method |
LncRNA signatures |
Expression status |
QUADAS scores |
|---|---|---|---|---|---|---|---|---|---|---|
Chen et al. [22] |
2014 |
Chinese |
94 (94) |
ANT |
Tissue |
Unclear |
qRT-PCR |
AC138128.1 |
Decreased |
11 |
Chen et al. [18] |
2015 |
Chinese |
83 (83) |
ANT |
Tissue |
9.56 |
qRT-PCR |
HIF1A-AS2 |
Increased |
12 |
Dong et al. [21] |
2015 |
Chinese |
90 (86) |
Nontumorous mucosa |
Serum |
Unclear |
qRT-PCR |
CUDR, LSINCT-5 and PTENP1 |
Decreased |
11 |
Li et al. [13] |
2014 |
Chinese |
79 (81) |
Healthy blood |
Plasma |
Unclear |
qRT-PCR |
LINC00152 |
Increased |
10 |
Lin et al. [24] |
2014 |
Chinese |
75 (75) |
ANT |
Tissue |
<11.0 |
qRT-PCR |
ABHD11-AS1 |
Increased |
12 |
Liu et al. [14] |
2014 |
Chinese |
83 (80) |
Healthy blood |
Plasma |
15.43 |
qRT-PCR |
FER1L4 |
Decreased |
12 |
Liu et al. [15] |
2014 |
Chinese |
138 (138) |
ANT |
Tissue |
4.97 |
qRT-PCR |
NcRuPAR |
Decreased |
12 |
Mei et al. [26] |
2013 |
Chinese |
96 (96) |
ANT |
Tissue |
2.31 |
qRT-PCR |
SUMO1P3 |
Increased |
12 |
Pang et al. [16] |
2014 |
Chinese |
17 (16) |
Normal tissue |
Tissue |
4.385 |
qRT-PCR |
LINC00152 |
Increased |
12 |
Sun et al. [17] |
2013 |
Chinese |
78 (78) |
ANT |
Tissue |
13.955 |
qRT-PCR |
AC096655.1-002 |
Decreased |
12 |
Sun et al. [20] |
2015 |
Chinese |
96 (96) |
ANT |
Tissue |
6.445 |
qRT-PCR |
RP11-119F7.4 |
Decreased |
11 |
Shao et al. [23] |
2014 |
Chinese |
83 (120) |
ANT |
Gastric juice |
0.88 |
qRT-PCR |
AA174084 |
Decreased |
12 |
Zhao et al. [25] |
2014 |
Chinese |
58 (58) |
ANT |
Tissue |
10.88 |
qRT-PCR |
HULC |
Increased |
12 |
Zheng et al. [19] |
2015 |
Chinese |
112 (112) |
ANT |
Tissue |
13.74 |
qRT-PCR |
UCA1 |
Increased |
12 |
Zhou et al. [11] |
2015 |
Chinese |
70 (70) |
Healthy blood |
Plasma |
Unclear |
qRT-PCR |
H19 |
Increased |
Abbreviations: ANT: adjacent non-tumor tissues; QUADAS: quality assessment for studies of diagnostic accuracy; qRT-PCR: quantitative reverse transcription PCR.
According to 14-item QUADAS checklist, all the 15 investigations achieved QUADAS scores equal or greater than 10, suggesting a relatively high quality of the included studies (Table 1 and Figure 2).
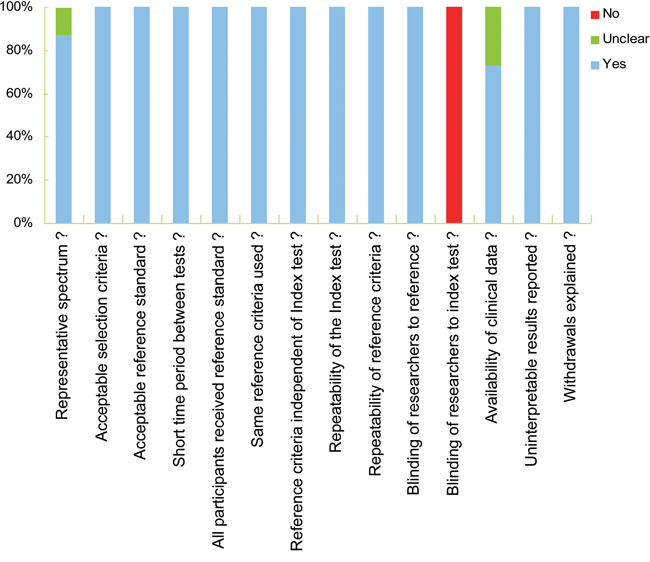
Figure 2: Study quality assessment using the QUADAS checklist.
Study heterogeneity
Study heterogeneity from threshold effects was reflected by Spearman correlation coefficient using Meta-Disc 1.4 software. As shown in Table 2, statistical analysis presented a Spearman correlation coefficient of 0.125, and P value of 0.633, indicating no obvious heterogeneity generated from threshold effect. In addition, the Cochran-Q test achieved a Q value of 51.46, and P value of 0.000, suggesting a likelihood of substantial heterogeneity generated by non-threshold effects. Additionally, heterogeneity from non-threshold effects seemed to exist in tissue-based assay as well (Table 2).
Table 2: Heterogeneity assessment of the pooled studies
Analysis |
Spearman correlation Coefficient |
Cochran’s-Q test |
I2 test (%) |
Heterogeneity |
|
|---|---|---|---|---|---|
Threshold effect |
Non-threshold effect |
||||
Overall |
0.125a |
51.46b |
68.9 |
No |
Yes |
P = 0.633 |
P = 0.0000 |
||||
Plasma-based |
0.400a |
4.96b |
39.6 |
No |
No |
P = 0.600 |
P = 0.1745 |
||||
Tissue-based |
0.126a |
43.66b |
72.5 |
No |
Yes |
P = 0.681 |
P = 0.0000 |
||||
a: Value of spearman correlation coefficient; b: Q value
Diagnostic performance
Since the existence of substantial heterogeneity among studies, a random-effect model was chosen for the generation of pooled indexes. The data showed that the combined sensitivity, specificity, PLR, NLR and DOR were 0.68 (95% CI: 0.61-0.74), 0.79 (95% CI: 0.72-0.84), 3.17 (95% CI: 2.46-4.10), 0.41 (95% CI: 0.33-0.49), and 7.83 (95% CI: 5.39-11.38), respectively. Forest plots of pooled sensitivity and specificity for lncRNAs are displayed in Figure 3. The SROC curve for the included studies is shown in Figure 4, in which lncRNA profiling yielded an AUC of 0.80, indicating a moderate accuracy for the diagnostic test.
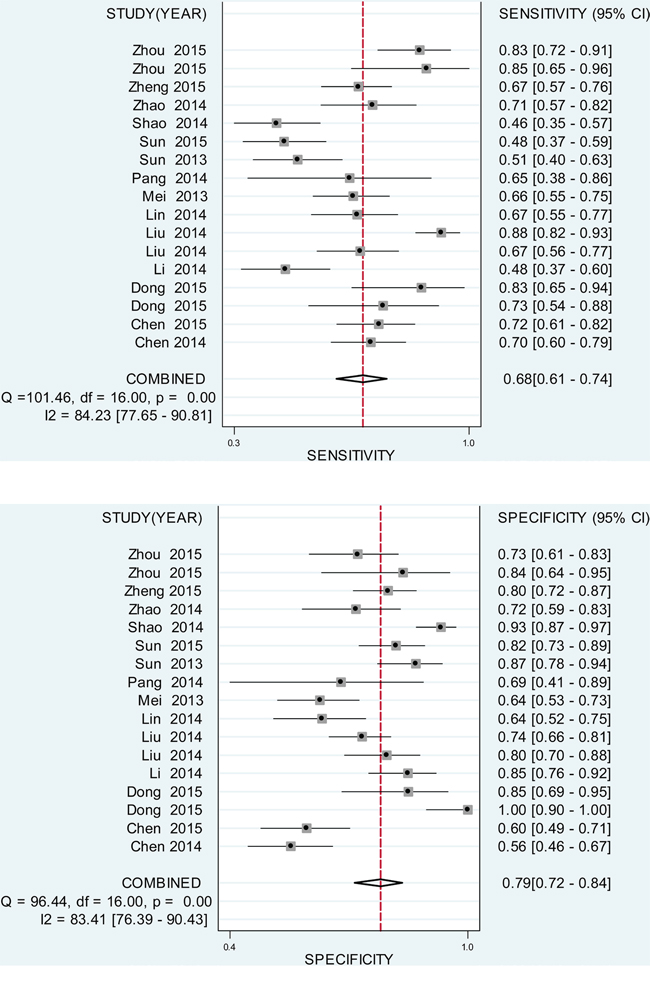
Figure 3: Forest plot of pooled sensitivity and specificity for the included studies. A. pooled sensitivity. B. pooled specificity.
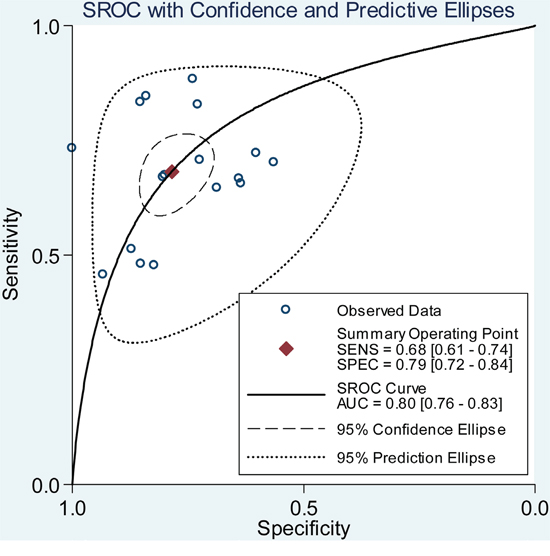
Figure 4: SROC curve for lncRNA expression profile in the diagnosis of GC.
Subgroup analysis
Stratified analyses based on different specimen type demonstrated that plasma-based group achieved a higher accuracy than that tissue-based group: specificity 0.80 (95%CI: 0.75-0.85) versus 0.75 (95%CI: 0.73-0.78), PLR 3.33 (95%CI: 2.58-4.30) versus 2.7 (95%CI: 2.10-3.48), NLR 0.35 (95%CI: 0.21-0.60) versus 0.44 (95%CI: 0.36-0.54), DOR 9.47 (95%CI: 5.40-16.62) versus 6.69 (95%CI: 4.40-10.16), and AUC 0.84 versus 0.77, hinting that plasma may be a better matrix for the analysis of lncRNAs in conforming GC. However, the pooled sensitivity between such two groups was equally matched.
Influence analysis and meta-regression
As indicated in Figure 5, the influence analysis identified no significant outlier studies, hinting that the outlier studies were not likely to be a source of heterogeneity. In addition, meta-regression revealed P values greater than 0.05 in all specified covariates, indicating that specimen type, control sources, sample size, reference gene, cut-off value and QUADAS score were unlikely to be the sources of heterogeneity (Table 3).
Table 3: Meta-regression for the potential source of heterogeneity
Study characteristic |
P-value |
RDOR |
95% CI |
|---|---|---|---|
Specimen type (plasma, serum or tissue) |
0.0587 |
0.56 |
(0.31-1.02) |
Control sources (healthy blood, normal tissue or adjacent non-tumor tissue) |
0.9385 |
0.90 |
(0.05-15.68) |
Sample size (GC<100 vs. GC≥100) |
0.1047 |
2.27 |
(0.82-6.23) |
Reference gene (GAPDH vs. β-actin) |
0.5264 |
0.73 |
(0.25-2.13) |
Cut-off value (value <100 vs. value ≥100) |
0.1798 |
0.71 |
(0.42-1.2) |
Study quality (QUADAS score≤10 or≥11) |
0.1008 |
3.29 |
(0.76-14.14) |
Abbreviations: CI: confidence interval; RDOR: relative diagnostic odds ratio; QUADAS: quality assessment for studies of diagnostic accuracy; GC: Gastric cancer; GAPDH: glyceraldehyde-phosphate dehydrogenase
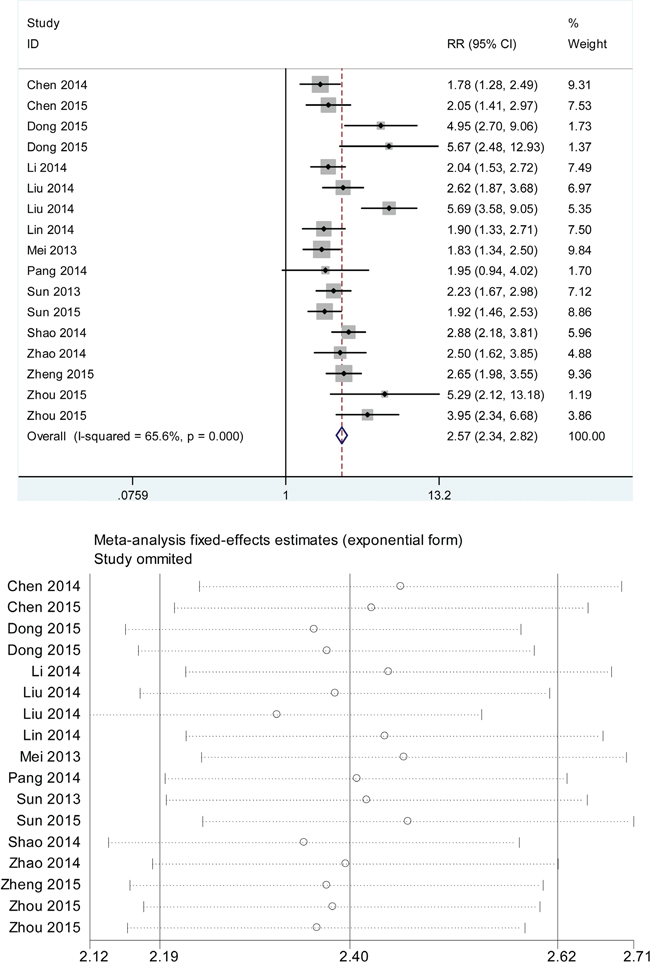
Figure 5: Influence analysis of the overall pooled study. A. intermediate variable of RR; B. outlier detection analysis. Influence analysis was conducted through STATA 12.0 software. RR: relative risk.
Publication bias
As shown in Figure 6, the slope coefficient did not reveal obvious evidences of asymmetry, with a P value of 0.548, suggesting that there was no potential publication bias among studies.
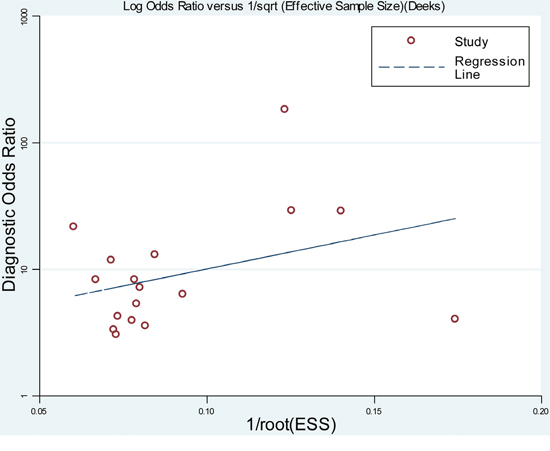
Figure 6: Funnel graph for the assessment of potential publication bias of the included studies.
DISCUSSION
Gastric cancer (GC) ranks the second leading cause of cancer deaths worldwide and early cancer detection remains a major challenge for GC research [1, 2]. Although the development of diagnostic methods and surgical techniques in recent years has remarkably improved the prognosis of GC patients, the 5-year survival rate for advanced GC still less than 30% [3]. The lack of diagnostic biomarkers accounts for the delay of early GC detection. Many non-invasive blood markers for GC detection are available thus far. For instance, PG, MG-7, CA19-9, CA72-4 and CEA are currently used in detecting GC [4–6]. Notwithstanding, these biomarkers are not ideal in confirming GC due to the relatively low diagnostic accuracies. On the other hand, endoscopic screening remains the most reliable diagnostic tool for GC detection, but it still yields the disadvantages of invasive status and relatively high costs [4]. It is therefore necessary to identify novel diagnostic biomarkers for GC screening.
It has become increasingly apparent that the versatile lncRNA reveals a diagnostic role in various kinds of cancers including GC [11–26]. In this study, we sought to evaluate the pooled diagnostic performance of lncRNAs for GC detection. The data manifested that the pooled sensitivity and specificity were 0.68 and 0.79, respectively, corresponding to an AUC up to 0.80. The diagnostic accuracy was estimated in a moderate level and it seems that the pooled sensitivity is not high enough for GC screening. On the other hand, the DOR (1.0 to infinity) is another indicator in mirroring discriminating power of a diagnostic test [27]. In this study, the DOR of lncRNAs was estimated to be 7.83, reflecting a moderate level of diagnostic accuracy. Additionally, a pooled PLR was estimated to be 3.17, suggesting that patients with GC had 3-fold higher chance of being lncRNAs positive (or significant changes) than non-GC cases. Meanwhile, a pooled NLR of 0.41 means that when the lncRNAs test is negative, 41% cases have the probability to be GC, which the value is not lower enough to rule out GC.
Data from the present meta-analysis suggest that lncRNAs expression profile yields a moderate diagnostic accuracy for GC. Although the relatively low pooled sensitivity and high NLR may not be powerful enough to diagnose GC, some points still support the utility of lncRNA(s) as an auxiliary biomarker for GC detection: First, most of the enrolled lncRNAs can distinguish healthy samples from early GC samples, suggesting a potential diagnostic value in GC. Second, lncRNAs were detectable in tumor tissues, peripheral blood even gastric juice from GC patients, and are not vulnerable to surrounding environment as well as other factors. Last, different lncRNAs should be investigated in panels, so as to select an optimum combination for potential clinical application. For example, a three-lncRNA signature (CUDR, LSINCT-5 and PTENP1) achieved a specificity of 100% and AUC of 0.92, with an overall diagnostic accuracy of 0.87 [21].
In the subgroup studies, a comparative analysis of lncRNA expression patterns in plasma and tissues manifested that plasma-based lncRNA profile harvested higher accuracy than tissue-based assay, suggesting that analysis using plasma may be better than tissue. The matrix differences have been confirmed in microRNAs by some meta-analysis studies [28, 29]. Similarly, one study documented that lncRNA test from sera samples yielded higher diagnostic accuracy than that from tissues, indicating that different specimen type may harvest different diagnostic accuracy [21]. However, only 4 individual studies were included for plasma-based lncRNA signature, which the accuracy might be comprised. Moreover, our stratified analyses failed to estimate the pooled accuracy for other matrix as serum or gastric juice due to a lack of sufficient data from publications. Thus, more studies are warranted to confirm this point.
In this study, we found significant heterogeneity appeared in the overall pooled study as well as the stratified analyses. Although all enrolled studies employed qRT-PCT method for the analysis of levels of lncRNA(s) expression, the reference gene differs among studies. It has been evidently reported that different reference gene may contribute to the accuracy in diagnosing GC [21]. Additionally, the samples size, specimen type as well as patient conditions for the tests were not relatively unified in studies. As a result, we conducted influence and univariate meta-regression analyses to trace the underlying heterogeneity sources. However, we found that the outlier study, study quality, specimen type, control type and sample size are not likely to be the sources of heterogeneity.
To conclude, our findings suggest that lncRNA expression profiles harbored a moderate accuracy in differentiation of GC patients and cancer-free individuals. LncRNA profiling reveals promising value in the management of GC. Nevertheless, several limitations were presented in our study. First of all, our analysis may have some population bias. Secondly, the control sources were complicated, for some are healthy blood or non-tumorous mucosa, and some are adjacent non-tumor tissues. More studies are therefore needed to highlight the value of lncRNAs as supplement test in diagnosing GC.
MATERIALS AND METHODS
Article search and inclusion criteria
This meta-analysis followed the standards of PRISMA (Preferred Reporting Items for Systematic Reviews and Meta-analysis) published in 2009 [30]. The online PubMed database and Foreign Medical Retrieval Service (FMRS) platforms were carefully searched for all suitable studies until September 30th 2015. The search items were: “gastric cancer/carcinoma”, “long noncoding RNAs/lncRNAs”, “diagnosis/sensitivity/specificity/ROC/AUC”.
The enroll criteria were: studies (1) explored lncRNA(s) expression in GC subjects; (2) clearly defined study population and control sources; (3) explicitly defined sensitivity and specificity; and (4) published in English. The exclusion criteria were: studies (1) without complete data to tabulate 2 × 2 table; (2) had an unclear definition of the control group(s), or the controls sources were from tumors; and (3) reviews, meta-analyses, letters, commentaries, etc.
Data extraction and study quality assessment
Data extracted from each study included the first author, publication date, country, control sources, sample size or types, detection method, lncRNA expression patterns and the diagnostic results. In case that study contains both training and validating tests, data from each test were extracted and deemed as an individual study. Any disagreements were resolved by discussion.
Studies quality was assessed following the checklist proposed by the evidence-based QUADAS tool [31]. According to the 14-items scoring criteria, each study was evaluated as “Yes (high concern)”, “No (low concern)” or “Unclear (unclear concern/risk)”, corresponding to a score of “1”, “0” and “0”, respectively.
Statistical analysis
The STATA 12.0 (Stata Corporation, College Station, TX, USA) and Meta-Disc 1.4 (XI Cochrane Colloquium, Barcelona, Spain) software were used for the statistical analyses. The pooled sensitivity, specificity, diagnostic odds ratio (DOR), positive likelihood ratio (PLR), negative likelihood ratio (NLR) were generated using a bivariate analysis. Heterogeneity from threshold and non-threshold effects was separately assessed by Spearman correlation coefficient, Cochran-Q and Inconsistency index (I2) tests. When a significant heterogeneity exists among studies (P < 0.05 for Cochran-Q test or I2 > 50%), a random-effect model will be chosen for the generation of pooled indexes [32]. The potential publication bias was analyzed by Deeks' funnel plot asymmetry test and the significant level was set in P < 0.01. Influence and univariate meta-regression analyses were performed to trace the potential heterogeneity sources. The covariates of meta-regression involved sample size (<100 or ≥100) [33], specimen type (plasma, serum, tissue or other), control sources (healthy blood, normal tissue or adjacent non-tumor tissue), reference gene (GAPDH or β-actin), cut-off value (<10 or ≥10), and study quality (QUADAS socre≤10 or≥11).
ACKNOWLEDGMENTS AND FUNDING
This study was supported by the National Clinical Key Specialty Construction Program of China, Provincial Natural Science Fund of Fujian (No. 2014J01297 to Y. Chen) and Provincial Natural Science Fund of Fujian (No.2016J0105 to Z. Xiao).
CONFLICTS OF INTEREST
All authors declare that there are no conflicts of interest.
REFERENCES
1. Wadhwa R, Song S, Lee JS, Yao Y, Wei Q, Ajani JA. Gastric cancer-molecular and clinical dimensions. Nat Rev Clin Oncol. 2013;10:643–655.
2. González CA, Sala N, Rokkas T. Gastric cancer: epidemiologic aspects. Helicobacter. 2013;18:34–38.
3. Beeharry MK, Liu WT, Yan M, Zhu ZG. New blood markers detection technology: A leap in the diagnosis of gastric cancer. World J Gastroenterol. 2016;22:1202-12.
4. Kanda M, Kodera Y. Recent advances in the molecular diagnostics of gastric cancer. World J Gastroenterol. 2015;21:9838–9852.
5. Zoalfaghari A, Aletaha N, Roushan N, Taslimi R, Foroutan H, Faridnia B. Accuracy of pepsinogens for early diagnosis of atrophic gastritis and gastric cancer in Iranian population. Med J Islam Repub Iran. 2014;28:150.
6. Pinheiro Ddo R, Ferreira WA, Barros MB, Araújo MD, Rodrigues-Antunes S, Borges Bdo N. Perspectives on new biomarkers in gastric cancer: diagnostic and prognostic applications. World J Gastroenterol. 2014;20:11574–11585.
7. Brosnan CA, Voinnet O. The long and the short of noncoding RNAs. Curr Opin Cell Biol. 2009;21:416–425.
8. Huang T, Alvarez A, Hu B, Cheng SY. Noncoding RNAs in cancer and cancer stem cells. Chin J Cancer. 2013;32:582–593.
9. Zhang H, Chen Z, Wang X, Huang Z, He Z, Chen Y. Long non-coding RNA: a new player in cancer. J Hematol Oncol. 2013;6:37.
10. Li PF, Chen SC, Xia T, Jiang XM, Shao YF, Xiao BX, Guo JM. Non-coding RNAs and gastric cancer. World J Gastroenterol. 2014;20:5411–5419.
11. Zhou X, Yin C, Dang Y, Ye F, Zhang G. Identification of the long non-coding RNA H19 in plasma as a novel biomarker for diagnosis of gastric cancer. Sci Rep. 2015;5:11516.
12. Song H, Sun W, Ye G, Ding X, Liu Z, Zhang S, Xia T, Xiao B, Xi Y, Guo J. Long non-coding RNA expression profile in human gastric cancer and its clinical significances. J Transl Med. 2013;11:225.
13. Li Q, Shao Y, Zhang X, Zheng T, Miao M, Qin L, Wang B, Ye G, Xiao B, Guo J. Plasma long noncoding RNA protected by exosomes as a potential stable biomarker for gastric cancer. Tumour Biol. 2015;36:2007–2012.
14. Liu Z, Shao Y, Tan L, Shi H, Chen S, Guo J. Clinical significance of the low expression of FER1L4 in gastric cancer patients. Tumour Biol. 2014;35:9613–9617.
15. Liu L, Yan B, Yang Z, Zhang X, Gu Q, Yue X. ncRuPAR inhibits gastric cancer progression by down-regulating protease-activated receptor-1. Tumour Biol. 2014;35:7821–7829.
16. Pang Q, Ge J, Shao Y, Sun W, Song H, Xia T, Xiao B, Guo J. Increased expression of long intergenic non-coding RNA LINC00152 in gastric cancer and its clinical significance. Tumour Biol. 2014;35:5441–5447.
17. Sun W, Wu Y, Yu X, Liu Y, Song H, Xia T, Xiao B, Guo J. Decreased expression of long noncoding RNA AC096655.1-002 in gastric cancer and its clinical significance. Tumour Biol. 2013;34:2697–2701.
18. Chen WM, Huang MD, Kong R, Xu TP, Zhang EB, Xia R, Sun M, De W, Shu YQ. Antisense Long Noncoding RNA HIF1A-AS2 Is Upregulated in Gastric Cancer and Associated with Poor Prognosis. Dig Dis Sci. 2015;60:1655–1662.
19. Zheng Q, Wu F, Dai WY, Zheng DC, Zheng C, Ye H, Zhou B, Chen JJ, Chen P. Aberrant expression of UCA1 in gastric cancer and its clinical significance. Clin Transl Oncol. 2015;17:640–646.
20. Sun J, Song Y, Chen X, Zhao J, Gao P, Huang X, Xu H, Wang Z. Novel long non-coding RNA RP11-119F7.4 as a potential biomarker for the development and progression ofgastric cancer. Oncol Lett. 2015;10:115–120.
21. Dong L, Qi P, Xu MD, Ni SJ, Huang D, Xu QH, Weng WW, Tan C, Sheng WQ, Zhou XY, Du X. Circulating CUDR, LSINCT-5 and PTENP1 long noncoding RNAs in sera distinguish patients with gastric cancerfrom healthy controls. Int J Cancer. 2015;137:1128-1135.
22. Chen X, Sun J, Song Y, Gao P, Zhao J, Huang X, Liu B, Xu H, Wang Z. The novel long noncoding RNA AC138128.1 may be a predictive biomarker in gastric cancer. Med Oncol. 2014;31:262.
23. Shao Y, Ye M, Jiang X, Sun W, Ding X, Liu Z, Ye G, Zhang X, Xiao B, Guo J. Gastric juice long noncoding RNA used as a tumor marker for screening gastric cancer. Cancer. 2014;120:3320–3328.
24. Lin X, Yang M, Xia T, Guo J. Increased expression of long noncoding RNA ABHD11-AS1 in gastric cancer and its clinical significance. Med Oncol. 2014;31:42.
25. Zhao Y, Guo Q, Chen J, Hu J, Wang S, Sun Y. Role of long non-coding RNA HULC in cell proliferation, apoptosis and tumor metastasis of gastric cancer: a clinical and in vitro investigation. Oncol Rep. 2014;31:358–364.
26. Mei D, Song H, Wang K, Lou Y, Sun W, Liu Z, Ding X, Guo J. Up-regulation of SUMO1 pseudogene 3 (SUMO1P3) in gastric cancer and its clinical association. Med Oncol. 2013;30:709.
27. Glas AS, Lijmer JG, Prins MH, Bonsel GJ, Bossuyt PM. The diagnostic odds ratio: a single indicator of test performance. J Clin Epidemiol. 2003;56:1129–1135.
28. Cui Z, Lin D, Song W, Chen M, Li D. Diagnostic value of circulating microRNAs as biomarkers for breast cancer: a meta-analysis study. Tumour Biol. 2015;36:829–839.
29. Shen Y, Wang T, Yang T, Hu Q, Wan C, Chen L, Wen F. Diagnostic value of circulating microRNAs for lung cancer: a meta-analysis. Genet Test Mol Biomarkers. 2013;17:359–366.
30. Moher D, Liberati A, Tetzlaff J, Altman DG, PRISMA Group. Preferred reporting items for systematic reviews and meta-analyses: the PRISMA statement. J Clin Epidemiol. 2009;62:1006–1012.
31. Whiting P, Rutjes AW, Reitsma JB, Bossuyt PM, Kleijnen J. The development of QUADAS: a tool for the quality assessment of studies of diagnostic accuracy included in systematic reviews. BMC Med Res Methodol. 2003;3:25.
32. Vamvakas EC. Meta-analyses of studies of the diagnostic accuracy of laboratory tests: A review of the concepts and methods. Arch Pathol Lab Med. 1998;122:675–686.
33. Zhang X, Liu D, Liu YN, Wang R, Xie LX. The accuracy of presepsin (sCD14-ST) for the diagnosis of sepsis in adults: a meta-analysis. Crit Care. 2015;19:323.