
INTRODUCTION
Neuroblastoma is an embryonic cancer that arises from primordial cells during fetal or early childhood development [1]. It is also the most commonly diagnosed extracranial solid tumor in childhood, accounting for more than 7% of malignancies in patients younger than 15 years [1, 2]. In the United States, the incidence rate of neuroblastoma is about 1 in 7000 live newborns [3], while the rate is roughly 7.7 per million in China [4]. Approximately, 1% of the neuroblastoma patients have a family history and they are generally diagnosed at a much earlier age and more prone to develop multifocal primary tumors [5, 6]. Cure rates for high-risk neuroblastoma patient remains less than 40% [7, 8], and the 5-year survival rate for neuroblastoma patients is around 70%. Nearly 6% of patients died from recurrence or second tumor after 5 years of diagnosis [9]. Neuroblastoma has devastating impacts on affected family and is also a great challenge for public health [10].
In order to identify risk factors for neuroblastoma, a multitude of epidemiological studies have been performed to investigate some putative causative agents and their biological effects in different populations [11]. Unfortunately, so far, epidemiological studies haven’t identified any common environmental exposure that can definitely influence neuroblastoma susceptibility [12, 13]. On the other hand, molecular epidemiological studies focus on the use of biomarkers in epidemiological research, which are typically indicators of exposure, effect, or susceptibility. Accumulating evidence from molecular epidemiological studies suggests that genetic factors may play a critical role in the development of neuroblastoma [14–18].
Genome-wide association study (GWAS) has served as a powerful tool in the identification of inherited genetic variations that are associated with complex human diseases including cancer [19]. Previous GWASs have discovered several inherited common variants in some chromosomal regions that are significantly associated with the risk of neuroblastoma, such as LINC00340 (also known as FLJ22536 or CASC15) at 6p22 [1], BARD1 at 2q35 [20], and LIM domain only 1 (LMO1) at 11p15 [21]. In a GWAS limited to the European descent, Wang et al. [21] recruited a total of 1627 neuroblastoma cases and 3254 controls in the discovery stage to screen neuroblastoma susceptibility loci. Next, the four most significant variants identified in the first phase were further validated in 190 neuroblastoma cases and 1507 controls from United States, 253 cases and 845 controls from United Kingdom, as well as 181 cases and 491 controls from Italy. They found that four single nucleotide polymorphisms (SNPs) in the LMO1 gene (rs110419 A > G, rs4758051 G > A, rs10840002 A > G and rs204938 A > G) were associated with neuroblastoma susceptibility. Since then, the association between the four LMO1 SNPs and neuroblastoma have been validated in African-Americans [22], Italians [23], and a Northern Chinese population [24]. There may exist significant differences in genetic background between Europeans and Chinese subjects, and the differences may even exist among the different regions of China, which may modify the association between SNPs and diseases including neuroblastoma. With these in mind, in this hospital-based case-control study, we aimed to determine the relationship between LMO1 gene polymorphisms and neuroblastoma susceptibility in a Southern Chinese population with 256 cases and 531 controls.
RESULTS
Population characteristics
As shown in Table 1, a total of 256 neuroblastoma cases and 531 age-, gender- and ethnicity-matched controls were included in the current study. Briefly, no significant differences were observed in age (30.87 ± 26.45 vs. 29.73 ± 24.86, P = 0.239) and gender (P = 0.333) between neuroblastoma cases and healthy controls. Of the neuroblastoma cases, 54 (21.09%) were diagnosed with clinical stage I, 65 (25.39%) with clinical stage II, 44 (17.19%) with clinical stage III, 77 (30.08) with clinical stage IV, and 9 (3.52%) with clinical stage 4s disease, according to the INSS criteria [25]. Moreover, 46 (17.97%) neuroblastomas were developed in adrenal gland, 87 (33.98%) in retroperitoneal region, and 90 (35.16%) in the mediastinum.
Table 1: Frequency distribution of selected characteristics in neuroblastoma patients and controls
Variables |
Cases (n = 256) |
Controls (n = 531) |
Pa |
||
|---|---|---|---|---|---|
No. |
% |
No. |
% |
||
Age range, month |
0–156 |
0.07–156 |
0.239 |
||
Mean ± SD |
30.87 ± 26.45 |
29.73 ± 24.86 |
|
||
≤ 18 |
101 |
39.45 |
233 |
43.88 |
|
> 18 |
155 |
60.55 |
298 |
56.12 |
|
Gender |
|
|
|
|
0.333 |
Female |
103 |
40.23 |
233 |
43.88 |
|
Male |
153 |
59.77 |
298 |
56.12 |
|
Clinical stage |
|
|
|
|
|
I |
54 |
21.09 |
|
|
|
II |
65 |
25.39 |
|
|
|
III |
44 |
17.19 |
|
|
|
IV |
77 |
30.08 |
|
|
|
4s |
9 |
3.52 |
|
|
|
NA |
7 |
2.73 |
|
|
|
Site of origin |
|
|
|
|
|
Adrenal gland |
46 |
17.97 |
|
|
|
Retroperitoneal region |
87 |
33.98 |
|
|
|
Mediastinum |
90 |
35.16 |
|
|
|
Other region |
25 |
9.77 |
|
|
|
NA |
8 |
3.13 |
|
|
|
aTwo-sided χ2 test for distributions between neuroblastoma patients and controls.
Associations between LMO1 gene polymorphisms and neuroblastoma susceptibility
As shown in Table 2, all the observed genotype frequency distribution of the four SNPs were in accordance with Hardy-Weinberg equilibrium (HWE) in controls subjects (P = 0.248 for rs110419 A > G, P = 0.199 for rs4758051 G > A, P = 0.070 for rs10840002 A > G and P = 0.153 for rs204938 A > G). Of the four investigated SNPs, significant difference in the genotype distributions between neuroblastoma cases and controls was only observed for the rs110419 A > G polymorphism (P = 0.014). After adjustment for age and gender, carriers of rs110419 G allele had odds ratios (ORs) of 0.58 to 0.65 for developing neuroblastoma [AG vs. AA: adjusted OR = 0.65, 95% confidence interval (CI) = 0.47–0.91, P = 0.011; GG vs. AA: adjusted OR = 0.58, 95% CI = 0.36–0.91, P = 0.018; AG/GG vs. AA: adjusted OR = 0.63, 95% CI = 0.46–0.86, P = 0.004], when compared with the carriers of rs110419 AA genotype, suggesting a protective effect of this SNP against neuroblastoma. However, no association was found for the three remaining polymorphisms. While protective genotypes of the four SNPs were combined, we found the individuals with 4 protective genotypes experienced a significantly decreased neuroblastoma risk when compared with those with 0–3 protective genotypes (Adjusted OR = 0.51, 95% CI = 0.32–0.81, P = 0.004).
Table 2: Genotype and allele frequencies of the four selected polymorphisms and neuroblastoma susceptibility in a chinese population
Genotype |
Cases (N = 256) |
Controls (N = 531) |
Pa |
Crude OR (95% CI) |
P |
Adjusted OR (95% CI)b |
Pb |
|---|---|---|---|---|---|---|---|
rs110419 (HWE = 0.248) |
|||||||
AA |
103 (40.23) |
159 (29.94) |
|
1.00 |
|
1.00 |
|
AG |
117 (45.70) |
275 (51.79) |
|
0.66 (0.47–0.91) |
0.012 |
0.65 (0.47–0.91) |
0.011 |
GG |
36 (14.06) |
97 (18.27) |
|
0.57 (0.36–0.90) |
0.017 |
0.58 (0.36–0.91) |
0.018 |
Additive |
|
|
0.014 |
0.73 (0.59–0.92) |
0.006 |
0.73 (0.59–0.92) |
0.006 |
Dominant |
153 (59.77) |
372 (70.04) |
0.004 |
0.64 (0.47–0.87) |
0.004 |
0.63 (0.46–0.86) |
0.004 |
Recessive |
220 (85.94) |
434 (81.73) |
0.140 |
0.73 (0.48–1.11) |
0.141 |
0.74 (0.49–1.12) |
0.152 |
rs4758051 (HWE = 0.199) |
|||||||
GG |
95 (37.11) |
194 (36.53) |
|
1.00 |
|
1.00 |
|
AG |
126 (49.22) |
242 (45.57) |
|
1.06 (0.77–1.47) |
0.713 |
1.08 (0.78–1.50) |
0.654 |
AA |
35 (13.67) |
95 (17.89) |
|
0.75 (0.48–1.19) |
0.224 |
0.76 (0.48–1.21) |
0.247 |
Additive |
|
|
0.306 |
0.91 (0.73–1.12) |
0.369 |
0.91 (0.74–1.13) |
0.409 |
Dominant |
161 (62.89) |
337 (63.47) |
0.876 |
0.98 (0.72–1.33) |
0.875 |
0.99 (0.73–1.35) |
0.942 |
Recessive |
221 (86.33) |
436 (82.11) |
0.135 |
0.73 (0.48–1.11) |
0.137 |
0.73 (0.48–1.11) |
0.144 |
rs10840002 (HWE = 0.070) |
|||||||
AA |
90 (35.16) |
182 (34.27) |
|
1.00 |
|
1.00 |
|
AG |
124 (48.44) |
240 (45.20) |
|
1.05 (0.75–1.46) |
0.796 |
1.06 (0.76–1.48) |
0.741 |
GG |
42 (16.41) |
109 (20.53) |
|
0.78 (0.50–1.21) |
0.263 |
0.79 (0.51–1.22) |
0.281 |
Additive |
|
|
0.375 |
0.91 (0.74–1.12) |
0.359 |
0.91 (0.74–1.12) |
0.388 |
Dominant |
166 (64.84) |
349 (65.73) |
0.808 |
0.96 (0.70–1.32) |
0.807 |
0.97 (0.71–1.33) |
0.863 |
Recessive |
214 (83.59) |
422 (79.47) |
0.169 |
0.76 (0.51–1.13) |
0.170 |
0.76 (0.51–1.13) |
0.174 |
rs204938 (HWE = 0.153) |
|||||||
AA |
164 (64.06) |
354 (66.67) |
|
1.00 |
|
1.00 |
|
AG |
83 (32.42) |
165 (31.07) |
|
1.09 (0.79–1.50) |
0.617 |
1.09 (0.79–1.50) |
0.609 |
GG |
9 (3.52) |
12 (2.26) |
|
1.62 (0.67–3.92) |
0.285 |
1.59 (0.66–3.86) |
0.304 |
Additive |
|
|
0.523 |
1.14 (0.87–1.51) |
0.343 |
1.14 (0.87–1.50) |
0.349 |
Dominant |
92 (35.94) |
177 (33.33) |
0.471 |
1.12 (0.82–1.53) |
0.471 |
1.12 (0.82–1.54) |
0.470 |
Recessive |
247 (96.48) |
519 (97.74) |
0.306 |
1.58 (0.66–3.79) |
0.310 |
1.55 (0.64–3.73) |
0.330 |
Combined effect of protective genotypes |
|||||||
0–3 |
230 (89.84) |
435 (81.92) |
|
1.00 |
|
1.00 |
|
4 |
26 (10.16) |
96 (18.08) |
0.004 |
0.51 (0.32–0.81) |
0.005 |
0.51 (0.32–0.81) |
0.004 |
aχ2 test for genotype distributions between neuroblastoma patients and controls
bAdjusted for age and gender.
Stratification analysis
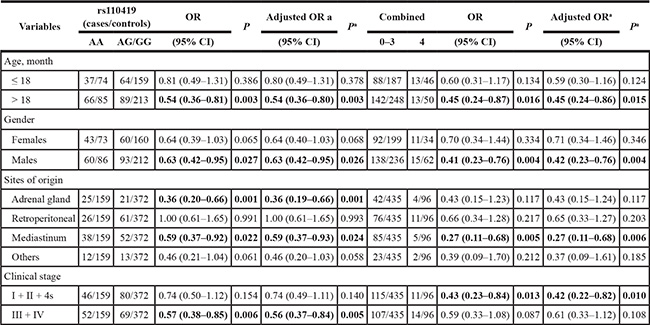
We further explored the association between LMO1 gene rs110419 A > G polymorphism and combined effects of protective genotypes with neuroblastoma susceptibility in stratification analysis by age, gender, sites of origin, and clinical stages (Table 3). Compared to the rs110419 AA genotype, the protective effect of AG/GG genotypes was more predominant for children > 18 months of age (adjusted OR = 0.54, 95% CI = 0.36–0.80, P = 0.003) and males (adjusted OR = 0.63, 95% CI = 0.42–0.95, P = 0.026). In term of sites of origin, we observed a significantly decreased risk of tumor developed in adrenal gland (adjusted OR = 0.36, 95% CI = 0.19–0.66, P = 0.001) and mediastinum (adjusted OR = 0.59, 95% CI = 0.37–0.93, P = 0.024), but no alteration in the risk of tumor in retroperitoneal and other regions. Moreover, we observed the AG/GG genotypes carriers had a significantly decreased risk of clinical stages III/IV neuroblastoma (adjusted OR = 0.56, 95% CI = 0.37–0.84, P = 0.005) when compared with the AA genotype carriers. In addition, combined analysis indicated that the 4 protective genotypes collectively decreased neuroblastoma risk in the children > 18 months of age (adjusted OR = 0.45, 95% CI = 0.24–0.86, P = 0.015), males (adjusted OR = 0.42, 95% CI = 0.23–0.76, P = 0.004), patients with tumor in mediastinum (adjusted OR = 0.27, 95% CI = 0.11–0.68, P = 0.006), and subgroup with early clinical stages (adjusted OR = 0.42, 95% CI = 0.22–0.82, P = 0.010).
Table 3: Stratification analysis of risk genotypes with neuroblastoma susceptibility
aAdjusted for age and gender.
The false-positive report probability (FPRP) values for the notable findings at different prior probability levels were shown in Table 4. Overall, FPRP analysis indicated that at the prior probability level of 0.1, significance of most of the statistically significant findings disappeared except for the decreased risk observed for carriers of rs110419 AG genotype (FPRP = 0.169) and AG/GG genotypes (FPRP = 0.093) when compared to carriers of the AA genotype. As to the stratification analyses, we found that only the association between the AG/GG genotypes and the decreased neuroblastoma risk in children of age > 18 months was still noteworthy (FPRP = 0.143). Most of the significant findings being not noteworthy in FPRP analysis may be ascribed to the limited sample sizes in the current study, especially in the subgroup. Therefore, the significant findings derived from the current study need further validation in prospective studies with large sample size.
Table 4: False-positive report probability values for the associations between neuroblastoma susceptibility and the frequency of genotypes of the LMO1 gene
Genotype |
Crude OR (95% CI) |
Pa |
Statistical powerb |
Prior probability |
||||
|---|---|---|---|---|---|---|---|---|
0.25 |
0.1 |
0.01 |
0.001 |
0.0001 |
||||
LMO1 rs110419 A > G |
||||||||
AG vs. AA |
0.66 (0.47–0.91) |
0.012 |
0.544 |
0.064 |
0.169 |
0.691 |
0.958 |
0.996 |
GG vs. AA |
0.57 (0.36–0.90) |
0.017 |
0.284 |
0.149 |
0.344 |
0.852 |
0.983 |
0.998 |
AG/GG vs. AA |
0.64 (0.47–0.87) |
0.004 |
0.368 |
0.033 |
0.093 |
0.531 |
0.919 |
0.991 |
AG/GG vs. AA |
||||||||
> 18 |
0.54 (0.36–0.81) |
0.003 |
0.140 |
0.053 |
0.143 |
0.647 |
0.949 |
0.995 |
Males |
0.63 (0.42–0.95) |
0.027 |
0.382 |
0.173 |
0.386 |
0.873 |
0.986 |
0.999 |
Adrenal gland |
0.36 (0.20–0.66) |
0.001 |
0.027 |
0.098 |
0.247 |
0.783 |
0.973 |
0.997 |
Mediastinum |
0.59 (0.37–0.92) |
0.022 |
0.285 |
0.185 |
0.406 |
0.882 |
0.987 |
0.999 |
Stage III + IV |
0.57 (0.38–0.85) |
0.006 |
0.215 |
0.079 |
0.204 |
0.738 |
0.966 |
0.996 |
Protective genotypes |
||||||||
4 vs. 0–3 |
0.51 (0.32–0.81) |
0.005 |
0.148 |
0.084 |
0.215 |
0.751 |
0.968 |
0.997 |
> 18 |
0.45 (0.24–0.87) |
0.016 |
0.141 |
0.258 |
0.510 |
0.92 |
0.991 |
0.999 |
Males |
0.41 (0.23–0.76) |
0.004 |
0.076 |
0.139 |
0.326 |
0.842 |
0.982 |
0.998 |
Mediastinum |
0.27 (0.11–0.68) |
0.005 |
0.040 |
0.284 |
0.543 |
0.929 |
0.992 |
0.999 |
Stage I + II + 4s |
0.43 (0.23–0.84) |
0.013 |
0.115 |
0.248 |
0.497 |
0.916 |
0.991 |
0.999 |
aChi-square test was used to calculate the genotype frequency distributions
bStatistical power was calculated using the number of observations in the subgroup and the OR and P values in this table.
DISCUSSION
In the current case-control study with 256 neuroblastoma cases and 531 healthy controls, we verified that the LMO1 rs110419 A > G polymorphism was associated with a decreased neuroblastoma risk. To the best of our knowledge, this is the first study to investigate the association between LMO1 gene polymorphisms and neuroblastoma susceptibility in Southern Chinese children.
LMO1 gene is located on 11p15, which encodes a cysteine-rich transcriptional regulator comprising two LIM zinc-binding domains. LMO family has another three superfamily numbers, LMO2, LMO3 and LMO4 [26, 27]. The LMO1 is mainly expressed in the nervous system, and involved in the nervous system development [28]. Null mutation of the LMO4 gene, or the LMO1/LMO3 genes could lead to perinatal lethality in mice [29], while the homozygous LMO1 gene mutant mice show no overt phenotype [29]. LMO1 gene can act together with SCL oncogene to facilitate the expansion of primitive thymocyte progenitors and interrupt later stages of differentiation [30]. Common genetic variants in the LMO1 gene may increase the risk of relevant diseases through a cis-acting effect on the regulation of expression or function of LMO1 [21]. Aberrant LMO1 locus resulting from a duplication event was associated with more advanced disease and unfavorable survival in neuroblastoma patients [21]. Apart from neuroblastoma, the LMO1 gene polymorphisms were also associated with acute lymphoblastic leukemia susceptibility [31]. Additionally, recent studies indicated that in the anti-EGFR therapy, overexpression of LMO1 may be a predictive marker for the colorectal cancer [32], lung cancer [33], and prostate cancer [34].
GWAS is a hypothesis-free and powerful method to discovery inherited genetic variations that are associated with human disease susceptibility [19]. In the first GWAS carried out in European descent with a total of 1752 neuroblastoma cases and 4171 controls, three SNPs in the CASC15 gene were found to be associated with increased neuroblastoma risk [1]. The association was verified by the replication studies conducted in Italians [23] and Chinese children [18, 24], but not in African-Americans [22]. In the extended GWAS by Wang et al. [21], a total of 2251 neuroblastoma patients and 6097 controls of European ancestry were enrolled. They further found that the LMO1 gene polymorphisms were associated with neuroblastoma susceptibility, and the most significant SNP is rs110419 A > G polymorphism with a combined P = 5.2*10−16. The association between LMO1 gene polymorphisms and neuroblastoma susceptibility was confirmed by their following expanded GWAS study with a total of 2817 neuroblastoma cases and 7473 controls [35].
In the validation study in African-Americans with a total of 390 cases and 2500 controls, Latorre et al. [22] failed to replicate any association between the four SNPs in the LMO1 gene and neuroblastoma susceptibility. In another case-control study with 370 cases and 809 controls from Italy, Capasso et al. [23] chose two most significant SNPs (rs110419 A > G and rs4758051 G > A) to assess the association with neuroblastoma susceptibility. They found that the rs110419 A > G polymorphism, but not rs4758051 G > A, was associated with neuroblastoma susceptibility. In the study among Northern Chinese subjects, Lu et al. [24] genotyped 26 SNPs in a total of 244 neuroblastoma cases and 305 controls, including the four SNPs (rs110419 A > G, rs4758051 G > A, rs10840002 A > G and rs204938 A > G) discovered by the previous GWAS study. Totally, 11 out of 26 SNPs showed association with neuroblastoma susceptibility. They observed the significant association with rs110419 A > G and rs204938 A > G, but not with other two GWAS-identified polymorphisms (rs4758051 G > A and rs10840002 A > G). In our study conducted in Southern Chinese children, we was only able to validate the association for the most noteworthy SNP, rs110419 A > G, but failed to repeat the association between the rest three polymorphism and neuroblastoma risk. Failure to replicate the association with the SNPs in previous studies as well as ours may be ascribed to the relative weak effect of the GWAS-identified SNPs (P = 5.2*10−16 for rs110419 A > G, while P = 1.4*10−11 for rs4758051 G > A, P = 1.7*10−7 for rs204938 A > G, and P = 8.5*10−7 for rs10840002 A > G polymorphism), ethnicity difference (the previous finding were from European descent), and limited sample sizes in most of the validation studies. In the FPRP analysis, most of the significant findings in the current study appeared to be not noteworthy at the FPRP threshold of 0.2, which may be due to the limited sample size in each stratum. Aberrant LMO1 was associated with more advanced disease [21], and the ancestral rs2168101 G allele was associated with tumor formation [36]. We found that the rs110419 AG/GG genotypes were associated with decreased neuroblastoma susceptibility in patients with advanced stage neuroblastoma. However, when we performed FPRP analysis, the association appeared to be not noteworthy at the FPRP threshold of 0.2. Therefore, the conclusions drawn from the current study should be interpreted cautiously. In the future, the studies with much larger sample size are encouraged to validate our findings.
Though this study is the largest one performed in Chinese children and the first investigation in Southern Chinese subjects, certain limitations should be acknowledged. First, the sample size in the current study is still not large enough, because of the very low incidence rate of neuroblastoma. Therefore, multicenter studies with larger sample size are needed to confirm the roles of LMO1 in neuroblastoma susceptibility. Second, we only tested the four LMO1 SNPs that were discovered by previous GWAS. None of these SNPs is potentially functional. More potentially functional SNPs located in the LMO1 gene should be investigated, such as the rs2168101 G > T polymorphism that was found to be associated with neuroblastoma recently [36]. Finally, in the current study, we only adjusted for age and gender in the logistic regression analysis. Due to the nature of retrospective study, we were not able to collect and control for other factors, such as the dietary intakes as well as the environment exposure for their parents and the children.
In summary, the present hospital-based case-control study confirmed that the LMO1 gene rs110419 G allele was associated with decreased neuroblastoma susceptibility in a Southern Chinese population. However, future studies with larger sample size and functional experiments should be conducted to further explore the role of LMO1 and underlying mechanisms in neuroblastoma carcinogenesis.
MATERIALS AND METHODS
Study population
In the current study, all the neuroblastoma cases and healthy controls were restricted to unrelated ethnic Chinese Han. A total of 256 patients with neuroblastoma were mainly recruited at the Department of Pediatric Surgery of the Guangzhou Women and Children’s Medical Center between February 2010 and November 2015, as we described previously [18, 37]. All of the neuroblastoma cases were newly diagnosed and histopathologically confirmed, and had not previous history of other cancers. No restriction was applied regarding age, gender, or disease stage at the time of recruiting neuroblastoma cases. The 531 age-, gender-, and ethnicity-matched healthy controls were also collected from the Guangzhou Women and Children’s Medical Center as described elsewhere [18, 37]. All the included subjects provided written informed consent signed by their parents or guardians. This study was approved by the Institutional Review Board of Guangzhou Women and Children’s Medical Center (GZR2015-099).
SNP selection and genotyping
We chose all of the four SNPs (rs110419 A > G, rs4758051 G > A, rs10840002 A > G and rs204938 A > G) in the LMO1 gene identified by a previous GWAS study [21]. These four SNPs can also capture an additional of 10 SNPs with a linkage disequilibrium (LD) > 0.6 (Supplementary Table 1). We performed Taqman real-time PCR assay to genotype these SNPs as we described previously [18, 38]. Briefly, high-quality DNA samples were genotyped using Taqman real-time PCR method on a 7900 HT sequence detector system (Applied Biosystems, Foster City, CA, USA). Eight positive controls and eight negative controls were included in each 384-well plate. Additionally, 10% samples were randomly selected and repeated, and the reproducibility was 100% concordant.
Statistical analysis
Genotype frequencies of each SNP as well as the demographic variables (e.g., age and gender) between neuroblastoma cases and healthy controls were compared using the χ2 test. ORs and corresponding 95% CIs were calculated by unconditional logistic regression analyses adjusted for age and gender. Genotypic frequencies in controls for each SNP were tested for departure from HWE using goodness-of-fit χ2 test. The FPRP was calculated for all significant findings as described previously [39–41]. We preset 0.2 as a FPRP threshold and chose a prior probability of 0.1 to detect OR of 0.67 (for protective effects). Association with FPRP value less than 0.2 was recognized as noteworthy. Statistical analyses were performed using SAS software (Version 9.1; SAS Institute, Cary, NC). All P values in the current study were two-sided, and a P value of less than 0.05 was considered as statistical significance.
ACKNOWLEDGMENTS AND FUNDING
This work was supported by the grant of State Clinical Key Specialty Construction Project (Pediatric Surgery) 2013 (No: GJLCZD1301), the grant of clinical medicine research and transformation center of brain injury in premature infant in Guangzhou (No: 520101–2150092) and Special Financial Grant from the China Postdoctoral Science Foundation (Grant No. 2014T70836). We thank Yanlu Tong and Hezhen Wang for their assistance in DNA extraction and medical histories information collection.
Authors’ contributions
All authors contributed significantly to this work. J.H., W.Z., J.-X. Z., R.Z., F.W., T.Y. and Y.Z. performed the research study and collected the data; J.H., and W.Z. analyzed the data; J.H. and H.X. designed the research study; J.H., J.-H. Z., and H.X. wrote the paper, and J.H. and R.Z. prepared all the Tables. All authors reviewed the manuscript. In addition, all authors approved the final draft.
CONFLICTS OF INTEREST
The authors declare no competing financial interests.
REFERENCES
1. Maris JM, Mosse YP, Bradfield JP, Hou C, Monni S, Scott RH, Asgharzadeh S, Attiyeh EF, Diskin SJ, Laudenslager M, Winter C, Cole KA, Glessner JT, et al. Chromosome 6p22 locus associated with clinically aggressive neuroblastoma. N Engl J Med. 2008; 358:2585–2593.
2. Maris JM, Hogarty MD, Bagatell R, Cohn SL. Neuroblastoma. Lancet. 2007; 369:2106–2120.
3. Gurney JG, Ross JA, Wall DA, Bleyer WA, Severson RK, Robison LL. Infant cancer in the U.S.: histology-specific incidence and trends, 1973 to 1992. J Pediatr Hematol Oncol. 1997; 19:428–432.
4. Bao PP, Li K, Wu CX, Huang ZZ, Wang CF, Xiang YM, Peng P, Gong YM, Xiao XM, Zheng Y. [Recent incidences and trends of childhood malignant solid tumors in Shanghai, 2002–2010]. Zhonghua Er Ke Za Zhi. 2013; 51:288–294.
5. Knudson AG, Jr., Strong LC. Mutation and cancer: neuroblastoma and pheochromocytoma. Am J Hum Genet. 1972; 24:514–532.
6. Capasso M, Diskin SJ. Genetics and genomics of neuroblastoma. Cancer Treat Res. 2010; 155:65–84.
7. Matthay KK, Villablanca JG, Seeger RC, Stram DO, Harris RE, Ramsay NK, Swift P, Shimada H, Black CT, Brodeur GM, Gerbing RB, Reynolds CP. Treatment of high-risk neuroblastoma with intensive chemotherapy, radiotherapy, autologous bone marrow transplantation, and 13-cis-retinoic acid. Children’s Cancer Group. N Engl J Med. 1999; 341:1165–1173.
8. Berthold F, Boos J, Burdach S, Erttmann R, Henze G, Hermann J, Klingebiel T, Kremens B, Schilling FH, Schrappe M, Simon T, Hero B. Myeloablative megatherapy with autologous stem-cell rescue versus oral maintenance chemotherapy as consolidation treatment in patients with high-risk neuroblastoma: a randomised controlled trial. Lancet Oncol. 2005; 6:649–658.
9. Laverdiere C, Liu Q, Yasui Y, Nathan PC, Gurney JG, Stovall M, Diller LR, Cheung NK, Wolden S, Robison LL, Sklar CA. Long-term outcomes in survivors of neuroblastoma: a report from the Childhood Cancer Survivor Study. J Natl Cancer Inst. 2009; 101:1131–1140.
10. Kaatsch P. Epidemiology of childhood cancer. Cancer Treat Rev. 2010; 36:277–285.
11. Groopman JD, Kensler TW, Links JM. Molecular epidemiology and human risk monitoring. Toxicol Lett. 1995; 82–83:763–769.
12. De Roos AJ, Olshan AF, Teschke K, Poole C, Savitz DA, Blatt J, Bondy ML, Pollock BH. Parental occupational exposures to chemicals and incidence of neuroblastoma in offspring. Am J Epidemiol. 2001; 154:106–114.
13. De Roos AJ, Teschke K, Savitz DA, Poole C, Grufferman S, Pollock BH, Olshan AF. Parental occupational exposures to electromagnetic fields and radiation and the incidence of neuroblastoma in offspring. Epidemiology. 2001; 12:508–517.
14. Pajic M, Murray J, Marshall GM, Cole SP, Norris MD, Haber M. ABCC1 G2012T single nucleotide polymorphism is associated with patient outcome in primary neuroblastoma and altered stability of the ABCC1 gene transcript. Pharmacogenet Genomics. 2011; 21:270–279.
15. Han W, Zhou Y, Zhong R, Wu C, Song R, Liu L, Zou L, Qiao Y, Zhai K, Chang J, Huang L, Lu X, Lou J, et al. Functional polymorphisms in FAS/FASL system increase the risk of neuroblastoma in Chinese population. PLoS One. 2013; 8:e71656.
16. Capasso M, Diskin S, Cimmino F, Acierno G, Totaro F, Petrosino G, Pezone L, Diamond M, McDaniel L, Hakonarson H, Iolascon A, Devoto M, Maris JM. Common genetic variants in NEFL influence gene expression and neuroblastoma risk. Cancer Res. 2014; 74:6913–6924.
17. Jin Y, Wang H, Han W, Lu J, Chu P, Han S, Ni X, Ning B, Yu D, Guo Y. Single nucleotide polymorphism rs11669203 in TGFBR3L is associated with the risk of neuroblastoma in a Chinese population. Tumour Biol. 2015; doi: 10.1007/s13277–015–4192–6.
18. He J, Zhang R, Zou Y, Zhu J, Yang T, Wang F, Xia H. Evaluation of GWAS-identified SNPs at 6p22 with neuroblastoma susceptibility in a Chinese population. Tumour Biol. 2015; doi: 10.1007/s13277–015–3936–7.
19. Frazer KA, Murray SS, Schork NJ, Topol EJ. Human genetic variation and its contribution to complex traits. Nat Rev Genet. 2009; 10:241–251.
20. Capasso M, Devoto M, Hou C, Asgharzadeh S, Glessner JT, Attiyeh EF, Mosse YP, Kim C, Diskin SJ, Cole KA, Bosse K, Diamond M, Laudenslager M, et al. Common variations in BARD1 influence susceptibility to high-risk neuroblastoma. Nat Genet. 2009; 41:718–723.
21. Wang K, Diskin SJ, Zhang H, Attiyeh EF, Winter C, Hou C, Schnepp RW, Diamond M, Bosse K, Mayes PA, Glessner J, Kim C, Frackelton E, et al. Integrative genomics identifies LMO1 as a neuroblastoma oncogene. Nature. 2011; 469:216–220.
22. Latorre V, Diskin SJ, Diamond MA, Zhang H, Hakonarson H, Maris JM, Devoto M. Replication of neuroblastoma SNP association at the BARD1 locus in African-Americans. Cancer Epidemiol Biomarkers Prev. 2012; 21:658–663.
23. Capasso M, Diskin SJ, Totaro F, Longo L, De Mariano M, Russo R, Cimmino F, Hakonarson H, Tonini GP, Devoto M, Maris JM, Iolascon A. Replication of GWAS-identified neuroblastoma risk loci strengthens the role of BARD1 and affirms the cumulative effect of genetic variations on disease susceptibility. Carcinogenesis. 2013; 34:605–611.
24. Lu J, Chu P, Wang H, Jin Y, Han S, Han W, Tai J, Guo Y, Ni X. Candidate Gene Association Analysis of Neuroblastoma in Chinese Children Strengthens the Role of LMO1. PLoS One. 2015; 10:e0127856.
25. Brodeur GM, Pritchard J, Berthold F, Carlsen NL, Castel V, Castelberry RP, De Bernardi B, Evans AE, Favrot M, Hedborg F, et al. Revisions of the international criteria for neuroblastoma diagnosis, staging, and response to treatment. J Clin Oncol. 1993; 11:1466–1477.
26. Rabbitts TH, Boehm T. LIM domains. Nature. 1990; 346:418.
27. Boehm T, Foroni L, Kennedy M, Rabbitts TH. The rhombotin gene belongs to a class of transcriptional regulators with a potential novel protein dimerisation motif. Oncogene. 1990; 5:1103–1105.
28. Greenberg JM, Boehm T, Sofroniew MV, Keynes RJ, Barton SC, Norris ML, Surani MA, Spillantini MG, Rabbitts TH. Segmental and developmental regulation of a presumptive T-cell oncogene in the central nervous system. Nature. 1990; 344:158–160.
29. Tse E, Smith AJ, Hunt S, Lavenir I, Forster A, Warren AJ, Grutz G, Foroni L, Carlton MB, Colledge WH, Boehm T, Rabbitts TH. Null mutation of the Lmo4 gene or a combined null mutation of the Lmo1/Lmo3 genes causes perinatal lethality, and Lmo4 controls neural tube development in mice. Mol Cell Biol. 2004; 24:2063–2073.
30. Tremblay M, Tremblay CS, Herblot S, Aplan PD, Hebert J, Perreault C, Hoang T. Modeling T-cell acute lymphoblastic leukemia induced by the SCL and LMO1 oncogenes. Genes Dev. 2010; 24:1093–1105.
31. Beuten J, Gelfond JA, Piwkham D, Pollock BH, Winick NJ, Collier AB, 3rd and Tomlinson GE. Candidate gene association analysis of acute lymphoblastic leukemia identifies new susceptibility locus at 11p15 (LMO1). Carcinogenesis. 2011; 32:1349–1353.
32. Liu J, Yan P, Jing N, Yang J. LMO1 is a novel oncogene in colorectal cancer and its overexpression is a new predictive marker for anti-EGFR therapy. Tumour Biol. 2014; 35:8161–8167.
33. Zhang Y, Yang J, Wang J, Guo H, Jing N. LMO1 is a novel oncogene in lung cancer, and its overexpression is a new predictive marker for anti-EGFR therapy. Med Oncol. 2014; 31:99.
34. Gu H, Liu T, Cai X, Tong Y, Li Y, Wang C, Li F. Upregulated LMO1 in prostate cancer acts as a novel coactivator of the androgen receptor. Int J Oncol. 2015; 47:2181–2187
35. Diskin SJ, Capasso M, Schnepp RW, Cole KA, Attiyeh EF, Hou C, Diamond M, Carpenter EL, Winter C, Lee H, Jagannathan J, Latorre V, Iolascon A, et al. Common variation at 6q16 within HACE1 and LIN28B influences susceptibility to neuroblastoma. Nat Genet. 2012; 44:1126–1130.
36. Oldridge DA, Wood AC, Weichert-Leahey N, Crimmins I, Sussman R, Winter C, McDaniel LD, Diamond M, Hart LS, Zhu S, Durbin AD, Abraham BJ, Anders L, et al. Genetic predisposition to neuroblastoma mediated by a LMO1 super-enhancer polymorphism. Nature. 2015; 528:418–421.
37. Zhang R, Zou Y, Zhu J, Zeng X, Yang T, Wang F, He J, Xia H. The association between GWAS-identified BARD1 gene SNPs and neuroblastoma susceptibility in a Southern Chinese population. Int J Med Sci. 2016; 13:133–138.
38. He J, Qiu LX, Wang MY, Hua RX, Zhang RX, Yu HP, Wang YN, Sun MH, Zhou XY, Yang YJ, Wang JC, Jin L, Wei QY, et al. Polymorphisms in the XPG gene and risk of gastric cancer in Chinese populations. Hum Genet. 2012; 131:1235–1244.
39. He J, Xu Y, Qiu LX, Li J, Zhou XY, Sun MH, Wang JC, Yang YJ, Jin L, Wei QY, Wang Y. Polymorphisms in ERCC1 and XPF genes and risk of gastric cancer in an eastern Chinese population. PLoS One. 2012; 7:e49308.
40. He J, Wang MY, Qiu LX, Zhu ML, Shi TY, Zhou XY, Sun MH, Yang YJ, Wang JC, Jin L, Wang YN, Li J, Yu HP, et al. Genetic variations of mTORC1 genes and risk of gastric cancer in an Eastern Chinese population. Mol Carcinog. 2013; 52:E70–79.
41. Wacholder S, Chanock S, Garcia-Closas M, El Ghormli L, Rothman N. Assessing the probability that a positive report is false: an approach for molecular epidemiology studies. J Natl Cancer Inst. 2004; 96:434–442.