
Introduction
Chronic kidney diseases (CKD) have a complicated etiology and pathology and the mechanisms underlying their pathogenesis remain unclear. Uremic toxins promote progression of CKD with complications [1-3]. Mounting evidence has shown that uremic retention solutes originate from colonic microbial metabolisms, such as indoleamines derived from the bacterial metabolites, which can contribute to uremic toxins, including indoxyl sulfate (IS), through the gut-kidney axis [4, 5]. IS that originates from the gut microbiota fermentation turns out to be an independent risky factor for CKD and cardiovascular diseases (CVD) [6]. On the other hand, previous studies have suggested that gut microbiota are altered under CKD state and that this dysbiosis in turn contributes to the progression of CKD [7, 8]. Recent studies have revealed some effective treatments of the CKD with altering uremic toxins and gut microbiota through targeting the colonic environment, including oral administration of AST-120 to adsorb uremic toxins [9], and prebiotics or probiotics to modulate gut microbiota [8, 10]. However, the relevance of gut microbiota to CKD and uremic toxins is not well understood.
Emodin (1,3,8-trihydroxy-6-methylanthraquinone) is a naturally occurring anthraquinone present in the roots and barks of numerous plants [11, 12], and especially, an important active ingredient of Chinese herb Rhubarb (Da Huang) [13]. Emodin is laxative, antibacterial, immunosuppressive, and diuretic [14-17]. It is often used for the treatment of constipation. Previous researches have also shown that emodin glycoside is cleaved by the intestinal bacteria to release emodin, which in turn activates the underlying smooth muscle cells, leading to muscle contraction. It also inhibits the activity of KATP channel and the ion transport (chloride) across colon cells [18] due to its laxative effect. Rhubarb, a laxative Chinese medical herb since ancient time, has been widely used to reduce uremic toxins for the treatment of CKD in China [19, 20]. But it has been used more often via colonic administration than via oral administration since early 1950s [21]. Our previous studies have demonstrated that rhubarb-based decoction enema reduces the uremic toxins, including urea, creatinine and IS, preserves the renal function and help patients avoid the dialysis [22]. But mechanisms underlying its effects are not understood. We speculated that treatments with rhubarb via colonic route modulate the multiple targets on gut microbiota and metabolic toxins through the gut-kidney axis to improve the renal function. Here, we examined structural alterations of gut microbiota and levels of uremic toxins in response to emodin colonic irrigation (ECI). We found that ECI markedly reduced the levels of uremic toxins, including urea and IS, and modulated the gut microbiota. In particular, ECI reduced the number of harmful bacteria, such as Clostridium spp. but increased the number of beneficial bacteria, including Lactobacillus spp.
Results
Kidney function is improved by ECI
Data are summarized in Table 1. Compared with the sham-operation control group (CTL), CKD groups with either emodin colonic irrigation (ECI) or control colonic irrigation (CCI) showed a significant increase in creatinine and urea concentrations as well as urinary protein excretion, but an decrease in hemoglobin and hematocrit levels, creatinine clearance and body weight. Then compared with CCI control groups, ECI significantly lowered urea concentrations and urinary protein excretion, slightly reduced creatinine without statistic significance, improved creatinine clearance and body weight, and increased hemoglobin and hematocrit levels.
Table 1: Changes in body weight and renal function after ECI or CCI
BW(g) |
Creatinine(mg/dl) |
Urea (mg/dl) |
Hb(g/L) |
U PCR(g/g Cr) |
Hematocrit(%) |
Ccr(ml/min/kg) |
|
CTL |
389±14.15 |
0.40±0.06 |
48±13.51 |
145±7.20 |
0.54±0.11 |
40.8±2.28 |
6..09±1.15 |
CCI |
350±13.00* |
0.97±0.12* |
114±25.80* |
127±10.75* |
16.24±4.02* |
35.7±2.55* |
2.45±1.23* |
ECI |
359±13.10* |
0.92±0.10* |
84±12.40*Δ |
129±16.18* |
9.48±2.34*Δ |
36.1±5.39* |
3.21±0.29* |
Body weights were measured and serum samples were collected and analyzed 4 weeks after CCI or ECI treatments following the 5/6 nephrectomy.
Abbreviations: BW, body weight; Ccr, creatinine clearance rate; Hb, hemoglobin;
U PCR, unrine protein creatinine ratio; Cr, serum creatinine; CTL, sham-operation control without 5/6 nephrectomy; ECI, emodin colonic irrigation; CCI, control colonic irrigation.
Values are presented as Mean ± SD
*p < 0.05 compared with CTL;Δp < 0.05 compared with CCI.
ECI significantly reduced uremic toxin IS
After the treatments for 4 weeks, the serum samples were analyzed by HPLC-MS, as shown in Figure 1. When compared with the control (CTL), experimental groups with 5/6 nephrectomy and CCI control exhibited a significant increase in the IS levels (4.13±0.52 vs 1.45±0.36 μg/mL; p < 0.01). However, ECI treatments significantly reduced its level compared with CCI control (1.97±0.64 vs 4.13±0.52 μg/mL; p < 0.01). There was no statistical difference between CTL controls and ECI groups.
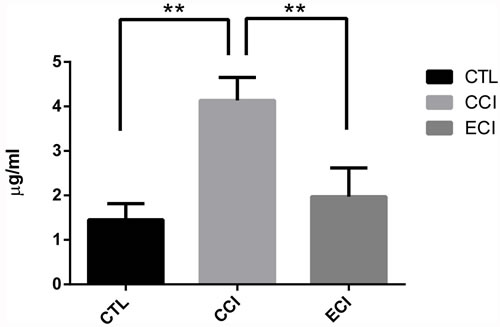
Figure 1: Concentrations of the indoxyl sulfate (IS) in serum after ECI or CCI (μg/ml). Serum samples were collected and analyzed by HPLC-MS 4 weeks after CCI or ECI treatments following the 5/6 nephrectomy. Data are presented as Mean ± SD *p < 0.05, **p < 0.01.
The dominant fecal microbiota changes with ECI
The dominant fecal microbiota were profiled by real-time qPCR. There was no significant change with total numbers of all bacteria among all groups. Compared with the CTL group, Clostridium Perfringens (C. perfringens) in experimental CCI control group was increased significantly, whereas the Lactobacillus was significantly decreased. Moreover, compared with the CCI control group, Lactobacillus in ECI group was remarkably increased whereas Enteroroccus, Escherichia coli (E. coli) and C. perfringens in ECI group was significantly reduced. Finally, Bacteroides fragilis (B. fragilis) did not change among all groups (Table 2 and Figure 2).
Table 2: Quantification of bacteria in the fecal microbiota by Real-time qPCR (log10copies/g stool)
E.coli |
Lactobacillus |
Bifidbacteria |
B.fragilis |
Enteroroccus |
C. perfringens |
All bacteria |
|
CTL |
7.30±0.50 |
7.08±0.38 |
7.87±0.36 |
11.04±0.18 |
7.03±0.47 |
7.81±0.30 |
11.59±0.37 |
CCI |
7.65±0.70 |
6.71±0.38* |
7.95±0.46 |
11.08±0.79 |
7.21±0.71 |
8.46±0.43* |
11.72±0.18 |
ECI |
6.97±0.76Δ |
7.12±0.36Δ |
8.27±0.28* |
11.01±0.11 |
6.46±0.26*Δ |
8.14±0.16*Δ |
11.61±0.28 |
*P < 0.05, compared with CTL.
ΔP < 0.05, compared with CCI
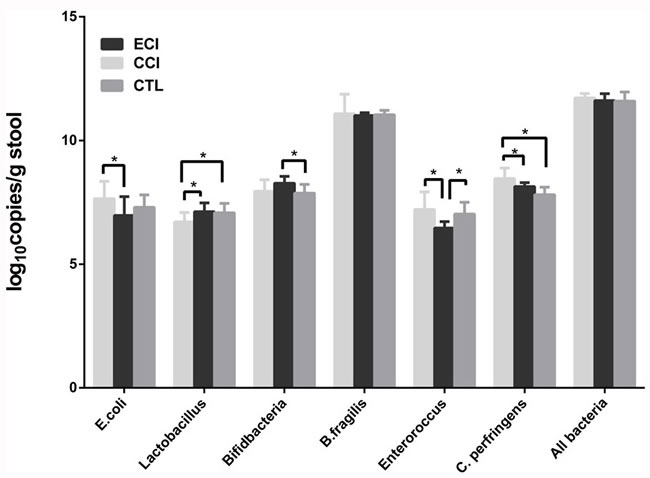
Figure 2: Quantifications of bacteria in the fecal microbiota (log10copies/g stool). Real-time qPCR was performed to detect the fecal microbiota 4 weeks after CCI or ECI treatments following the 5/6 nephrectomy. Data are presented as Mean ± SD, *p < 0.05.
Overall structural changes of gut microbiota after ECI treatments
Using a bar-coded pyrosequencing of V3-V5 region of 16S rRNA genes of 128,238 valid reads in the three groups from 31 samples, we got total 3,744 operational taxonomic units (OTUs) with an average of 488 OTUs per sample (±120 sd.). The Venn diagram determined the shared and unique OTUs that some different structures were showed in each group (Supplementary Figure S1). The rarefaction curves and the alpha diversity analysis have shown the most characters of the samples, with most diversities being captured (Supplementary Figure S2 and Table S1). Weighted and unweighted UniFrac PCoA analysis revealed that the gut microbiota structure of the three groups exhibited a deviation away from one another (Figure 3).
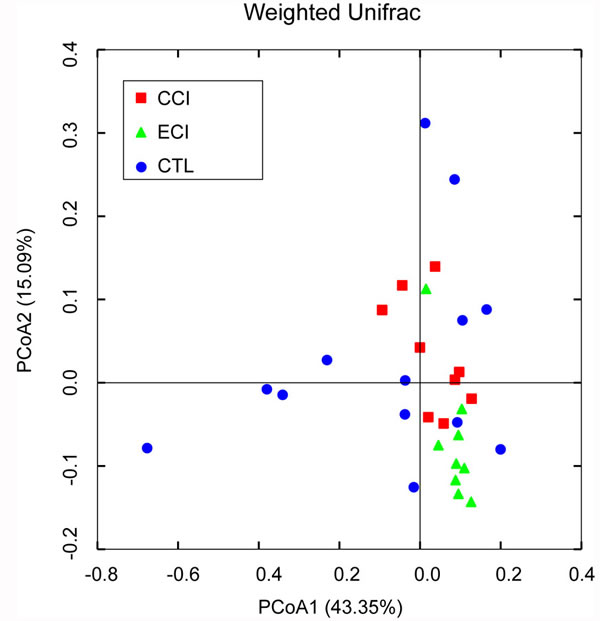
Figure 3: Weighted Unifrac PCoA analysis of gut microbiota based on the OTU data from pyrosequencing run. A point represents a sample from each group. The sample numbers (n) in each group: CTL = 13, CCI = 9, and ECI = 9.
Key microbiota changes following ECI and its association with uremic toxins including urea and IS
In this study, we provided a broad view of the gut microbiota. A total of 8 phyla, 12 classes, 13 orders, 32 families, and 47 genera were represented. At the phylum level, the most abundant were Bacteroidetes (51.1% counts in CCI control group, 43.2% in ECI group and 53.7% counts in CTL control group), Firmicutes (45.4%counts in CCI control group, 48.3% in ECI group and 43.1%counts in CTL control group), Tenericutes (2.0%counts in CCI control group, 4.7% in ECI group and 1.8%counts in CTL control group), and Proteobacteria (0.7%counts in CIC control group, 1.3% in ECI group and 0.7%counts in CTL control group) (Figure 4A). The four phyla were the predominant ones constituting 98.6% of total microbiota.
As described in other studies [7, 23, 24], Firmicutes, Bacteroidetes and Proteobacteria phyla were consistently present with the greatest numbers. But in our study, Tenericutes was also very abundant and significantly increased in ECI group compared with CCI control or CTL control group (P < 0.05), while there was no difference in other three phyla between all groups. The phyla of Actinobacteria and Spirochaetes were only found in ECI group with 0.1% counts for both. The remaining bacteria belonged to the Cyanobacteria, Deferribacteres, Elusimicrobia, Lentisphaerae, Spirochaetes and Verrucomicrobia with less than 0.5% counts.
At the genus level, there was a difference in 47 genera (Figure 4B), with 3 genera found only in CTL group, 6 genera only in CCI control group, and 3 genera only in ECI group. Among all genera, the genera from the families of Prevotellaceae, S24-7, Bacteroidaceae, Paraprevotellaceae, Lactobacillaceae, Ruminococcaceaeha, Lachnospiraceae and unclassified Clostridiales order were dominant. The five classified genera (Bacteroides, Prevotella, Lactobacillus, Oscillospira, and Ruminococcus) were most abundant in each group. Meanwhile, compared with the CTL, Lactobacillus was decreased significantly in CCI control group while genera of Ruminococcus, Clostridium and unclassified genus from Ruminococcaceae family, which were all from Clostridiales order, were increased in CCI control group. Then compared with CCI control group, the unclassified genera from S24-7 family and Clostridium were remarkably decreased in ECI group, whereas Bacteroides and unclassified genus from RF39 order were markedly increased in ECI group with a slight improvement of the Lactobacillus also in ECI group without statistical significance. Among all genera observed, only Adlercreutzia, Bacteroides, unclassified genera from RF39 order and Ruminococcaceae family were significantly increased in ECI group compared with CTL control group.
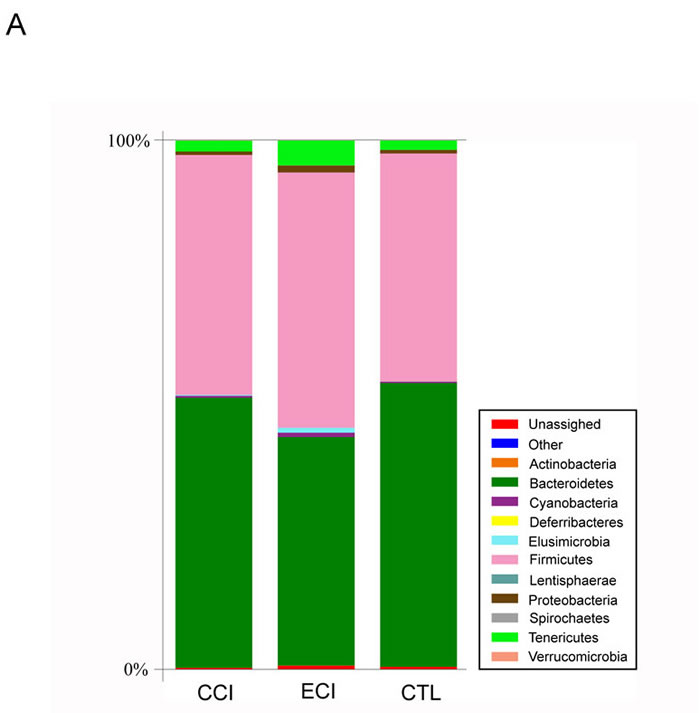
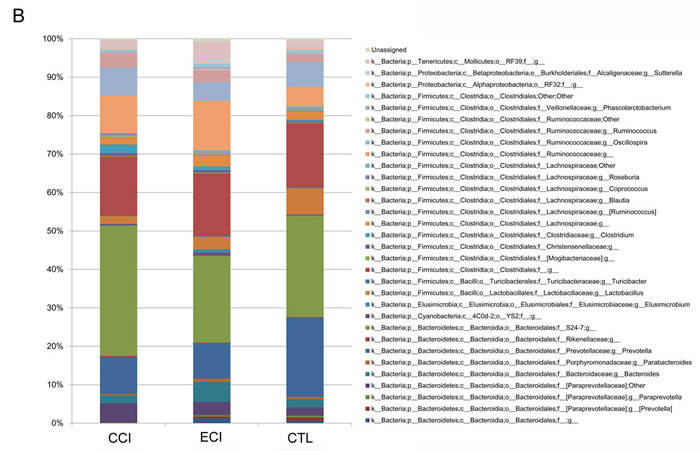
Figure 4: Relative abundance of the gut microbiota. A. abundance and prevalence of the different bacterial phyla in each group. B. abundance and prevalence of the different bacterial genera in each group.
Using redundancy analyses, we chose 56 core genera that responded to ECI treatments (Figure 5). We found that 10 genera (unclassified S24-7 family, unclassified Paraprevotellaceaea family, Ruminococcus, Clostridium, Elusimicrobium, Roseburia, Allobaculum, Epulopiscium, and Christensenella) exhibited a significant positive correlation with Urea, while 4 genera (Prevotella, Lactobacillus, Streptococcus, and Helicobacter) had a significant negative correlation with Urea. 3 genera (unclassified Paraprevotellaceae family, Clostridium and Allobaculum) showed a significant positive correlation with IS, but no genus had a significant negative correlation with IS. The genus of Streptococcus trended to have a negative correlation with IS (Figure 6). Bifidobacterium genus was undetectable in all groups.
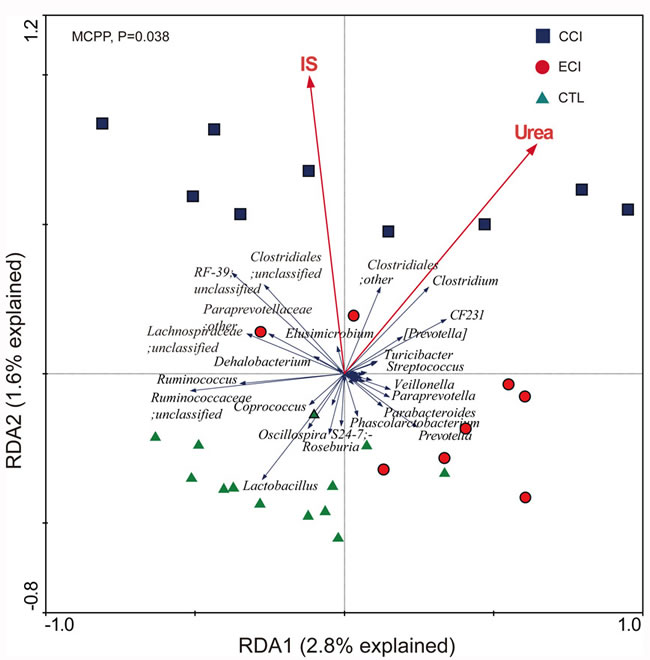
Figure 5: Biplot of redundancy analysis (RDA) of the gut microbiota compositions after ECI treatments in CKD rats. The uremic toxins of Urea and IS were used as environmental variables. On Top-left, P-value was obtained by Monte Carlo permutation procedure (MCPP).
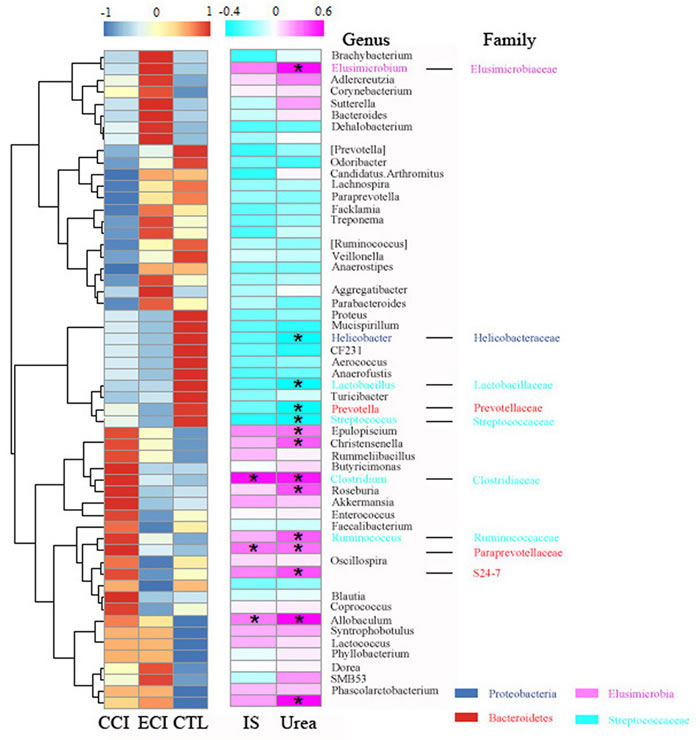
Figure 6: Heatmap of key bacterial genera responding to ECI treatments and Spearman’s correlation between genera and Urea or IS. The color of spots in the left panel represents the relative abundance of the genus in each group. The color of spots in the right panel represents R-value of Spearman’s correlation between genera and Urea or IS. The family and genus names are shown on the right. *p < 0.05.
Discussion
In this study, we sought to understand the mechanisms by which ECI improves renal function by focusing on the change of gut microbiota resulted from ECI intervention since gut microbiota has been shown to play a role in the generation of uremic toxins [4, 5]. We found that ECI markedly reduced the levels of uremic toxins, including urea and IS, and modulated the gut microbiota.
Uremia is largely due to the accumulation of organic waste products. At present, a treatment of uremia is to slow the progression of kidney failure or to finally replace kidney function with dialysis or a transplant. But, it has been difficult to reduce uremic toxins using western medicines. Unfortunately, dialysis causes many complications in CKD patients and lowers their quality of life. Kidney transplantation is also limited due to insufficient donors. Recently emerging are new approaches to treating uremia and preserving kidney function using Chinese medicine enema. For instance, rhubarb enema is one of the most important Chinese medicines for the treatment of various diseases. It is widely used to clear away uremic toxins and improve the uremic symptoms in China [21]. The current study demonstrated that ECI reduced the accumulation of uremic toxins urea and IS, which was consistent with our previous clinical observation [22]. Moreover, it also remarkably reduced the urinary protein excretion, suggesting that ECI slows the progression of kidney failure.
As a uremic toxin, IS is derived from gut microbial metabolism [25] and associated with progression of CKD and mortality [26]. When proteins are not digested in the gastrointestinal tract, fermentation of the amino acid tryptophan by intestinal microbiota generates indoles, which are further hydroxylated into 3-hydroxy-indole to generate IS. The latter circulates in equilibrium between a free solute fraction and a fraction bound to serum proteins to damage kidney function [5]. Urea, another important uremic toxin, is also associated with colonic environment where it is hydrolyzed by microbial urease to form ammonia [CO(NH2)2+H2O→CO2+2NH3], and it is a likely mediator that alters gut microbiota [27, 28]. These two uremic toxins damage intestinal barrier, leading to systemic inflammation with injured kidney functions [29]. The decrease in these uremic toxins and changes of gut microbiota after ECI treatments in this study suggest that gut microbiota is correlated with the uremic toxins.
Gut microbiota, mainly residing in the colon as a forgotten “big organ” [30], has approximately 500 different bacterial species and 1014 cells that is 10 times of total human cells, and plays an important role in human health and diseases [31]. The microbiota is complex, diverse, and stable within a big individual for long-term [32, 33]. But it changes with outer environment [34] and is a closely linked to CKD [8]. Vaziri et al have shown a significant difference in the abundance of 175 bacterial OTUs between uremic rats with 5/6 nephrectomy and control animals, with a significant decrease in the Lactobacillaceae and Prevotellaceae families in rats with 5/6 nephrectomy [7], similar to the findings by Mishima et al showing that abundance of Lactobacillaceae and Prevotellaceae families was decreased in adenine induced CKD mice [35]. We also found that the Lactobacillus genus from Lactobacillaceae family was markedly reduced in CCI control group of CRF according to both pyrosequencing and real-time PCR analyses. Like studies by Hide et al [36], the total number of bacteria in our study exhibited no any significant difference between each group, while the number of C. perfringens was increased in CCI control group with CRF. We also found that genera of Ruminococcus, Clostridium and unclassified genus from Ruminococcaceae family were also increased in CCI control group. A recent study demonstrated significant improvements in renal function as well as colonic inflammation and epithelial barrier structure in CKD rats fed with a high fiber diet [37], suggesting an important impact of the dietary restriction on the structure and function of microbiome. Thus, it remains to be defined how ECI treatments with dietary restriction would alter the gut microbiota.
Among strategies of improving renal function in CKD by reducing uremic toxins, new therapies targeting the colonic microenvironment aim to modulate gut microbiota or clear uremic toxin solutes derived from the microbiota metabolisms. We first detected the rat fecal microbiota and found that Clostridium was remarkably decreased after ECI treatments. Lactobacillus was improved in ECI group, while C. perfringens was reduced. But we found that Enteroroccus was markedly reduced while Bifidbacteria was improved with ECI treatments according to real-time quantitative PCR, though barely detectable by pyrosequencing. Hide et al reported that Enteroroccus was augmented but Bifidbacteria was decreased in CKD status, suggesting that the gut microbiota tends to resume the original balance in the healthy status upon ECI treatments.
Bacterial species are roughly categorized as the saccharolytic or proteolytic. Wong et al used Silico tests to find that bacterial families possessing urease, uricase, and indole-and p-cresol-forming enzymes were expanded while butyrate producing bacteria were reduced in patients with ESRD [38]. Similar to the findings by Wong et al, the harmful genus of Clostridium from Clostridiaceae family possessing urease and indole-forming enzymes was increased in CCI control with CRF and positively correlated with urea and IS, but this increase was offset by ECI treatments. In particular, the increase in C. perfringens from Clostridium genus was also abrogated by ECI treatments. Some studies also showed that Clostridium difficile from Clostridium genus is associated with increased mortality for CKD and ESRD [39, 40]. This finding proved that Clostridium is a bad bacterial genus, which increases the production of urea and IS in CKD, and that ECI treatments may reverse the course. On the other hand, the bacterial genera of Lactobacillus and Prevotella from the Lactobacillaceae and Prevotellaceae families possessing butyrate-producing enzymes were reduced in CCI control with CRF and negatively correlated with urea, while ECI treatments significantly rescued the genus of Lactobacillus, but not Prevotella. These two genera have been reported to confer beneficial effects of improving butyrate that can expand regulatory T cells in the large intestine [41]. Therefore, these ECI-induced beneficial genera may help attenuate inflammation by suppressing pro-inflammatory cells in CKD. It is noteworthy that the association of uremic toxins with gut microbiota changes induced by ECI is not in a cause-effect manner. Future studies are needed for establishing such a manner.
Materials and Methods
Animals, interventions and samples
Male Sprague-Dawley rats with a body weight of approximately 200g were used and purchased from Experimental Animal Center of Guangdong Province (Guangzhou, China). Animals were housed in a specific pathogen free (SPF) environment with 12 hours of light-dark cycles and were fed with standard laboratory food and water ad libitum. The animals were randomly assigned to the sham-operation control groups (CTL) and experimental groups. All experimental CRF groups underwent 5/6 of nephrectomy via surgical removal of the upper and lower thirds of the left kidney, and resection of whole right kidney seven days later. The procedures were conducted under common anesthesia using strictly aseptic techniques. The animals with CRF again were randomly assigned to the emodin colonic irrigation (ECI) and control colonic irrigation (CCI) groups 8 weeks after 5/6 of nephrectomy. Animals of ECI groups were given emodin via colonic irrigation using a lavage needle (8 cm) through the anus, at 5 mL(1 mg/day) for four weeks, and the water containing 0.4% CMC-Na was used to dissolve emodin for ECI treatments or to serve as CCI control group without emodin. Four weeks after the irrigation, fresh fecal, urine and serum samples were collected from the animal trails. All the samples were stored at -80oC until analyses. All animal experiments in this study were approved by the Institutional Animal Care and Use Committee of the Second Clinical College, Guangzhou University of Chinese Medicine(Guangzhou, China), and were performed in accordance with the Declaration of National Institutes of Health Guide for the Care and Use of Laboratory Animals (Publication No. 80-23, 1996).
Serum preparation and quantitative detection of uremic toxin indoxyl sulfate (IS)
The chemicals, including the standard IS potassium salt (purity 99.8%), were obtained from Sigma-Aldrich (St. Louis, MO, USA), and the internal standard of hydrochlorothiazide (purity 99.5%) was obtained from Institute for Drug Control (Guangzhou, China), while methanol (LC-MS grade) and ammonium acetate were purchased from Sigma-Aldrich.
Firstly, 100 μL of fixed serum was pipetted into 1.5 mL polypropylene tube, and 500 μL hydrochlorothiazide in methanol solution (25 μg/mL) was added to precipitate the protein. The tubes were mixed by vortex for 1 minute. After centrifugation at 12,000 rpm for 10 minutes, 100 μL clear supernatant was extracted and mixed with 100 μL ddH2O to filter into a new polypropylene tube, and transferred to an auto-sampler. The curve standards were prepared at 0.25, 0.5, l, 5, 10, 50 μg/mL in methanol for IS, dried out using vacuum spinner (Thermo, Waltham, MA, USA), re-dissolved with normal rats’ serum, and finally analyzed as described in the serum method. Low, medium and high concentrations of quality-control (QC) samples were also prepared. The IS-quantitative method was described in our previous studies [42].
Fecal bacterial DNA extraction
Each fecal bacterial DNA was extracted using the QIAamp DNA Stool Mini kit (QIAGEN, GmbH, Germany) according to the manufacturer’s protocols. The completed DNA samples were stored at -80oC before use.
Analysis of dominant fecal microbiota by Real-Time quantitative PCR
Quantification of gene expression was performed via the LightCycler System I (BioRad, Richmond, CA, USA) using iQTm SYBR Green SuperMix (BioRad). Reaction mixtures (20 μL) contained 10 μL of 2 × SYBR-Mix, 1 μL of template DNA, 1 μL of each primer, and 7 μL of ddH2O. The primers for 5’ nuclease assays were based on sequences of the 16S rRNA region of special species, as listed in Supplementary Table S3. Real-time PCR quantification of species-specific DNA was performed using a standard curve generated from the dilution series (from 1×10² to 1×10⁹ copies/μL) of a standard strain (Supplementary Table S4). Standard and quantified samples were run in triplicates. The temperature program for the qPCR included an initial denaturation step at 95 °C for 3min followed by 40 cycles of amplification at 95 °C for 10 s, annealing at 60 °C for 30 s, and elongation at 72 °C for 60 s. The melting curve was obtained by gradual heating with a 0.5 °C/s increment from 50 °C to 95 °C and continuous fluorescence measurements. The results were expressed as 16S rRNA gene copies per wet weight of feces.
Pyrosequencing
The V3-V5 regions in the 16S rRNA gene of Escherichia coli were amplified by PCR from extracted DNA using sample-unique DNA bar-coded primers (forward: 5’-CCGTCAA- TTCMTTTGAGTTT-3’, reverse: 5’-ACTCCTACGGGAGGCAGCAG-3’) [43]. The PCR reaction program was as follows: 3 min initial denaturation at 94°C, 20 cycles of denaturation at 94°C for 1min, annealing from 65°C to 55°C (1°C reduction for every two cycles) for 1 min, elongation at 72°C for 1 min, and the final extension at 72°C for 6 min [44]. Then, the resulting products were verified via gel electrophoresis. DNA pyrosequencing was carried out on 454 GS FLX+ platform (Roche, Branford, CT, USA).
Bioinformatics and statistical analyses of sequencing data
Raw data generated from the 454-pyrosequencing running were processed following the pipelines of Mothur (version 1.29) [45] and QIIME according to Kuang’s method [46]. Briefly, the low quality sequences were trimmed with an average quality score less than 20 using a 50 bp sliding window, and chimeric sequences were identified and removed using UCHIME with de novo method [47]. Quality sequences were subsequently assigned to samples according to their unique 10-bp barcode and binned into phylotypes using average clustering algorithm at the 97% similarity level. Representative sequences were aligned using NAST [48] and taxonomic classification of phylotypes was obtained using the Ribosomal Database Project (RDP) classifier (at least 80% threshold) [49]. In addition, the phylogenetic tree of representative sequences of operational taxonomic units (OTUs) was built using FastTree [50] with default parameters. Finally OTU table was tabulated by combining the information of relative abundance in each sample and taxonomic classification for each OTU.
The α- and β- diversities were performed using QIIME [51]. The established phylogenetic tree and the relative abundance table of representative sequences of OTUs were used for Weighted UniFrac analysis and UniFrac principal coordinate analysis (PCoA) [52]. We obtained the abundance differences in microbial communities from three groups, and FDR (false discovery rate) was adopted to assess the significance of differences using one-way ANOVA (p < 0.05). We identified the urea and IS as environmental variables using Redundancy analysis with CANOCO, and the statistical significance was assessed by MCPP. The Spearman’s correlation coefficient (R) and P value were used to evaluate the relationship between the urea, IS and pyrosequencing. All statistical analyses were performed using various packages with the R statistical computing environment.
Statistical analyses
Values were expressed as means ± standard deviations. One-way ANOVA and Student-Newman-Kueuls Q tests were used for comparison analyses of continuous variables using GraphPad Prism 5.0 (GraphPad Software, La Jolla, CA). A probability level of < 0.05 was considered statistically significant.
Acknowledgments
This study was supported by National Natural Science Foundation of China (81202819 to CZ and 81471550 to ZD).
Conflicts of interest
No conflicts of interest exist.
References
1. Meyer TW and Hostetter TH. Approaches to uremia. J Am Soc Nephrol. 2014; 25:2151-2158.
2. Meyer TW and Hostetter TH. Uremia. N Engl J Med. 2007; 357:1316-1325.
3. Haddy FJ, Meyer TW and Hostetter TH. Uremia. N Engl J Med. 2008; 358:95, 95.
4. Evenepoel P, Meijers BK, Bammens BR and Verbeke K. Uremic toxins originating from colonic microbial metabolism. Kidney Int Suppl. 2009;:S12-S19.
5. Meijers BK and Evenepoel P. The gut-kidney axis: indoxyl sulfate, p-cresyl sulfate and CKD progression. Nephrol Dial Transplant. 2011; 26:759-761.
6. Barreto FC, Barreto DV, Liabeuf S, Meert N, Glorieux G, Temmar M, Choukroun G, Vanholder R and Massy ZA. Serum indoxyl sulfate is associated with vascular disease and mortality in chronic kidney disease patients. Clin J Am Soc Nephrol. 2009; 4:1551-1558.
7. Vaziri ND, Wong J, Pahl M, Piceno YM, Yuan J, DeSantis TZ, Ni Z, Nguyen TH and Andersen GL. Chronic kidney disease alters intestinal microbial flora. Kidney Int. 2013; 83:308-315.
8. Ramezani A and Raj DS. The gut microbiome, kidney disease, and targeted interventions. J Am Soc Nephrol. 2014; 25:657-670.
9. Niwa T. Role of indoxyl sulfate in the progression of chronic kidney disease and cardiovascular disease: experimental and clinical effects of oral sorbent AST-120. Ther Apher Dial. 2011; 15:120-124.
10. Vitetta L and Gobe G. Uremia and chronic kidney disease: the role of the gut microflora and therapies with pro- and prebiotics. Mol Nutr Food Res. 2013; 57:824-832.
11. Lee H and Tsai SJ. Effect of emodin on cooked-food mutagen activation. Food Chem Toxicol. 1991; 29:765-770.
12. Sato M, Maulik G, Bagchi D and Das DK. Myocardial protection by protykin, a novel extract of trans-resveratrol and emodin. Free Radic Res. 2000; 32:135-144.
13. Peigen X, Liyi H and Liwei W. Ethnopharmacologic study of Chinese rhubarb. J Ethnopharmacol. 1984; 10:275-293.
14. Shi YQ, Fukai T, Sakagami H, Kuroda J, Miyaoka R, Tamura M, Yoshida N and Nomura T. Cytotoxic and DNA damage-inducing activities of low molecular weight phenols from rhubarb. Anticancer Res. 2001; 21(4A):2847-2853.
15. Kuo YC, Meng HC and Tsai WJ. Regulation of cell proliferation, inflammatory cytokine production and calcium mobilization in primary human T lymphocytes by emodin from Polygonum hypoleucum Ohwi. Inflamm Res. 2001; 50:73-82.
16. Feng TS, Yuan ZY, Yang RQ, Zhao S, Lei F, Xiao XY, Xing DM, Wang WH, Ding Y and Du LJ. Purgative components in rhubarbs: adrenergic receptor inhibitors linked with glucose carriers. Fitoterapia. 2013; 91:236-246.
17. Demirezer LO, Kuruuzum-Uz A, Bergere I, Schiewe HJ and Zeeck A. The structures of antioxidant and cytotoxic agents from natural source: anthraquinones and tannins from roots of Rumex patientia. Phytochemistry. 2001; 58:1213-1217.
18. Srinivas G, Babykutty S, Sathiadevan PP and Srinivas P. Molecular mechanism of emodin action: transition from laxative ingredient to an antitumor agent. Med Res Rev. 2007; 27:591-608.
19. Zhong Y, Deng Y, Chen Y, Chuang PY and Cijiang HJ. Therapeutic use of traditional Chinese herbal medications for chronic kidney diseases. Kidney Int. 2013; 84:1108-1118.
20. Wang H, Song H, Yue J, Li J, Hou YB and Deng JL. Rheum officinale (a traditional Chinese medicine) for chronic kidney disease. Cochrane Database Syst Rev. 2012; 7:D8000.
21. Shu ZJ, Cao Y and Halmurat U. Gut flora may offer new therapeutic targets for the traditional Chinese medicine enteric dialysis. Expert Opin Ther Targets. 2011; 15:1147-1152.
22. Zou C, Lu ZY, Wu YC, Yang LH, Su GB, Jie XN and Liu XS. Colon may provide new therapeutic targets for treatment of chronic kidney disease with Chinese medicine. Chin J Integr Med. 2013; 19:86-91.
23. Islam KB, Fukiya S, Hagio M, Fujii N, Ishizuka S, Ooka T, Ogura Y, Hayashi T and Yokota A. Bile acid is a host factor that regulates the composition of the cecal microbiota in rats. Gastroenterology. 2011; 141:1773-1781.
24. Kataoka K, Kibe R, Kuwahara T, Hagiwara M, Arimochi H, Iwasaki T, Benno Y and Ohnishi Y. Modifying effects of fermented brown rice on fecal microbiota in rats. Anaerobe. 2007; 13(5-6):220-227.
25. Meyer TW and Hostetter TH. Uremic solutes from colon microbes. Kidney Int. 2012; 81:949-954.
26. Barreto FC, Barreto DV, Liabeuf S, Meert N, Glorieux G, Temmar M, Choukroun G, Vanholder R and Massy ZA. Serum indoxyl sulfate is associated with vascular disease and mortality in chronic kidney disease patients. Clin J Am Soc Nephrol. 2009; 4:1551-1558.
27. Lee YT. Urea concentration in intestinal fluids in normal and uremic dogs. J Surg Oncol. 1971; 3:163-168.
28. Miranda AP, Urbina AR, Gomez EC and Espinosa CML. Effect of probiotics on human blood urea levels in patients with chronic renal failure. Nutr Hosp. 2014; 29:582-590.
29. Vaziri ND, Yuan J and Norris K. Role of urea in intestinal barrier dysfunction and disruption of epithelial tight junction in chronic kidney disease. Am J Nephrol. 2013; 37:1-6.
30. O’Hara AM and Shanahan F. The gut flora as a forgotten organ. Embo Rep. 2006; 7:688-693.
31. Tancrede C. Role of human microflora in health and disease. Eur J Clin Microbiol Infect Dis. 1992; 11:1012-1015.
32. Lozupone CA, Stombaugh JI, Gordon JI, Jansson JK and Knight R. Diversity, stability and resilience of the human gut microbiota. Nature. 2012; 489:220-230.
33. Faith JJ, Guruge JL, Charbonneau M, Subramanian S, Seedorf H, Goodman AL, Clemente JC, Knight R, Heath AC, Leibel RL, Rosenbaum M and Gordon JI. The long-term stability of the human gut microbiota. Science. 2013; 341:1237439.
34. David LA, Maurice CF, Carmody RN, Gootenberg DB, Button JE, Wolfe BE, Ling AV, Devlin AS, Varma Y, Fischbach MA, Biddinger SB, Dutton RJ and Turnbaugh PJ. Diet rapidly and reproducibly alters the human gut microbiome. Nature. 2014; 505:559-563
35. Mishima E, Fukuda S, Shima H, Hirayama A, Akiyama Y, Takeuchi Y, Fukuda NN, Suzuki T, Suzuki C, Yuri A, Kikuchi K, Tomioka Y, Ito S, Soga T and Abe T. Alteration of the Intestinal Environment by Lubiprostone Is Associated with Amelioration of Adenine-Induced CKD. J Am Soc Nephrol. 2015; 26:1787-1794.
36. Hida M, Aiba Y, Sawamura S, Suzuki N, Satoh T and Koga Y. Inhibition of the accumulation of uremic toxins in the blood and their precursors in the feces after oral administration of Lebenin, a lactic acid bacteria preparation, to uremic patients undergoing hemodialysis. Nephron. 1996; 74:349-355.
37. Vaziri ND, Liu SM, Lau WL, Khazaeli M, Nazertehrani S, Farzaneh SH, Kieffer DA, Adams SH and Martin RJ. High amylose resistant starch diet ameliorates oxidative stress, inflammation, and progression of chronic kidney disease. PLoS One. 2014; 9:e114881.
38. Wong J, Piceno YM, DeSantis TZ, Pahl M, Andersen GL and Vaziri ND. Expansion of Urease-and Uricase-Containing, Indole-and p-Cresol-Forming and Contraction of Short-Chain Fatty Acid-Producing Intestinal Microbiota in ESRD. Am J Nephrol. 2014; 39:230-237.
39. Thongprayoon C, Cheungpasitporn W, Phatharacharukul P, Mahaparn P and Bruminhent J. High Mortality Risk in Chronic Kidney Disease and End Stage Kidney Disease Patients with Clostridium Difficile Infection: A Systematic Review and Meta-analysis. J Nat Sci. 2015; 1(4).
40. Mullane KM, Cornely OA, Crook DW, Golan Y, Louie TJ, Miller MA, Josephson MA and Gorbach SL. Renal impairment and clinical outcomes of Clostridium difficile infection in two randomized trials. Am J Nephrol. 2013; 38:1-11.
41. Smith PM, Howitt MR, Panikov N, Michaud M, Gallini CA, Bohlooly-Y M, Glickman JN and Garrett WS. The microbial metabolites, short-chain fatty acids, regulate colonic Treg cell homeostasis. Science. 2013; 341:569-573.
42. Lu Z, Zeng Y, Lu F, Liu X and Zou C. Rhubarb Enema Attenuates Renal Tubulointerstitial Fibrosis in 5/6 Nephrectomized Rats by Alleviating Indoxyl Sulfate Overload. PLoS One. 2015; 10:e144726.
43. Sundquist A, Bigdeli S, Jalili R, Druzin ML, Waller S, Pullen KM, El-Sayed YY, Taslimi MM, Batzoglou S and Ronaghi M. Bacterial flora-typing with targeted, chip-based Pyrosequencing. BMC Microbiol. 2007; 7:108.
44. Zhang C, Li S, Yang L, Huang P, Li W, Wang S, Zhao G, Zhang M, Pang X, Yan Z, Liu Y and Zhao L. Structural modulation of gut microbiota in life-long calorie-restricted mice. Nat Commun. 2013; 4:2163.
45. Schloss PD, Westcott SL, Ryabin T, Hall JR, Hartmann M, Hollister EB, Lesniewski RA, Oakley BB, Parks DH, Robinson CJ, Sahl JW, Stres B, Thallinger GG, Van Horn DJ and Weber CF. Introducing mothur: open-source, platform-independent, community-supported software for describing and comparing microbial communities. Appl Environ Microbiol. 2009; 75:7537-7541.
46. Kuang JL, Huang LN, Chen LX, Hua ZS, Li SJ, Hu M, Li JT and Shu WS. Contemporary environmental variation determines microbial diversity patterns in acid mine drainage. ISME J. 2013; 7:1038-1050.
47. Edgar RC, Haas BJ, Clemente JC, Quince C and Knight R. UCHIME improves sensitivity and speed of chimera detection. Bioinformatics. 2011; 27:2194-2200.
48. DeSantis TJ, Hugenholtz P, Keller K, Brodie EL, Larsen N, Piceno YM, Phan R and Andersen GL. NAST: a multiple sequence alignment server for comparative analysis of 16S rRNA genes. Nucleic Acids Res. 2006; 34(Web Server issue):W394-W399.
49. Wang Q, Garrity GM, Tiedje JM and Cole JR. Naive Bayesian classifier for rapid assignment of rRNA sequences into the new bacterial taxonomy. Appl Environ Microbiol. 2007; 73:5261-5267.
50. Price MN, Dehal PS and Arkin AP. FastTree: computing large minimum evolution trees with profiles instead of a distance matrix. Mol Biol Evol. 2009; 26:1641-1650.
51. Caporaso JG, Kuczynski J, Stombaugh J, Bittinger K, Bushman FD, Costello EK, Fierer N, Pena AG, Goodrich JK, Gordon JI, Huttley GA, Kelley ST, Knights D, Koenig JE, Ley RE and Lozupone CA, et al. QIIME allows analysis of high-throughput community sequencing data. Nat Methods. 2010; 7:335-336.
52. Lozupone C, Hamady M and Knight R. UniFrac—an online tool for comparing microbial community diversity in a phylogenetic context. BMC Bioinformatics. 2006; 7:371.