
INTRODUCTION
Mesenchymal stem cells (MSCs) are heterogeneous type of cells dispatched from bone marrow to different organs to maintain tissue homeostasis [1]. MSCs can be actively recruited into tumors in a migration mode driven by a specific repertoire of soluble factors [2, 3]. Prominent among these factors is the stromal differentiation factor (SDF1, aka CXCL12) [4, 5]. Once inside the tumor, MSCs through bi-directional interactions enhance tumor cells invasion and metastatic capabilities [6].
In highly proliferative solid tumors, due to increased proximity to vessels and neo-angiogenesis, e.g., in tumor cores, hypoxia ensues [7]. Hypoxia promotes both resistance to conventional cancer therapies and tumor progression by creating microenvironment enriched in poorly differentiated tumor cells and undifferentiated stromal cells, including MSCs [7], in part, through stabilization of the transcription activator, “hypoxia-inducible factor-1 alpha (HIF-1α)” in tumor and stromal cells [8].
Within tumor cores many cells also die by necrosis and passively release intracellular alarmins (aka, damage-associated molecular patterns or DAMPs). Prominent among these DAMPs is the high mobility group B1 “HMGB1”. HMGB1 is a nuclear protein with high affinity to DNA but no sequence preference involved in replication, transcription and recombination among other functions [9]. HMGB1 functions also extend beyond the nucleus. Released from certain cells, including cancer cells, HMGB1 plays important roles in inflammation and tumor metastasis [10, 11]. Post-translational modifications determine HMGB1 functions and release mechanisms [12]. Indeed, mono-methylated on lysine 43 (K43) HMGB1 is released from neutrophils. Cysteine redox isoforms of HMGB1 act as both a chemotactic and a cytokine-inducing mediator [12]. Acetylation seems to be the major modification affecting HMGB1 localization. Hyper-acetylation within the nuclear localization sequence 2 (NLS2) by CBP promotes HMGB1 dissociation from chromatin, decreases the level within the nucleus and increases secretion [13–15]. Conversely, de-acetylation by SIRT1 at K55, K88, K90, and K177 within the pro-inflammatory and NLS2 domains prevents HMGB1 cytoplasmic localization [15, 16]. Interestingly, genetic ablation or pharmacological inhibition of SIRT1 in endothelial cells reduced HMGB1 nuclear localization, enhanced cytoplasmic translocation and promoted secretion [16]. Conversely, resveratrol an activator of SIRT1 decreased HMGB1 acetylation thereby increasing nuclear retention [13]. Moreover, inflammation, a known suppressor of SIRT1 in vivo, activates HMGB1 acetylation, cytoplasmic translocation, and systemic release thereby maintains inflammation [15]. Extracellular HMGB1 signals through binding to receptor for advanced glycation end products (RAGE) or toll-like receptors (TLR) expressed on the surface of many cells including monocytes/macrophages, T-lymphocytes, neurons, endothelial cells, osteoclasts/osteoblasts, mesenchymal stem cells and a variety of tumor cells [17–19]. Activated RAGE signals by activating NF-κB-mediating inflammatory gene expression [20–21], adding support to the connection between chronic inflammation and cancer progression [22]. Indeed, pharmacological inactivation of RAGE shows great clinical efficacy in pre-clinical tumor mouse models [23].
Geminin overexpressing breast cancer cells overexpress a nuclear only form of c-Abl [24], a phenotype we now refer to as “GemOE”. c-Abl phosphorylation of geminin tyrosine (Y) 150 stabilizes the protein [24] and activates geminin oncogenic function, in vitro and in vivo [24-26]. Inhibiting Y150 phosphorylation destabilizes geminin protein leading to death of GemOE cells specifically, with no effect on low geminin and cytoplasmic c-Abl-expressing normal human mammary epithelial (HME) cells [25]. In vivo, GemOE tumors are extremely sensitive to c-Abl inhibitors; e.g., imatinib and nilotinib [24]. Moreover, because GemOE is detected in more than half of triple negative breast cancers (TNBCs), we recently proposed the use of imatinib or nilotinib to treated TNBC patients re-stratified according to the GemOE criterion [24].
In the current study, we show geminin-dependent acetylation and extracellular secretion of chromatin-bound HMGB1 from necrotic/hypoxic GemOE in tumor cores. Secreted Ac-HMGB1 in autocrine/paracrine fashion promotes survival of GemOE/TNBC tumor cells. Extracellular Ac-HMGB1 also stimulates expression and activation of RAGE on the surface of the non-expressing MSCs. In MSCs, activated RAGE triggers CXCR4 expression leading to directed migration of MSCs towards SDF1-secreting GemOE/TNBC cells in tumor cores. In tumor cores, reciprocal interactions between MSCs and GemOE/TNBC cells stimulate aggressiveness in GemOE/TNBC tumor cells. Accordingly, inhibiting geminin Y150 phosphorylation (i.e. using imatinib), HMGB1 secretion or binding to RAGE or CXCR4 activity inhibited survival of GemOE tumor cells, recruitment of MSCs in vitro and in vivo into GemOE/TNBC tumors’ core and significantly reduced the aggressive traits of GemOE/TNBC cells.
RESULTS
Geminin, HMGB1 complex formation
In a yeast 2-hybrid screen with full-length geminin as bait, we recently identified HMGB1 as a binding partner. Total proteins from naïve mammary epithelial (HME) cells, inducible Gem9 (iGem9, a HME cell line expressing a doxycycline [Dox]-inducible geminin allele) for at least 72 h and three TNBC cell lines, MDA-MB-231, MDA-MB-468 and BT549 (endogenously overexpressing geminin), were isolated by sonication. Geminin level is low in naïve HME but high in iGem9 cells to a level that resembles that of the TNBC cell lines (Figure 1A). In contrast, HMGB1 level was similar in all cell lines, including naïve HME cells (Figure 1A). Quantitatively, compared to naïve HME cells, iGem9 and TNBC cell lines express 5–6 fold higher geminin but similar levels of HMGB1 (Supplementary Figure 1A). In accordance, total cell extract c-Abl level is higher in iGem9 and TNBC cell lines compared to naïve HME cells (Figure 1A and Supplementary Figure 1A), while CBP is expressed at similar level (Figure 1A and Supplementary Table 1A).
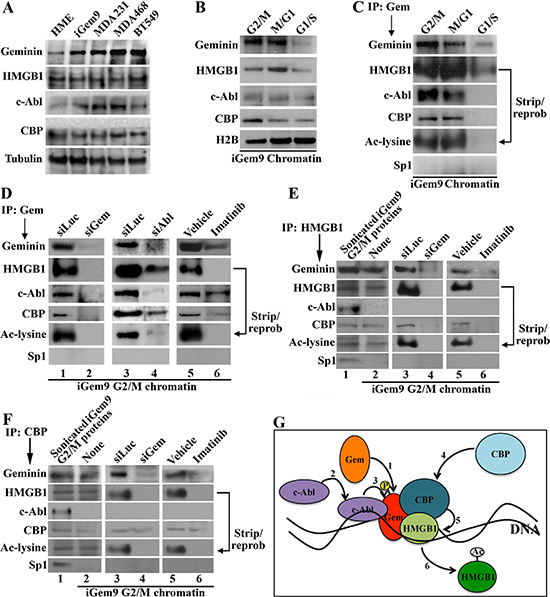
Figure 1: Geminin promotes acetylation of chromatin-bound HMGB1. (A) The levels of indicated proteins in naïve HME, iGem9 cells (defined as Dox-induced for 72 h) and the TNBC cell lines MDA-MB-231, MDA-MB-468 and BT549 sonicated extracts. (B) The levels of indicated proteins on the chromatin of iGem9 cells synchronized in G2/M, M/G1 and G1/S phases. (C) IP experiments using geminin specific antibody on chromatin isolated from G2/M, M/G1 and G1/S phase iGem9 cells and blotted for the indicated proteins. (D) IP experiments using geminin specific antibody on G2/M phase iGem9 chromatin extracts of cells transfected with siLuc, siGem or siAbl for 72 h or treated with vehicle or 10 μM imatinib for 24 h. IP experiments using HMGB1 specific antibody (E) or CBP specific antibody (F) on iGem9 cells synchronized in G2/M-phase sonicated extracts (first lanes), or chromatin extracts following 72 h of transfection with siLuc or siGem or 24 h treatment with vehicle or 10 μM imatinib. (G) Schematic representation of the data presented through out this figure. In all parts of the figure experiments were done between 2–3 separate times.
Geminin resides in different nuclear compartments in cell cycle-dependent manner. In late G1 and S phases, geminin is a nuclear soluble protein, whereas in G2/M/early G1 phases it becomes chromatin bound protein [27]. To determine the level on the chromatin in different phases of the cell cycle, G2/M, M/G1 or G1/S phase chromatin was isolated from iGem9 cells. Geminin, HMGB1 and c-Abl levels were highest on G2/M and M/G1 phase chromatin, and significantly dropped in G1/S cells chromatin (Figure 1B and Supplementary Table 1B). CBP level was highest in G2/M-phase cells chromatin, dropped slightly in M/G1-phase cells chromatin and dropped further in G1/S-phase cells chromatin (Figure 1B, Supplementary Figure 1B). Together suggests that the 4 proteins are present on the chromatin during G2/M and M/G1 phase cells, but not on G1/S phase cells' chromatin.
To confirm the putative interaction identified in the 2-hybrid screen, G2/M-, M/G1- and G1/S-phases iGem9 cells chromatin extracts were immunoprecipitated (IPd) using a monoclonal anti-geminin antibody. Western blot analysis of these IPs showed that geminin antibody pulled-down c-Abl, CBP and HMGB1, which was acetylated as detected by stripping and re-probing using anti-Ac-lysine antibody from G2/M (1st lane Figure 1C) and M/G1 (2nd lane Figure 1C) cells chromatin. In contrast, in G1/S phase low-level HMGB1 only was pulled-down with geminin antibody that was not acetylated (3rd lane Figure 1C). Together suggests that a complex between geminin and HMGB1 together with c-Abl and CBP presences on the chromatin of G2/M and M/G1 GemOE cells is perhaps involved in acetylation of HMGB1.
Phosphorylation of HMGB1-bound geminin on the chromatin in G2 phase
Previous studies clearly showed that cell-cycle dependent modifications play important roles in the localization and function of HMGB1 [13–16] and geminin [24–27]. Since the data presented above suggests a complex formation predominantly in G2/M-phase, iGem9 cells were first transfected with luciferase siRNA (siLuc, negative control), sigeminin (siGem) or siAbl for 72 h. Another set of cells was instead treated with vehicle or 10 μM imatinib for 24 h. Chromatin extracts isolated from all these cells synchronized in G2/M phase were IPd using anti-geminin, -HMGB1 or -CBP antibodies. First, in control treated cells, anti-geminin IPd c-Abl, CBP and HMGB1 that was acetylated (1st, 3rd and 5th lanes in Figure 1D). In support of our previous results [24, 25], geminin silencing (2nd lane in Figure 1D), c-Abl silencing (4th lane in Figure 1D) or inactivation (6th lane in Figure 1D) significantly reduced geminin on the chromatin (2nd, 4th and 6th lanes in Figure 1D), which according to the above data led to significant decrease in the level of HMGB1 (and Ac-HMGB1) and CBP co-IPd (2nd, 4th and 6th lanes in Figure 1D). Furthermore, although all proteins were present in G2/M phase cells chromatin (1st lanes in Figure 1E and 1F), HMGB1 or CBP antibodies co-IPd all components of the complex except c-Abl (2nd, 3rd and 5th lanes in Figure 1E and 1F). Geminin silencing or c-Abl inactivation (hence geminin depletion) disassembled the complex as detected by lack of pull-down of all proteins in the anti-HMGB1 IPs (4th and 6th lanes in Figure 1E) or anti-CBP IPs (4th and 6th lanes in Figure 1F). Taken together suggests that geminin translocates to the chromatin (see also [27]) perhaps at HMGB1 sites in late S/early G2 phase (step 1 in Figure 1G). Since yeast cells do not modify proteins the same way human cells do, our yeast 2-hybrid screen data suggests that this interaction perhaps initially occurs between HMGB1 and a non-phosphorylated geminin. c-Abl is then recruited to this complex to phosphorylate geminin (step 2 and 3 in Figure 1G), which perhaps leads to recruitment of CBP (step 4 in Figure 1G) to the complex to acetylate HMGB1 (step 5 in Figure 1G). CBP binding seems transient, leaving after HMGB1 acetylation, perhaps due to change in geminin phosphorylation status from Y-phosphorylated to serine/threonine-phosphorylated occurring in late M/early G1−phase and/or geminin release from chromatin also during this phase [27]. Acetylated HMGB1 (Ac-HMGB1) is most likely released from the chromatin (step 6 in Figure 1G) [13, 14]. Lack of geminin seems to prevent complex formation, HMGB1 acetylation and release.
Rapid secretion of cytoplasmic Ac-HMGB1 in GemOE cells
To determine the localization of Ac-HMGB1 in GemOE cells, uninduced-Gem9 or iGem9 cells were stained with anti-HMGB1 and -NF-κB/p65 (a target of cytoplasmic HMGB1) [28, 29] antibodies. In uninduced Gem9 cells (Figure 2A1–4), HMGB1 was predominantly nuclear (arrows in Figure 2A2) and NF-κB/p65 was cytoplasmic (i.e. inactive, arrows in Figure 2A3). In contrast, in iGem9 (arrows in Figure 2A5–8) increased cytoplasmic HMGB1 (arrows in Figure 2A6) and nuclear/active NF-κB/p65 (arrows in Figure 2A7) was detected. c-Abl silencing (arrows in Figure 2A9–12) or inactivation (arrows in Figure 2A13–16) in iGem9 cells led to HMGB1 re-localization to the nucleus (arrows in Figure 2A10 and 2A14) and NF-κB/p65 to the cytoplasm (arrows in Figure 2A11 and 2A15).
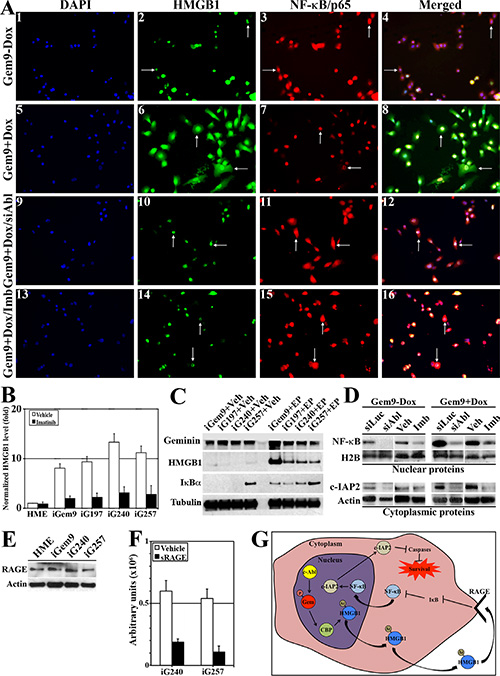
Figure 2: Geminin overexpression enhances HMGB1 acetylation, release from chromatin, cytoplasmic translocation and secretion. (A) Immunofluorescence analysis of HMGB1 and NF-κB/p65 in uninduced Gem9 (1–4) or iGem9 cells before (5–8) or after c-Abl silencing for 72 h (9–12) or inactivation using 10 μM imatinib for 24 h (13–16). (B) The levels of HMGB1 in CM of naïve HME, iGem9, iG197, iG240 and iG257 cells in the presence of vehicle (white bars) or 10 μM imatinib (black bars) for 24 h detected using specific HMGB1 ELISA assay. Experiments were done in triplicates 3 different times, **represents p < 0.001. (C) The levels of HMGB1 and the endogenous inhibitor of NF-κB; IκBα in the cytoplasm of iGem9, iG197, iG240 and iG257 cells in the absence (Veh, left) or the presence (200 μM EP, right) of the inhibitor of HMGB1 release; ethyl pyruvate. (D) The levels of active NF-κB/p65 and the survival factor c-IAP2 in the cytoplasmic or chromatin fraction of uninduced Gem9 cells or iGem9 cells transfected with siLuc or siAbl for 72 h or treated with vehicle or 10 μM imatinib for 24 h. (E) RAGE levels in naïve HME, iGem9, iG240 or iG257 cells. (F) Activation of NF-κB response element in iG240 or iG257 cells following vehicle or 10 μg/ml sRAGE for 24 h. Experiments were done in triplicates 3 different times, **represents p < 0.001. (G) Schematic representation of the data presented throughout this figure. In all parts of the figure experiments were done between 2–3 separate times.
In addition to Gem9, we previously generated several inducible geminin expressing cell lines. Five of these cell lines (including Gem9) were injected (5 × 10⁶ cells/mouse) orthotopically in SCID mice mammary fat pads (n = 5/cell line) and mice were maintained on Dox-water. Tumors (i.e. GemOE-driven mammary tumors) developed were isolated and used to generate cell lines. In the following experiments, three cell lines now named: G197, G240 and G257 that were generated by a different parental cell line and still maintained on Dox in vitro and in vivo will be used in addition to the parental Gem9 to perform the following analysis.
Naïve HME, Gem9, G197, G240 and G257 cells induced for 72 h were grown in the presence of vehicle or 10 μM imatinib for an additional 24 h. Using a specific HMGB1 ELISA, we compared the level of HMGB1 secreted from these cells. Compared to naïve HME cells conditioned medium (CM), iGem9, iG197, iG240 and iG257 cells CM contained 8–14 fold higher HMGB1 (white bars in Figure 2B), reinforcing the notion that geminin overexpression triggers HMGB1 acetylation and secretion. Imatinib treatment had insignificant effect on the amount of HMGB1 secreted from naïve HME cells, but significantly reduced the amount of HMGB1 secreted from iGem9, iG197, iG240, iG257 cell lines (black bars in Figure 2B). To confirm that further, iGem9, iGem197, iG240 and iG257 cells were treated with ethyl pyruvate (EP), an aliphatic ester derived from pyruvic acid, that inhibits HMGB1 secretion [30]. While in vehicle (Veh) treated iGem9, iG197, iG240, iG257 cells, there was virtually no cytoplasmic HMGB1 (2nd panel in Figure 2C, left), treatment with 200 μM EP for 24 h led to significant accumulation of HMGB1 in the cytoplasm of all cell lines (2nd panel in Figure 2C, right). Taken together confirms that in GemOE cells, HMGB1 is predominantly acetylated and translocated to the cytoplasm in a transient manner before it is secreted.
HMGB1 secreted from GemOE cells activates NF-κB signaling in GemOE cells
It is well known that HMGB1 signal through NF- κB [22]. IκBα binds and sequesters NF-κB in an inactive cytoplasmic form in many cell types [29]. Cell activation leads to IκBα phosphorylation and degradation leading to release of NF-κB and translocation into the nucleus to activate expression of several survival genes [28, 29]. Compared to Veh-treated cells that showed almost complete absence of cytoplasmic IκBα (3rd panel in Figure 2C, left), EP-treated cells retained high levels of cytoplasmic IκBα (3rd panel in Figure 2C, right). This suggests that in auto/paracrine fashion secreted HMGB1 activates NF-κB in GemOE cells.
To confirm that nuclear and cytoplasmic proteins from uninduced-Gem9 or iGem9 cells (for 72 h) in which c-Abl was either silenced (for 72 h) or inactivated (using 10 μM imatinib, for 24 h) were isolated. Compared to uninduced-Gem9 cells that showed low level of nuclear NF-κB/p65 and low level of cytoplasmic c-IAP2 (a transcription target of activated NF-κB), iGem9 cells showed high levels of nuclear NF-κB/p65 and cytoplasmic c-IAP2 (compare 5th and 7th to 1st and 3rd lanes in Figure 2D). c-Abl silencing or inactivation significantly reduced the levels of nuclear NF-κB/p65 and cytoplasmic c-IAP2 in uninduced-Gem9 (compare 2nd to 1st lane and 4th to 3rd lane, respectively in Figure 2D) as well as iGem9 cells (compare 6th to 5th lane and 8th to 7th lane, respectively in Figure 2D).
Secreted Ac-HMGB1 can signal through binding to RAGE or TLR to activate NF-κB signaling in many cell types [21, 31]. To study which of these receptors is involved in enhancement of GemOE cell survival induced by secreted Ac-HMGB1, membrane proteins from naïve HME, iGem9, iG240 and iG257 were isolated. All cell lines showed almost equal levels of RAGE (Figure 2E), but complete absence of TLR4 expression on their surface (data not shown), suggesting that increase NF-κB/p65 activity following Ac-HMGB1 secretion is RAGE- and not TLR4-dependent (although other TLR could be involved). Additionally the data support the view that NF-κB activation in GemOE compared to naïve HME cells is driven by increase Ac-HMGB1 secretion and not increase RAGE expression on the surface of these cells.
To confirm this further, the highest Ac-HMGB1-secreting cell lines, iG240 and iG257 (Figure 2B) were transfected with a NF-κB-Luc reporter plasmid for 48 h. Cell were then grown in the presence or absence of 10 μg/ml of the HMGB1-RAGE uncoupling protein; soluble RAGE (sRAGE) for an additional 24 h. Compared to vehicle-treated cells, sRAGE-treated cells showed 4–5fold reduction in NF-κB reporter activity (compare black to white bars in Figure 2F). Taken together, the data clearly show that Ac-HMGB1 released from the chromatin that accumulates in the cytoplasm of GemOE cells (Figure 2A) is rapidly released (Figure 2B and 2C) to promote survival of GemOE tumor cells by activating NF-κB (Figure 2D) in an autocrine/paracrine fashion through binding to RAGE expressed on the surface of these cells (The kinetics of this is shown in Figure 2G).
Cytoplasmic HMGB1 localization in GemOE tumor cells in vivo
To obtain in vivo confirmation of this hypothesis, a cohort of human samples consists of 66 normal/near cancer tissues and 326 breast tumors of different subtypes were analyzed using immunohistochemistry (IHC) for geminin, c-Abl and HMGB1 expression. As shown earlier [24] compared to normal/near cancer tissues, > 50% of breast tumors overexpressed geminin (geminin-positive n = 170 vs. geminin-negative n = 156). Also in accordance with our previous data [24], in geminin-negative tumors (Figure 3A), c-Abl was overexpressed as an exclusively cytoplasmic protein (Figure 3B), whereas in geminin-positive tumors (Figure 3D), c-Abl was exclusively nuclear (Figure 3E). Furthermore, although we could not detect a significant difference in the level of HMGB1 between normal and tumor tissues, it was absolutely clear that geminin-negative/cytoplasmic c-Abl-overexpressing tumors express nuclear HMGB1 (Figure 3C), whereas in total agreement with the above data, almost all geminin-positive/nuclear c-Abl-overexpressing tumors express cytoplasmic HMGB1 (Figure 3F).
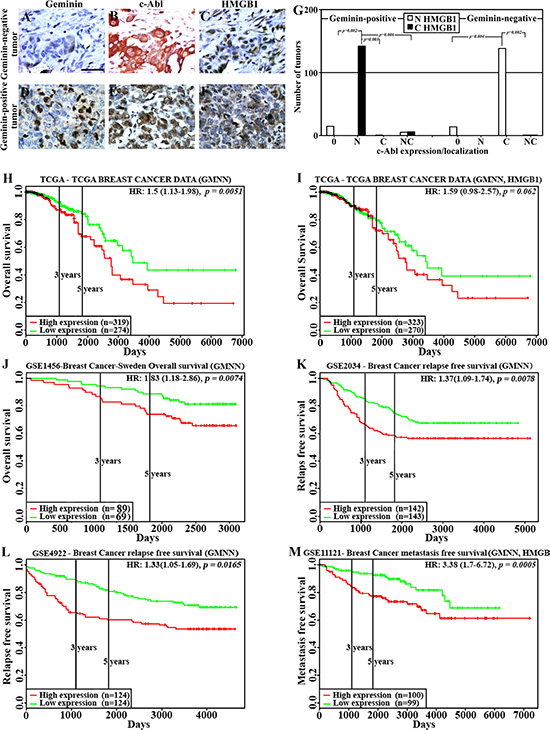
Figure 3: HMGB1 localization and effect on clinical outcome in GemOE tumors. The expression of geminin (A and D), c-Abl (B and E) and HMGB1 (C and F) in geminin-negative (A–C) or geminin-positive (D–F) breast cancer TMAs. (G) Number of tumors with nuclear (white bars) or cytoplasmic (black bars) HMGB1 expression in geminin-positive (left) or geminin-negative (right) tumors subdivided according to c-Abl expression as un (0)-, nuclear (N)-, cytoplasmic (C)- or nucleo-cytoplasmic (NC)- expressing tumors. (H) The rate of overall survival in 593 patients from the TCGA dataset with breast tumors expressing high (red line, n = 319) vs. low (green line, n = 274) geminin with hazard ratio of 1.5 (1.13–1.98) and p = 0.0051. (I) The rate of overall survival in 593 patients from the TCGA dataset with breast tumors expressing high (red line, n = 323) vs. low (green line, n = 270) geminin + HMGB1 with hazard ratio of 1.59 (0.98–2.57) and p = 0.062. (J) The rate of overall survival in 158 patients from the GSE1456 dataset with breast tumors expressing high (red line, n = 89) vs. low (green line, n = 69) geminin with hazard ratio of 1.83 (1.18–2.86) and p = 0.0074. (K) The rate of relapse-free survival in 285 patients from the GSE2034 dataset with breast tumors expressing high (red line, n = 142) vs. low (green line, n = 143) geminin with hazard ratio of 1.37 (1.09–1.74) and p = 0.0078. (L) The rate of relapse-free survival in 248 patients from the GSE4922 dataset with breast tumors expressing high (red line, n = 124) vs. low (green line, n = 124) geminin with hazard ratio of 1.33 (1.05–1.69) and p = 0.0165. (M) The rate of metastatic-free survival in 199 patients from the GSE11121 dataset with breast tumors expressing high (red line, n = 100) vs. low (green line, n = 99) geminin with hazard ratio of 3.38 (1.7–6.72) and p = 0.0005.
To quantitate these data, geminin-positive and -negative tumors were first divided into not (0), nuclear (N), cytoplasmic (C) or nucleo-cytoplasmic (NC) c-Abl-expressing tumors, and HMGB1 expression as nuclear or cytoplasmic was analyzed in these different sub-populations. Within the geminin-positive tumors (n = 170), all c-Abl-negative tumors (n = 15) showed nuclear HMGB1 expression, all nuclear c-Abl-overexpressing tumors (n = 142, p = 0.002 vs. 0, p = 0.003 vs. C and p = 0.006 vs. NC) showed cytoplasmic HMGB1 expression, all cytoplasmic c-Abl-overexpressing tumors (n = 1) showed nuclear HMGB1 expression, and from the nucleo-cytoplasmic c-Abl-overexpressing tumors (n = 11), 5 showed nuclear HMGB1 expression and 6 showed cytoplasmic HMGB1 expression (Figure 3G, left). In contrast, within the geminin-negative tumors (n = 156), all c-Abl-negative tumors (n = 14) showed nuclear HMGB1 expression (Figure 3G, right), there was no geminin-negative tumors overexpressing nuclear c-Abl, all cytoplasmic c-Abl-overexpressing tumors (n = 140, p = 0.004 vs. 0 and p = 0.002 vs. NC) showed nuclear HMGB1 expression (Figure 3G, right) and from the nucleo-cytoplasmic c-Abl-overexpressing tumors (n = 2), 1 showed nuclear HMGB1 expression and 1 showed cytoplasmic HMGB1 expression (Figure 3G, right).
Adverse clinical outcomes in breast cancer patients overexpressing geminin
To investigate the association between geminin alone or with HMGB1 expression and clinical outcomes, “PROGgeneV2” [32, 33] resource was used to analyze publicly available datasets for the prognostic significance of increased geminin expression with or without the increase in HMGB1 expression using Kaplan-Meier method.
First, analysis of The Cancer Genome Atlas (TCGA) patients’ dataset (n = 593) revealed that patients with high geminin expression (n = 319) had significantly shorter overall survival (OS) compared to patients with low expression (n = 274, HR = 1.5, 95% CI = 1.13–1.98, p = 0.0051, Figure 3H). Moreover, in accordance with the above data showing increased geminin and not HMGB1 expression in tumor cell lines compared to naïve HME cells (Figure 1A), when the same TCGA dataset was reanalyzed instead for geminin + HMGB1 the same trend remained (i.e. geminin + HMGB1 overexpressing patients showed lower OS than low expressing HR = 1.59, 95% CI = 0.98–2.57) although the statistical significance somewhat decreased (p = 0.062, Figure 3I).
Analysis of the “GSE3494” dataset (n = 158 lymph-node negative (LNN) cancers resected in Uppsala, Sweden between January 1987 and December 1989) [34] for OS showed high geminin expressers (n = 89) had significantly shorter OS than low expressers (n = 69, HR = 1.83, 95% CI = 1.18–2.86, p = 0.0074, Figure 3J). Analysis of the “GSE2034” dataset (n = 285 LNN breast cancer patients) [35] for relapse free survival (RFS) showed that patients with high geminin expression (n = 142) had significantly shorter RFS than low expressing patients (n = 143, HR = 1.37, 95% CI = 1.09–1.74, p = 0.0078, Figure 3K). Analysis of the “GSE4922” dataset (n = 248 breast cancer patients) [36] for RFS showed that high geminin expressers (n = 124) had significantly shorter RFS than low expressers (n = 124, HR = 1.33, 95% CI = 1.05–1.69, p = 0.0165, Figure 3L). Finally, analysis of the “GSE11121” dataset (n = 199 untreated after surgery of LNN breast cancer patients [37] showed that high geminin + HMGB1 expressing patients (n = 100) had significantly shorter metastatic-free survival (MFS) than low expressing patients (n = 99, HR = 3.38, 95% CI = 1.7–6.72, p = 0.0005, Figure 3M). These data clearly show that GemOE is correlated with adverse outcomes, such as low OS and RFS in breast cancers, whereas HMGB1 seems to be involved only in increase GemOE-breast cancer metastasis.
Hypoxia/necrosis exacerbates Ac-HMGB1 secretion from GemOE tumors in vitro and in vivo
To re-enforce the data shown above in a controlled system of GemOE tumors, IHC staining of sections from GemOE orthotopic tumors (n = 30) for geminin, c-Abl and HMGB1 was done. Like human tissues, GemOE tumors sections (Figure 4A) showed exclusive nuclear c-Abl (Figure 4B), and cytoplasmic HMGB1 (Figure 4C) expression. Moreover, serum isolated from peripheral blood collected at the time of euthanasia of these mice that developed tumors following injection of iGemOE cells (n = 30) and from mice injected with naïve HME cells that developed no tumors (n = 10) were processed for HMGB1 specific ELISA. While mice injected with naïve HME cells contained 16.05 ng/ml of HMGB1 in the circulation, GemOE-tumor bearing mice contained 168.5 ng/ml of HMGB1 in their circulation (p = 0.00042, Figure 4D), thus supporting the above conclusion that GemOE phenotype is associated with cytoplasmic expression and/or extracellular secretion of HMGB1, in vivo.
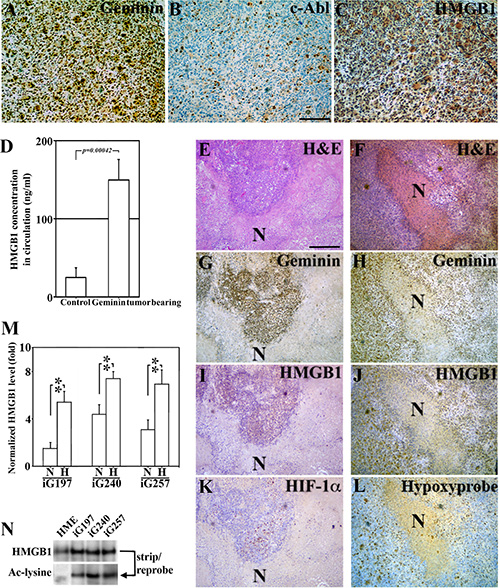
Figure 4: Hypoxic/necrotic core in GemOE tumors enhances Ac-HMGB1 secretion. (A–C) Adjacent sections from a GemOE tumor IHC stained for geminin (A), c-Abl (B) and HMGB1 (C). (D) The level of circulating HMGB1 measured using specific ELISA assay performed on serum isolated from samples collected 7 weeks after mice were injected in mammary fat pads with naïve HME cells (n = 10, no tumors developed) or GemOE cells (n = 30, tumor-bearing, p = 0.00042). Two different sets (E, G, I and K) and (F, H, J and L) of adjacent sections from GemOE orthotopic mammary tumors stained with H & E (E and F), or IHC stained for geminin (G and H), HMGB1 (I and J) as well as HIF-1α (K) or hypoxyprobe (L). N denotes necrosis within these tumors that are shown adjacent to the hypoxic cells as indicated by high HIF-1α or hypoxyprobe staining. These cells are also expressing cytoplasmic HMGB1. (M) The levels of HMGB1 detected using specific ELISA assay released from iGem9, iG197, iG240 or iG257 cells grown under normoxic (N) or hypoxic (H) conditions. Experiments were done in triplicates 3 different times, **represents p < 0.001. (N) The level of acetylated HMGB1 passively diffused from naïve HME, iG197, iG240 or iG257 cells after repeated freeze and thaw cycles.
Additionally, adjacent sections from these orthotopic mammary GemOE tumors were stained with anti-geminin, -HMGB1, -HIF-1α antibodies or for hypoxyprobe-1. Due to their fast growing nature, GemOE tumors contain large necrotic cores that were easily detected in H & E sections (see N in Figure 4E and 4F). Surrounding these necrotic cores, surviving geminin-overexpressing cells (Figure 4G and 4H) that express cytoplasmic HMGB1 (Figure 4I and 4J) are HIF-1α+ (Figure 4K) or hypoxyprobe+ (Figure 4L) hypoxic cells.
iG197, iG240 and iG257 cells were grown under normoxic (N) or hypoxic (H) conditions for 24h. HMGB1 specific ELISA showed that compared to iG197, iG240 and iG257 growing under N condition these cell lines growing under H condition secrete ~3 fold higher HMGB1 (Figure 4M). These data establish the active secretion of Ac-HMGB1 from GemOE cells in vitro and surviving GemOE tumor cells in tumor cores in vivo, which is exacerbated by hypoxic environment within the core.
To determine whether the passively diffused HMGB1 from necrotic GemOE tumor cells within the core in vivo is also acetylated, naïve HME, iG197, iG240, and iG257 cells were exposed to several rounds of freeze-thaw cycles to mimic the in vivo necrotic conditions. Passively diffused proteins were then IPd using an anti-HMGB1 antibody, which showed almost equal amounts of HMGB1 in naïve HME and GemOE tumor cell lines (Figure 4N, upper panel). Stripping and re-probing the membrane with an anti-acetyl-lysine antibody showed that while no Ac-HMGB1 was detected in necrotic naïve HME cells, high level of Ac-HMGB1 was detected in the necrotic GemOE tumor cells (Figure 4N, lower panel). Taken together, these data suggest that hypoxia exacerbates secretion of HMGB1 from GemOE cells, in vitro and in vivo and that whether actively secreted from surviving/hypoxic or passively diffused from dying/necrotic GemOE cells in vitro or GemOE cells within tumor cores in vivo HMGB1 is acetylated.
MSCs entrained by GemOE tumor cells express RAGE and CXCR4
Extracellular HMGB1 is involved among other functions in triggering trafficking of human MSCs into tumors [38, 39]. To understand the mechanism involved, we exposed early passage MSCs to none (grown in the presence of fresh HME medium) or naïve HME, iG240 or iG257 cells CM. Twenty-four hour later membrane proteins were isolated from all cultures and analyzed for known HMGB1 receptors. As oppose to TLR4 that was expressed at high level on the surface of MSCs, naïve MSCs are RAGE-negative (see [−] in Figure 5A). Exposure to naïve HME CM did not enhance RAGE expression on MSCs surface (Figure 5A). In contrast, exposure to iG240 and iG257 cells CM induced high level RAGE on MSCs surface (Figure 5A).
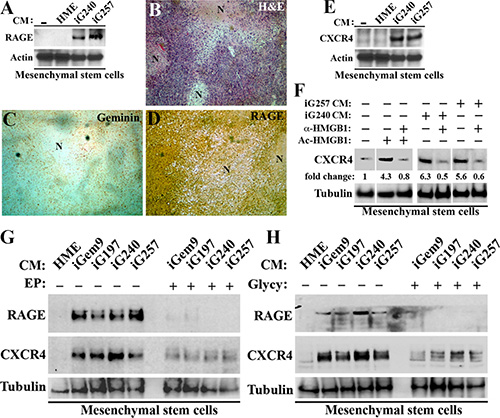
Figure 5: GemOE tumor cells induce MSCs to express RAGE and CXCR4. (A) The levels of RAGE on the surface of early passage MSCs following exposure to none (−), naïve HME, iG240 or iG257 CM for 24 h. (B–C) adjacent sections from GemOE orthotopic mammary tumor stained with H & E (B) or immunohistochemically stained with geminin (C) or RAGE (D). Note that as oppose to geminin staining that is detected in mammary cells only, RAGE staining is detected in mammary cells as well as stromal cells recruited into these tumors in vivo. (E) The levels of CXCR4 on the surface of early passage MSCs following exposure to none (−), naïve HME, iG240 or iG257 CM for 24 h. (F) The levels of CXCR4 on the surface of early passage MSCs following exposure to none (lane 1), 10 μg/ml Ac-rHMGB1 (lane 2), 10 μg/ml Ac-rHMGB1 + 10 μg/ml HMGB1 NeuAb (lane 3), iG240 CM alone (lane 4) or + 10 μg/ml HMGB1 NeuAb (lane 5), iG257 CM alone (lane 6) or + 10 μg/ ml HMGB1 NeuAb (lane 7) for 24 h. (G) The levels of RAGE and CXCR4 on the surface of early passage MSCs following exposure to naïve HME, iGem9, iG240 or iG257 CM for 24 h in the absence (−) or presence (+) of 200 μM EP. (H) The levels of RAGE and CXCR4 on the surface of early passage MSCs following exposure to naïve HME, iGem9, iG240 or iG257 CM for 24 h in the absence (−) or presence (+) of 200 μM Glycyrrhizin. In all parts of the figure experiments were done between 2–3 separate times.
To corroborate these data further, adjacent sections from GemOE-induced tumors were IHC stained with anti-geminin and anti-RAGE antibodies. Again around necrotic cores (see N in H & E stained section, Figure 5B), tumor but not stromal cells expressed geminin (Figure 5C), whereas tumor (see also Figure 2E) and stromal cells (including MSCs) expressed high levels of RAGE (Figure 5D). Together show constitutive RAGE expression on the surface of GemOE tumor cells, but inducible expression on the surface of MSCs through interaction with GemOE cells (cf. Figure 5A).
CXCR4 is a major receptor involved in MSCs recruitment into tumors (see introduction). MSCs membrane proteins from Figure 5A were blotted for CXCR4 expression. Like RAGE, naïve MSCs are CXCR4-negative (or express very low level on their surface, see [−] in Figure 5E) and exposure to naïve HME cells CM caused no change in the level of CXCR4 on the surface of MSCs (Figure 5E). In contrast, exposure to iG240 or iG257 cells CM caused significant increase in CXCR4 level on MSCs surface (Figure 5E). Taken together, these data suggest that a factor secreted by GemOE tumor cells (such as Ac-HMGB1, see below) stimulates expression of RAGE and CXCR4 on the surface of the non-expressing MSCs.
Ac-HMGB1-RAGE signaling stimulates CXCR4 expression on naïve MSCs surface
To directly assess the role of Ac-HMGB1 secreted from GemOE tumor cells on induction of CXCR4 on the surface of MSCs, we again exposed early passage MSCs for 24 h to fresh HME medium supplemented or not with recombinant HMGB1 (rHMGB1, 10 μg/ml) that was in vitro acetylated. Some cultures were exposed to Ac-rHMGB1 plus anti-HMGB1 neutralizing antibody (HMGB1 NeuAb, 10 μg/ml). Unlike naïve MSCs that showed low/no detectable level of CXCR4 on their surface (taken as 1, 1st lane in Figure 5F), MSCs exposed to Ac-rHMGB1 showed > 4fold increase in the expression of CXCR4 on their surface (compare 2nd to 1st lane in Figure 5F). HMGB1 NeuAb completely blocked the induction of CXCR4 by Ac-rHMGB1 (compare 3rd to 2nd lane in Figure 5F).
Additionally, we exposed early passage MSCs for 24 h to iG240 or iG257 cells CM that was supplemented or not with 10 μg/ml HMGB1 NeuAb. Here too compared to naïve MSCs grown in fresh HME medium supplemented, MSCs exposed to iG240 cells CM (compare 4th to 1st lane in Figure 5F) or iG257 cells CM (compare 6th to 1st lane in Figure 5F) showed 5-7fold increase in CXCR4 level on their surface. This induction was also completely blocked by the HMGB1 NeuAb (compare 5th to 4th lane and 8th to 7th lane, respectively in Figure 5F). Together show that whether diffused out of necrotic GemOE cells or released from hypoxic GemOE cells within tumor cores, Ac-HMGB1 upregulates CXCR4 on the surface of MSCs most likely through activation of RAGE.
To directly explore this possibility, early passage MSCs were grown in naïve HME CM for 24 h, in the presence of CM from iGem9, iG197, iG240 or iG257 cells pre-treated with vehicle or 200 μM EP [30] for 24 h or CM from the same cell lines supplemented or not with 200 μM glycyrrhizin (Glycy, inhibits extracellular HMGB1 binding to RAGE) [40]. Twenty-four hours later membrane proteins from all cultures were collected and RAGE and CXCR4 levels in them were examined. Again, in the presence of naïve HME cells CM MSCs showed no RAGE or CXCR4 expression on their surface (see 1st lanes in Figure 5G and 5H). In contrast, in the absence of the drugs iGem9, iG197, iG240 or iG257 cells CM induced expression of RAGE and CXCR4 on the surface of MSCs (see [−] in Figure 5G and 5H). These inductions were almost completely blocked when MSCs were exposed to CM collected from iGem9, iG197, iG240 or iG257 cells pre-exposed to EP (see under [+] in Figure 5G) or Glycy (added at the time CM was added to MSCs, see under [+] in Figure 5H). Together re-enforces the aforementioned conclusion that induction in CXCR4 expression on the surface of naïve MSCs is directly controlled by Ac-HMGB1 activation of RAGE in vitro and in vivo and suggest that GemOE cells through secreting Ac-HMGB1 recruit MSCs to their vicinity in tumor cores.
GemOE tumor cells recruit MSCs to their vicinity using CXCR4 signaling, in vitro
To directly assess this hypothesis we analyzed the level of CXCR4 ligand SDF1 expression within or secreted from iGemOE cells. According to Western blot analysis comparing naïve HME cells to iGem9, iG197, iG240 or iG257 cells showed that tumor cells contain much higher levels of SDF1 (Figure 6A). Additionally, specific SDF1 ELISA showed that under normoxic conditions naïve HME cells secrete significantly lower level of SDF1 compared to iGem9, iGem197, iGem240 and iGem257 (white bars in Figure 6B). Together suggest that production and secretion of SDF1 is elevated in GemOE tumor cells. Secretion of SDF1 by iGem9, iG197, iG240 and iG257 cells and not by naïve HME cells was further stimulated under hypoxic conditions (for 24 h, black bars in Figure 6B). We concluded that hypoxia also exacerbates the production and secretion of SDF1 from GemOE cells and could be involved in enhancing MSCs recruitment to the vicinity of GemOE cells in tumor cores.
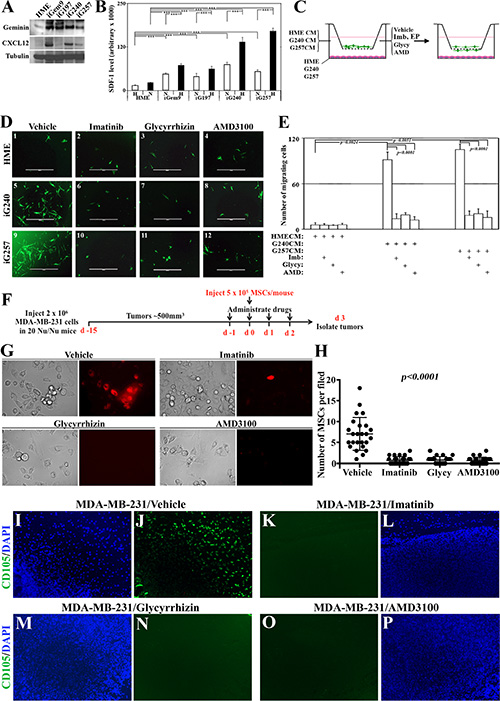
Figure 6: Novel signaling circuit involved in recruitment of MSCs to the vicinity of GemOE tumors, in vitro and in vivo. (A) The levels of geminin and SDF1/CXCL12 expressed in naïve HME, iGem9, iG197, iG240 or iG257 cells. (B) The levels of SDF1/CXCL12 secreted from naïve HME, iGem9, iG197, iG240 or iG257 cells grown under normoxic (N) or hypoxic (H) conditions as detected using specific ELISA assay. Experiments were done in triplicates 3 different times, ***represents p < 0.0001. (C) Schematic representation showing the experimental strategy used in (D and E). (D) Representative images showing the recruitment of GFP-MSC to the lower side of Boyden chambers inserts when naïve HME, iG240 or iG257 cells were layered on the lower wells and cells were grown in the presence of vehicle (1, 5 and 9, respectively), 10 μM imatinib (2, 6 and 10, respectively), 200 μM Glycyrrhizin (3, 7 and 11, respectively) or 10 μM AMD3100 (4, 8 and 12, respectively). (E) Quantitative analysis of the data represented in (D). Experiments were done in triplicates 3 different times, **represents p < 0.001 and ***represents p < 0.0001. (F) Schematic representation of the in vivo strategy used in the experiments used in G-P. (G) Representative images of cell lines generated from subcutaneously generated MDA-MB-231 tumors in Nu/Nu mice that were intracardiac injected with red-labeled MSCs and treated with vehicle, imatinib, glycyrrhizin or AMD3100 for 4 days (day −1, 0, 1 and 2 with regards to MSCs injection) collected 24 h after the last drugs administration (i.e. day 3 after MSCs injection). (H) Quantitative analysis of the data represented in (F). (I–P) Fluorescence immunohistochemical staining using anti-human CD105 (human MSC marker, green) and counterstained with DAPI (blue) of sections from the MDA-MB-231 tumors described in F. Except the in vivo part, all parts are of experiments that were done 2–3 separate times.
To experimentally explore this, naïve HME, iG240 and iG257 cells were plated in the lower well of 8 μm pores Boyden chambers. Green fluorescence protein (GFP)-expressing MSCs were placed in the inserts and vehicle, imatinib (10 μM), EP (200 μM), Glycy (200 μM) or AMD3100 (a specific CXCR4 inhibitor, 10 μM) were added to CM (Figure 6C, left). Twenty-four hours later, GFP-MSCs migrated to the bottom of the inserts were counted and photographed (Figure 6C, right). In vehicle-treated cultures, naïve HME cells recruited ~5 ± 1 GFP-MSCs/high magnification field (HF) to their vicinity (Figure 6D1 and 6E). In contrast, vehicle-treated iG240 cells recruited ~102 ± 11 MSCs/HF (Figure 6D5 and 6E) and iG257 recruited ~111 ± 8 MSCs/HF (Figure 6D9, and 6E). Recruitment by naïve HME cells was not affected when cells were treated with imatinib (Figure 6D2 and 6E), EP (not shown), Glycy (Figure 6D3 and 6E) or AMD3100 (Figure 6D4 and 6E). On the other hand, significant decrease in the number of GFP-MSCs recruited to the vicinity of iG240 and iG257 cells in the presence of imatinib (Figure 6D6 and 6D10, respectively), EP (not shown), Glycy (Figure 6D7 and 6D11, respectively) or AMD3100 (Figure 6D8 and 6D12, respectively) was detected. We propose that GemOE tumor cells actively recruit MSCs to their vicinity through the signaling circuit “GemOEàHMGB1/RAGEàSDF1/ CXCR4.
GemOE tumor cells recruit MSCs to their vicinity using CXCR4 signaling, in vivo
To define the role of this signaling circuit in recruiting MSCs to breast tumors in vivo, 2 × 10⁶ cells of the TNBC cell line; MDA-MB-231 was subcutaneously injected in the back in 20 Nu/Nu mice (Figure 6F). When tumors reached ~500 mm3 mice were divided into 4 groups (5 mice each) that received on day -1 vehicle, 40 mg/kg imatinib, 200 mg/kg Glycy or 3.5 mg/kg AMD3100 (Figure 6F). The next day all mice were intracardially injected with red-labeled MSCs (Red-MSCs, 5 × 10⁵ cells/mouse, Figure 6F). Each group of mice was then treated with the above drugs on the day of MSCs injection (i.e. day 0, Figure 6F), followed by 2 more injections of the aforementioned drugs on day 1 and day 2 following MSCs injection (Figure 6F). Mice were left for another day before tumors were collected (Figure 6F).
First, we used these tumors to generate cultures that were analyzed 48 h later under fluorescence microscope for the presence of Red-MSCs. A large number of Red-MSCs was found within cultures generated from vehicle treated mice (see Figure 6G and 6H), indicating enhanced MSCs recruitment ability, in vivo. In contrast, cultures generated from tumors treated with imatinib, Glycy or AMD3100 contained very few, if any, Red-MSCs within them (Figure 6G and 6H).
Second, paraffin-embedded sections generated from these tumors were IHC stained with an anti-human specific MSCs marker; CD105. We again found that vehicle-treated tumors contained high number of CD105+ cells (Figure 6I and 6J) indicating enhanced MSCs recruitment ability, in vivo. In contrast, mice treated with imatinib (Figure 6K and 6L), Glycy (Figure 6M and 6N) or AMD3100 (Figure 6O and 6P) showed no CD105+ staining indicating significant loss of their ability to attract MSCs, in vivo. We propose that similar to in vitro data, in vivo GemOE cells recruit MSCs to their vicinity through secreting Ac-HMGB1 that promotes expression and activation of RAGE, which in turn induces CXCR4 expression in MSCs that responds to high levels of SDF1 secreted from GemOE tumor cells. Inhibiting geminin activity through inactivating c-Abl, HMGB1 secretion from GemOE cells or activation of RAGE in MSCS or CXCR4 activity in MSCs abrogates the migration of MSCs towards SDF1 expressing GemOE cells.
MSCs entrained by GemOE enhance aggressiveness in GemOE tumor cells, in vitro
We next used mammosphere formation assay to measure the impact of MSCs entrained by GemOE on the aggressiveness of breast tumor cells. In low-binding culture dishes, a thousand naïve HME, iG240 or iG257 cells were plated alone or admixed with MSCs at 1:0.25, 1:0.5 or 1:1 ratios (mammary cells:MSCs). Naïve HME cells alone failed to form any mammospheres (Figure 7A1 and 7B) and mixing with MSCs even at 1:1 ratio did not increase their mammospheres’ forming ability (see Figure 7A2-4 and Figure 7B) or the diameter of the few mammospheres formed (Figure 7B inset). In contrast, iG240 and iG257 cells alone formed many mammospheres (7A5 and 7A9 and 7B) with relatively large diameter size (Figure 7B inset). Mixing with MSCs at 1:0.25 showed only slight increase in the number of mammospheres developed by iG240 or iG257 cells (Figure 7A6 or 7A10, respectively) but had no impact on the diameter of these mammospheres (Figure 7B, inset). However, admixed with 1:0.5 or 1:1, MSCs significantly increased the numbers (Figure 7A7,8 and 7A11,12, respectively and 7B) and the diameter (Figure 7B inset) of the mammospheres formed by iG240 and iG257. Together suggest that once in the vicinity of GemOE tumor cells, MSCs activate stemness/aggressiveness in tumor cells.
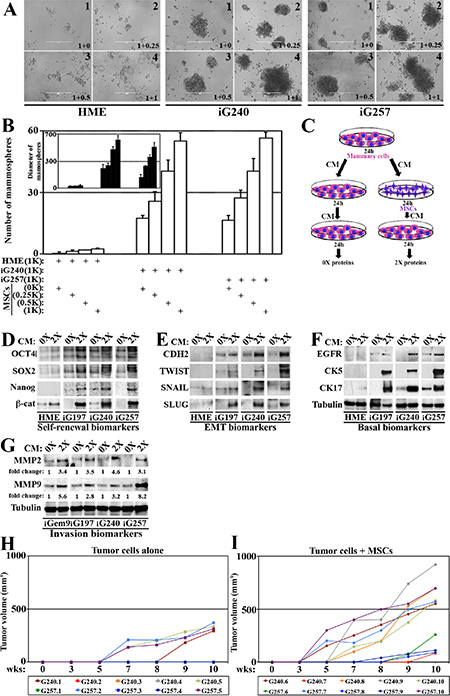
Figure 7: MSCs enhance GemOE aggressiveness, in vitro and in vivo. (A) Mammosphere formed when 1000 naïve HME, iG240 or iG257 cells were plated alone or mixed with 250, 500 or 1000 MSCs. (B) Quantitative analysis of the data represented in (A). Experiments were done in triplicates 3 different times with p values between 0.0010–0001. Inset shows diameter of mammosphere developed in (A). Experiments were done in triplicates 3 different times with p values between 0.0010–0001. (C) Schematic representation of the experiments described in (D–F). The levels of indicated self-renewal biomarkers (D), EMT biomarkers (E) or basal biomarkers (F) in proteins extracted from naïve HME, iG197, iG240 or iG257 cells following the 0× or 2× treatment. (G) Similar experiments showing the levels of the invasion proteins MMP2 and MMP9 in proteins extracted from iGem9, iG197, iG240 or iG257 cells following the 0× or 2× treatment. (H) The size of orthotopic tumors developed in Nu/Nu mice injected with 2 × 10⁶ iG240 (T1-T5) or 2 × 10⁶ iG257 (T6-T10) cells within 10 weeks set limit for the experiment. (I) The size of orthotopic tumors developed in Nu/Nu mice injected with 2 × 10⁶ iG240 + 3 × 10⁵ MSCs (T11–T15) or 2 × 10⁶ iG257 + 3 × 10⁵ MSCs (T16–T20) cells within 10 weeks set limit for the experiment. In all parts of the figure experiments were done between 2–3 separate times.
To further establish that, media conditioned by naïve HME, iG197, iG240 or iG257 cells for 24 h was added onto the same cell lines or onto MSCs for 24 h before this re-conditioned media were added to cultures of the same cell line (Figure 7C). Proteins isolated from mammary cellsàMSCsàmammary cells were called 0×, whereas proteins from mammary mammary cellsàMSCsàmammary cells were called 2× (Figure 7C). In agreement with the above data, compared to 0 × proteins isolated from naïve HME cells, 0× proteins isolated from iG197, iG240, iG257 contained higher levels of some self-renewal (e.g., OCT4 and SOX2), EMT (e.g., CDH2 and SNAIL) and basal (e.g., EGFR and CK17) (Figure 7D–7F) biomarkers. Impressively, in 2 × proteins isolated from iG197, iG240, iG257 cells the levels of the self-renewal (OCT4, SOX2, NANOG and β-catenin, Figure 7D), EMT (CDH2, TWIST, SNAIL and SLUG, Figure 7E) and basal (EGFR, CK5 and CK17, Figure 7F) biomarkers were significantly increased. The same treatment slightly increased the levels of some, such as β-catenin, SLUG and CK17 in naïve HME cells (Figure 7D–7F).
Moreover, compared to 0× proteins isolated from iGem9, iG197, iG240 and iG257, 2× proteins showed dramatic increase in the levels of the invasion promoting proteins (MMP2 and MMP9, Figure 7G). Indeed, compared to 0 × isolated proteins from iGem9, iG197, iG240 and iG257 each taken as 1, we detected 3-5fold increase in the levels of MMP2 and between 2-8fold increase the levels of MMP9 in 2× proteins isolated from these cell lines (Figure 7G). Taken together, these data re-enforce the aforementioned conclusion that MSCs entrained by GemOE tumor cells reciprocally increase tumor cells aggressiveness in vitro.
GemOE-entrained MSCs promote GemOE-tumor cells aggressiveness, in vivo
Finally, to assess the role of MSCs on GemOE aggressiveness in vivo, we used orthotopic tumor formation model. Previously, injection of 5 × 10⁶ GemOE cells into SCID or Nu/Nu mice mammary fat pads promoted orthotopic GemOE tumor of ~1.5 cm3 tumors within ~7 weeks. Therefore, we elected to test tumor formation by 2 × 10⁶ cells from cell lines generated from these tumors (namely G240 and G257) when co-injected or not with MSCs and set 10 weeks as the endpoint. Twenty Nu/Nu mice divided into 4 groups (5 mice each) were injected into the 2nd left mammary fat pads with G240 cells alone (group 1), 2 × 10⁶ G240 cells + 3 × 10⁵ MSCs (group 2), 2 × 10⁶ G257 cells alone (group 3) and 2 × 10⁶ G257 cells + 3 × 10⁵ MSCs (group 4). All mice were kept on Dox-supplemented drinking water and tumor growth was monitored 3 times a week using caliper.
Only 2 mice (T1 and T5) from group 1 and 2 mice from group 3 (T7 and T10) developed tumors (Figure 7H) within the 10 weeks allowed. In contrast, all 5 mice from group 2 and group 4 developed tumors within the 10 weeks (Figure 7I). Moreover, tumors developed in mice in group 1 and 3 showed long latency, i.e. began to appear by 5–8 weeks after injection and were small in size with volumes remaining below 500 mm3 by 10 weeks (Figure 7H). In contrast, tumors developed in mice from group 2 and 4 showed short latency, i.e. appeared much earlier and were larger in size with some tumor reaching ~1000 mm3 by 10 weeks (Figure 7I). Indeed, 3 tumors T11 (iG240 + MSCs), T17 and T20 (iG257 + MSCs) began to appear by week 3 and reached ~750 mm3 by week 10 (Figure 7I). Another 3 tumors T13, T14 and T15 (iG240 + MSCs) began to appear by week 5 and grow fast to reach 700-900 mm3 by week 10 (Figure 7I). Finally, tumor T12 (iG240 + MSCs) and T16, T17 and T19 (iG257 + MSC) tumors began to appear by week 7–9 and grow relatively slow to reached 100–300 mm3 by week 10 (Figure 7I). These data show that even at this low number, GemOE cells are able to form tumors. However, admixed with MSCs GemOE cells show significant increase in the tumor take and number. MSCs also increased the volume of each tumor developed, a reflection of the increase in growth rate. Finally, co-injecting MSCs significantly decreased the latency of tumor formation by ~2 weeks. Taken together, these data show that even in vivo the proximity of MSCs enhances GemOE tumor cell tumorigenic potential.
DISCUSSION
There has been intensive search for mechanisms that dictate which cells within a given breast tumor become metastatic precursors. Even more intensive search has been for defining whether these mechanisms are intrinsic or induced by the microenvironment. It is well appreciated that hypoxia and necrosis within tumor cores are intimately involved in the development of more aggressive tumor cells [41]. Cells located within these cores are exposed to the harshest conditions within the tumor. If they survive, they most likely become more aggressive. In the current work we expand on this by suggesting that tumor cells within the necrotic/hypoxic GemOE breast tumors core become breast cancer metastasis precursors through recruiting and interacting with MSCs [42].
Within this core, dying/necrotic or surviving/hypoxic GemOE tumor cells release Ac-HMGB1. RAGE and not TLR4 is constitutively expressed by all GemOE tumor cells. This suggests that through autocrine/paracrine binding to these RAGE receptors, Ac-HMGB1 activates NF-κB signaling and promotes survival of these hypoxic GemOE tumor cells within tumor cores. In contrast, only after exposure to GemOE tumor cells CM, RAGE expression was initiated on the surface of MSCs. Activation of RAGE expression and activation was also directly correlated with CXCR4 induction and activation on the surface of MSCs also through activating NF-κB signaling [4, 5]. These CXCR4 expressing MSCs later migrate towards SDF1 secreting GemOE cells in the cores. This suggests that within the cores RAGE plays different functions. We also showed that HMGB1 passively diffused out of dying necrotic cells in the cores is also acetylated and thus could also be involved in the directed migration of MSCs towards SDF1 secreting GemOE tumor cells within the cores. Schematic representation of the conclusions from our studies is shown in Figure 8.
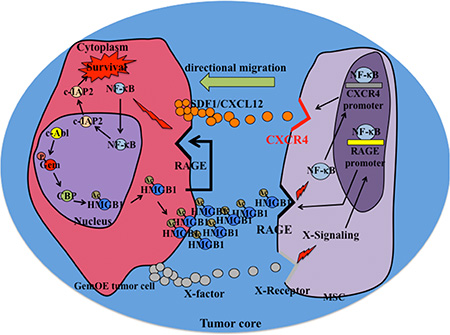
Figure 8: Schematic representation of the data presented in this article.
How Ac-HMGB1 induces RAGE expression on the surface of RAGE-negative naïve MSCs is currently unknown. However, it is possible that low level of RAGE receptor below our level of detection exists on the surface of MSCs is initially activated by Ac-HMGB1, which promotes further expression of RAGE as an inflammatory response in a NF-κB-dependent manner [19, 29]. Alternatively, other soluble factors in GemOE CM, e.g., IL-6 may initially activate RAGE expression and once it is located on the surface, binding by Ac-HMGB1 maintain high-level expression on the surface. Also possible is that the initial effect of Ac-HMGB1 is through activating TLR4, then switching to RAGE once expressed. Future analysis will focus on 2 major topics were not studied here; direct comparison between tumor areas with and without necrosis with regards to the level of MSCs present, and define whether there are obvious differences in GemOE/TNBC tumor samples with regards to the level of lymphocytes infiltration and amount of MSCs present.
Our data also clearly show that once in the vicinity of GemOE tumor cells within the tumor core, MSCs reciprocally interact with GemOE tumor cells and increase their aggressiveness phenotype. Bi-directional crosstalk between tumor cells and MSCs has been extensively demonstrated in a variety of cancers. Our data shows that MSCs entrained by this crosstalk augment GemOE TIC, EMT and most importantly basal phenotypes [this study and 24, 25]. TICs and EMT enhance tumor progression [43], drug-/radio-resistance and post-treatment relapse [44] in breast cancers [45–47]. It is thus important to identify the cytokines and the intracellular signaling involved in these crosstalk to help the development of more efficient anti-breast cancer therapies.
Intriguingly, IHC analysis performed on sections from the original GemOE tumors used to generate the cell lines, G197, G240 and G257 showed high (although patchy) staining level for several TIC, EMT and basal biomarkers presented here (manuscript in preparation). The fact that their levels dropped in the cell lines (see 0× in Figure 7D–7G) and increased only when tumor cells were exposed to MSCs re-CM medium (see 2× in Figure 7D–7G) suggests that cells differentiated in culture lose expression of these biomarkers. The fact that the expression was reinstated suggests their de-differentiation in culture driven by interaction with MSCs and point out to the enormous plasticity of these GemOE/TNBC tumor cells. In support of that MSCs derived from ovarian cancers were more effective in inducing cancer growth, especially the putative TIC/CSCs phenotype than normal human bone marrow isolated MSCs [48, 49].
Finally, the current studies clearly show an important role for c-Abl, HMGB1 and CBP in enhancing GemOE/TNBC cells aggressiveness. It is not surprising that a CBP (as well as p300 and GCN) small molecule inhibitor was recently shown to inhibit TNBC cell growth in vitro and in vivo [50]. SIRT1 activating resveratrol could also be a good candidate for treating GemOE/TNBC [15, 16]. Additionally, based on the work presented here, combinatorial therapies targeting geminin through inhibiting c-Abl with imatinib plus CBP inhibitor and/or drugs that activate SIRT1 and/or inhibitors Ac-HMGB1 secretion or binding to RAGE could be pursued as valid therapies to prevent MSCs recruitment and enhancement of GemOE/TNBC tumor aggressiveness.
MATERIALS AND METHODS
HME cells generation protocol
Normal mammary epithelial cells isolated in our laboratory from tissues during mammary gland reduction surgeries, or were purchased Clonetics/Cambrex (Waltersville, MD). The isolated cells were named normal HME cells and were infected with a retro-plasmid expressing TERT for immortalization. After selection with appropriate antibiotic, the resultant cells were expanded and frozen for future use at early passages. Although immortalized the karyotype of the cells was tested at every 10 passages and was found to be normal. These cells were named naïve HME cells. Naïve HME cells were infected with a retrovirus carrying a TetOn plasmid (Clontech) selected, expanded and froze. Naïve HME cells expressing TetOn were next infected with a retrovirus expressing an inducible TRE-geminin allele (Clontech). Infected clones expressing geminin after incubation with Doxycycline (2 μg/ml) were chosen for further use. Gem9 is one such clone that express similar amount of geminin as TNBC cells and therefore was chosen to develop orthotopic tumors. For more information regarding these protocols [27].
HME and Gem9 cells synchronization and transfection protocol
Detail of this protocol was first published in [27]. In brief, HME and Gem9 cells were incubated in growth factor-free medium for 72 hours to synchronize cells in G0/G1 phase (> 95%) G0/G1 cells were then released from arrest in medium containing growth factors, and 16 hours (S phase), 22 hours (G2/M phase) or 24 hours (M/G1 phase) later cells were collected and analyzed. For more information regarding this protocol [27, 51]. Cell transfection with double-stranded RNA interference (siRNA) reagent was performed as described by [51]. In brief, cells were transfected (0 hours) in serum-free medium with a relevant by a standard method using oligofectamine. At 24 hours, the medium was changed, and growth factor-containing MEBM (Clonetics/Cambrex, Waltersville, MD) was added. Small interfering RNA (siRNA) used were siGem: TGAGCTGTCCGCAGGCTTT, scrambled siGem: TGATTTGTCCGCAGCTGGC and c-Abl siRNA was premade from Dharmacon. The silenced luciferase (siLuc) was from previously published data. For more information see [24–27].
Mesenchymal stem cells (MSCs)
The human MSCs were purchased from Texas A & M HSC COM Institute for Regenerative Medicine who isolated, verified and propagated the cells.
Cell culture and drug treatment
Breast cancer cell lines were maintained in RPMI medium (Invitrogen) supplemented with 10% FBS and antibiotics. Doxycycline and Glycyrrhizic acid ammonium salt were from Sigma, Imatinib and Ethyl pyruvate (EP) were from Toronto Research Chemicals Inc. (TCR) and AMD3100 octahydrochloride was from TOCRIS.
Antibodies
A mouse anti-geminin monoclonal antibody was developed and extensively tested in our laboratory [27], 2 different mouse monoclonal anti-c-Abl were used and gave essentially identical results, one was from (Cell Signaling, #2862) and the other from (Santa Cruz, sc-23), rabbit anti-Sp1 (Santa Cruz, sc-14027), rabbit anti-acetylated-lysine (Cell Signaling, #9441), mouse anti-Actin (Calbiochem, cat. # cp01), rabbit anti-CBP (Cell Signaling, #4772], rabbit anti-H2B (abcam, ab18977), mouse anti-CD105 (Abcam, ab114052), two different HMGB1 antibodies were used here; mouse anti-HMGB1 (abcam, ab77302) and rabbit anti-HMGB1 (Millipore, #07-584), rabbit anti-Tubulin (abcam, ab11320), rabbit anti-NF-κB/p65 (Santa Cruz, sc-372), rabbit anti-IκB (Santa Cruz, sc-371), rabbit anti-c-IAP2 (Abnova, PAB0253), rabbit monoclonal anti-RAGE (abcam, ab172473), mouse anti-HIF-1α (Novus, NB100-105), rabbit anti-CXCR4 (abcam, ab2074), rabbit anti-SDF1 (Cell Signaling, #3740), mouse anti-OCT3/4 (Santa Cruz, sc-5279), mouse anti-Sox2 (Cell Singling, #4900), goat anti-Nanog (R & D, AF1997), rabbit monoclonal anti-Slug (Cell Signaling, #9585), mouse anti-Twist (abcam, ab50887), rabbit anti-Snail (abcam, ab82846), mouse anti-N-Cadherin (BD, 610920), rabbit monoclonal anti-EGFR (Cell Signaling, #4267), rabbit monoclonal anti-CK5 (abcam, ab75869), rabbit monoclonal anti-CK17 (abcam, ab51056), goat anti-MMP2 (Santa Cruz, sc-6838), goat anti-MMP9 (Santa Cruz, sc-6840). All antibodies were tested and protocols for use on cell culture and on TMA were described in details previously [24–27].
Chromatin, nuclear and cytoplasmic extracts purification, followed by western blot or immunoprecipitation
The protocols used by [27, 51] were used to isolate total extracts by sonication and chromatin preparations. Briefly, cells at about 75% confluence were washed several times with PBS and trypsinized. After washing cells were resuspended in Buffer A (110 mM KC2H3O2, 15 mM NaC2H3O2, 2 mM MgC2H3O2, 0.5 mM ethylene glycol tetraacetic acid and 20 mM 4-(2-hydroxyethyl)-1-piperazineethanesulfonic acid (HEPES), pH 7.3). Next, we added 2 mM DTT and 50 μg/ml of digotinin to the cell suspension. The cells were agitated at 4°C for 10 minutes. Nuclei were pelleted by centrifugation in a swinging bucket rotor at 1,500 × g for 10 minutes. They were resuspended in hypotonic Buffer B (1mM HEPES, pH 7.5, and 0.5 mM ethylenediaminetetraacetic acid (EDTA) supplemented with 0.5% NP-40). The nuclear suspension was then agitated at 4°C for 15 minutes and layered on top of a 10 ml sucrose cushion (100 mM sucrose, 0.5 mM Tris HCl, pH 8.5), then centrifuged at 3,500 × g for 15 minutes at 4°C. The chromatin pallet was suspended in 0.25 mM EDTA, pH 8.0, and sonicated three times for 10 seconds each using a Fisher Scientific Model 100 Sonic Dimembrator (Fisher Scientific, Pittsburgh, PA, USA). After sonication, the chromatin suspension was centrifuged twice at high speed for 10 minutes at 4°C, and the supernatants were retained. This chromatin extract was first precleared by agitation for 2 hours at 4°C in the presence of 50 μg of protein A/G Sepharose beads, followed by pelleting of the beads. The supernatant protein concentration was measured, and 500–1000 μg of chromatin protein were routinely immunoprecipitated using 1 or 2 μg of Ab and 50 μl of protein A/G Sepharose beads in a total volume of 1ml of NETN buffer (in which the NaCl concentration was preset at 250 to 500 mM). To isolate nuclear vs. cytoplasmic from the same cell, cells were washed with ice cold PBS, re-suspend in buffer 1 (containing: 10 mM HEPES, 10 mM KCl, 0.5 mM DTT, 1% NP-40) and incubated 10 min at 4°C with gentle agitation, followed by centrifugation for 2 min at max speed and the supernatant was saved as cytoplasmic extract. Nuclear pellet was re-suspended in buffer 2 (containing: 20 mM HEPES, 20% Glycerol, 500 mM KCl, 0.2 mM EPTA, 0.5 mM PMSF, 0.5 mM DTT, 1.5 mM MgCl2); incubated 15 min at 4°C with gentle agitation, sonicated and then spun down at max speed to remove non-soluble faction and supernatant was saved as nuclear extract. In all western blot analysis, 25 μg of protein from each extract is loaded on gels.
Immunofluorescence analysis
Cells were seeded on slide chambers (Lab Tek) at 25% confluence 24 hours prior to processing. Cells were fixed with 4% paraformaldehyde for 10 minutes at room temperature (RT), permeabilized in Triton X-100 buffer (0.5% Triton X-100 in 20 mM HEPES, pH 7.4, 50 mM NaCl, 3 mM Mg2Cl, 300 mM sucrose containing 0.5% BSA) for 10 minutes at 4°C. Cells were then incubated for 30 minutes with 5% normal mouse or rabbit serum (MS or RS) in PBS and then incubated for 30 minutes at 37°C with primary antibody. Cells were then incubated with appropriate FITC- or rhodamine-conjugated secondary antibody diluted 1:5000 in 5% MS or RS in PBS for 30 minutes at 37°C. Cover slips were mounted in anti-FADE solution (Vector) supplemented with DAPI.
In vitro acetylation assay
The assay was performed in HAT buffer containing: 50 mM Tris-HCl pH 8.0, 10% glycerol v/v, 1 mM DTT, 0.1 mM EDTA, 0.1 mM PMSF and 10 mM sodium butyrate), with 0.1–0.2 mg/ml rHMGB1 (Sino Biological Inc.), and ~20 ng/ml GST-CBP fusion proteins. Reactions were incubated for 20 min at 37°C and cooled at 4°C for 10 min before beads and substrate were separated by centrifugation at 1000 g for 5 min.
NF-κB luciferase reporter luciferase assay
The pGL4.32[luc2P/NF-κB-RE/Hygro] vector (Promega, Madison, WI) contains five copies of an NF-κB response element (NF-κB-RE) that drives transcription of the luciferase reporter gene luc2P. GemOE cell lines were transfected with this vector. The next day, cells were treated or not with sRAGE (10 μg/ml, PROSPEC) for 48 h, then luciferase assay (Promega) was used to measure the NF-κB reporter activity. Data were first normalized against Renilla-Luciferase activity.
Tissue samples and immunohistochemical (IHC) analysis of paraffin-embedded tumor samples
A University of Hawaii IRB committee approved the use of human tumor sample. A training cohort was a commercial TMA (Biomax.us, n = 511 samples) containing normal/cancer adjacent tissues (n = 66), ductal carcinoma in situ (DCIS, n = 180), invasive (n = 100), and metastatic (n = 165) breast tumor samples and a confirmation cohort, consisted of disease-free adult tissues (including; kidney, liver, placenta, spleen and mammary tissues) and a conformational cohort (n = 326, breast tumor samples, different stages) acquired from the Hawaiian Surveillance, Epidemiology and End Results (SEER) collection constructed in quadruplicate, each containing one sample from a different region of a tumor at 4 μm were used.
IHC staining scoring
Immunostained slides were scored using a modified protocol of the one described previously [52, 53]. In brief, under light microscope stained sections were scored by counting positive cells in at least 10 high power fields of each tumor section. Score was estimated as follow: 0 = no staining (< 1% of the cells stained); 1 = weak (1–10% of the cells stained); 2 = medium (10–50% of the cells stained); 3 = strong (> 50% of the cells stained). An intensity score was also assigned to each tumor in which the average intensity of positive tumor cells is represented as 0 = none, 1 = weak, 2 = intermediate, and 3 = strong. The positivity and intensity scores were then added to obtain a total score, which ranged from 0 to 6. A pathologist scored slides blindly.
Overall survival (OS) and repalce-free survival (RFS) and metastasis-free survival (MFS) analysis
Data source for disease-free survival used was the GOBO bioinformatics resource. The association of geminin alone or combined with HMGB1 was investigated for stratified patient cohorts using overall survival (OS) and relapse-free survival (RFS) or metastasis-free survival (MFS) using the PROGgeneV2 - Pan Cancer Prognostics Database (http://watson.compbio.iupui.edu/chirayu/proggene/database). Furthermore, the Kaplan-Meier survival analysis was determined for the gene set in 7 subgroups for a total of 2078 cases with RFS, MFS or OS follow-up from the GEO study as fellows: TCGA, sample size: 593, GSE1456, samle size: 158, GSE2034, sample size: 286, GSE4922, sample size: 248, GSE11121, sample size: 199. Data presented as median cut-off and shown as high expressers vs. low expressers patients for geminin alone or geminin + HMGB1.
In vivo tumorigenicity assay
The University of Hawaii or the University of Mississippi Medical Center IACUC committees approved all animal experiments. Six- to eight-week-old anaesthetized immune-compromised Nu/Nu (Harlan) mice were injected with 2 × 10⁶ cells re-suspended in 100 μl of HME medium or RPMI medium and matrigel (1:1) using a 27-gauge needle either subcutaneously on the back or orthotopically in the 2nd left mammary gland. Tumor initiation was defined as the time when tumors were 3mm in diameter. Mice were sacrificed when the tumors reached ~1.5 cm3 in volume or at 10 wks. Tumor volume was calculated with the formula 4/3πr3 (where r is the tumor radius). At the end of the experiments, mice were euthanized by compressed 100% CO2 gas, tumors were dissected out, weighed, fixed in formalin, and later cut at 4 μm for histological and immunohistochemical analysis. In some instance, from anesthetized mice (using a mix of oxygen and isoflurane gas), 200 μl of blood was drawn from the heart before they were euthanized.
Preparation and injection of red-labeled MSCs
To generate red-labeled MSCs we used the PKH26 Red Fluorescent Cell Linker Kit for General Cell Membrane Labeling (Sigma-Aldrich) as per manufacturer procedures. In brief, in RT a 2 × cell suspension was prepared by re-suspending pre-washed 2 × 10⁷ MSCs in serum free medium in 1 ml of Diluent C. A 2 × dye solution prepared by adding 4 μl of PKH26 ethanolic dye solution to 1 ml of Diluent C and mixed well. Rapidly add the 1ml of 2 × cell suspension to 1 ml of 2 × dye solution and immediately mix the sample by pipetting. Leave for < 5 min and stop the reaction by adding 2 ml of serum and incubate 1 min to allow binding of excess dye. Centrifuge cells at 400 × g for 10 min followed by washing 3 times with 10 ml complete medium to remove any unbound dye. Red-labeled cells were injected in mice circulation by injection through the left cardiac ventricle.
In vivo measurement and imaging of orthotopic or subcutaneous tumors
Tumor formation was analyzed with IVIS luciferase machine (Xenogen) weekly and tumor size was measured every 3rd day by caliper (Life Sciences instruments). To analyze tumor formation using the in vivo system, mice were i.p. injected using 27-gauge needle with 100 μl of D-luciferin solution (Xenogen) prepared at 15 mg/mL in PBS. Mice were then anesthetized using a mix of oxygen and isoflurane gas. Anesthetized animals were maintained sleep during the imaging procedures by placing the animal nose in a nose cone with a flow of anesthesia gas and take a picture of the tumors.
In vivo drug treatments
MDA-MB-231 cells were injected subcutaneously on the back of SCID mice as described above. Mice with tumors ~0.5 cm3 were injected through the heart with 1 × 10⁶ Red-labeled MSCs and treated with 50 mg/kg/day imatinib, 200 mg/kg/day glycyrrhizin and 3.5 mg/kg AMD3100 by gavage or i.p. injection on day-1, 0, 1 and 2 with regard to MSCs injection. At the end of the experiments tumors were dissected out, weighed and fixed in formalin, cut at 4 μm for histological and immunohistochemical analysis.
Hypoxia treatment and hypoxyprobe assay and analysis
To perform hypoxia in vitro, culture dishes were placed in incubator with 1% O2, whereas normoxic conditions were plating cells under commonly used 20% O2 incubator. For hypoxyprobe analysis, mice to be analyzed for hypoxia were i.p. injected with Hypoxyprobe™-1 (hpi, Burlington, MA) solution (60 mg/kg body weight) dissolved in saline, 60–90 min before mice are sacrificed. IHC of pimonidazole adducts in formalin-fixed, paraffin-embedded tissues was performed using manufacturer’s procedures and in [54].
Isolation of serum and plasma from mouse blood samples
Blood samples collected were divided into 2 fractions. The first was used to isolate serum and the second to isolate plasma. For serum preparation, whole blood was collected in a covered test tube and allowed to clot by leaving undisturbed at RT for ~30 min. Clot was then removed by centrifuging at 1,000–2,000 g for 10 min at 4°C. The isolated serum is immediately transferred into a clean polypropylene tube aliquoted into 0.5 μl aliquots and stored in −80°C. For plasma preparation, blood was collected into anticoagulant-treated tubes. Cells are removed from plasma by centrifugation for 10min at 1,000–2,000 g at 4°C. The resulting plasma is transferred into a clean polypropylene tube, aliquoted into 0.5 μl aliquots and stored at −80°C. We elected to use serum samples because they are more representative of inflammation.
ELISA analysis of culture medium or blood serum
Conditioned medium (CM) or serum (Ser) and dilution thereof were generated in PBS. Wells of a PVC microtiter plate were coat with antigen by pipetting 50 μl of the CM or Ser and dilution in triplicates. Plate was covered and incubated for overnight at 4°C. Plate was washed 3 times with PBS. Blocking of none-specific sites was done using blocking buffer (5% BSA in PBS) and the plate was incubated for > 2 h at room temperature followed by washing as above. Diluted primary antibody (determined using pilot experiments) was added to each well and incubated for 2 hours at room temperature followed by washing steps with PBS. Horse-radish peroxidase (HRP) conjugated secondary antibody diluted in blocking buffer and incubated for 1 hour at room temperature washed with PBS. Detection was done using the OPD (o-phenylenediamine dihydrochloride) tables and the end product was measured at 492 nm. All ELISA experiments were done in triplicates at least 3 separate times. P-value are * ≤ 0.05, ** ≤ 0.01 and *** ≤ 0.001.
Statistical analysis
Comparisons of treatment outcomes were tested for statistical differences using the Student t-test for paired data. The association of mRNA transcript expression with various clinico-pathologic parameters was also analyzed. Statistical significance was assumed at a P-value are * ≤ 0.05, ** ≤ 0.01 and *** ≤ 0.001.
ACKNOWLEDGMENTS
Wael M. ElShamy is Dr. Lawrence and Mrs. Bo Hing Chan Tseu American Cancer Society Research Scholar.
FUNDING
This research was funded in part by a grant # RSG-09-275-01 from American Cancer Society.
CONFLICTS OF INTEREST
The authors declare no conflicts of interest.
REFERENCES
1. Kfoury Y, Scadden DT. Mesenchymal Cell Contributions to the Stem Cell Niche. Cell Stem Cell. 2015; 16:239–253.
2. Motaln H, Turnšek TL. Cytokines Play a Key Role in Communication between Mesenchymal Stem Cells and Brain Cancer Cells. Protein Pept Lett. 2015; 22:322–331.
3. Chaturvedi P, Gilkes D, Takano N, Semenza G. Hypoxia-inducible factor-dependent signaling between triple-negative breast cancer cells and mesenchymal stem cells promotes macrophage recruitment. Proc Natl Acad Sci USA. 2014; 111:E2120–E2129.
4. Yu Q, Liu L, Lin J, Wang Y, Xuan X, Guo Y, Hu S. SDF-1α/CXCR4 Axis Mediates The Migration of Mesenchymal Stem Cells to The Hypoxic-Ischemic Brain Lesion in A Rat Model. Cell J. 2015; 16:440–447.
5. Penzo M, Habiel D, Ramadass M, Kew R, Marcu K. Cell migration to CXCL12 requires simultaneous IKKα and IKKβ-dependent NF-κB signaling. Biochim Biophys Acta. 2014; 1843:1796v1804.
6. Chang AI, Schwertschkow AH, Nolta JA, Wu J. Involvement of Mesenchymal Stem Cells in Cancer Progression and Metastases. Curr Cancer Drug Targets. 2015; 15:88–98.
7. Kim Y, Lin Q, Glazer P, Yun Z. Hypoxic Tumor Microenvironment and Cancer Cell Differentiation. Curr Mol Med. 2009; 9:425–434.
8. Warfel NA, El-Deiry WS. HIF-1 signaling in drug resistance to chemotherapy. Curr Med Chem. 2014; 21:3021–3028.
9. Müller S, Scaffidi P, Degryse B, Bonaldi T, Ronfani L, Agresti A, Beltrame M, Bianchi ME The double life of HMGB1 chromatin protein: architectural factor and extracellular signal. EMBO J. 2001; 20:4337–4340.
10. Srinivasan M, Banerjee S, Palmer A, Zheng G, Chen A, Bosland M, Kajdacsy-Balla Kalyanasundaram R, Munirathinam G. HMGB1 in hormone-related cancer: a potential therapeutic target. Horm Cancer. 2014; 5:127–139.
11. Taguchi A, Blood DC, del Toro G, Canet A, Lee DC, Qu W, Tanji N, Lu Y, Lalla E, Fu C, Hofmann MA, Kislinger T, Ingram M, et al. Blockade of RAGE-amphoterin signalling suppresses tumour growth and metastases. Nature. 2000; 405:354–360.
12. Lundbäck P, Stridh P, Klevenvall L, Jenkins R, Fischer M, Sundberg E, Andersson U, Antoine DJ, Harris HE. Characterization of the inflammatory properties of actively released HMGB1 in juvenile idiopathic arthritis. Antioxid Redox Signal. 2016; 24:605–19. doi: 10.1089/ars.2014.6039.
13. Bonaldi T, Talamo F, Scaffidi P, Ferrera D, Porto A, Bachi A, Rubartelli A, Agrresti A, Bianchi ME. Monocytic cells hyperacetylate chromatin protein HMGB1 to redirect it towards secretion. EMBO J. 2003; 22:5551–5560.
14. Pasheva E, Sarov M, Bidjekov K, Ugrinova I, Sarg B, Lindner H, Pasheva IG. In vitro acetylation of HMGB-1 and -2 proteins by CBP: the role of the acidic tail. Biochemistry. 2004; 43:2935–2940.
15. Rabadi M, Xavier S, Vasko R, Kaur K, Goligorksy M, Ratliff B. High-mobility group box 1 is a novel deacetylation target of Sirtuin1. Kidney Int. 2015; 87:95–108.
16. Walko Iii TD, Di Caro V, Piganelli J, Billiar TR, Clark RS, Aneja RK. Poly (ADP-ribose) Polymerase1-Sirtuin1 functional interplay regulates LPS-mediated High Mobility Group Box-1 secretion. Mol Med. 2015; 20:612–624.
17. Nasser M, Wani N, Ahirwar D, Powell C, Ravi J, Elbaz M, Zhao H, Shilo K, Ostrowski M, Shapiro C, Carson WE 3rd. RAGE Mediates S100A7-Induced Breast Cancer Growth and Metastasis by Modulating the Tumor Microenvironment. Cancer Res. 2015; 75:974–985.
18. Volk-Draper L, Hall K, Griggs C, Rajput S, Kohio P, DeNardo D, Ran S. Paclitaxel therapy promotes breast cancer metastasis in a TLR4-dependent manner. Cancer Res. 2014; 74:5421–5434.
19. Riehl A, Németh J, Angel P, Hess J. The receptor RAGE: Bridging inflammation and cancer. Cell Comm. Signl. 2009; 7:12.
20. Hiwatashi K, Ueno S, Kubo F, Sakoda M, Tateno T, Hayashi T, Abeyama K, Natsugoe S. Relevance of apoptosis and tolerance to hypoxic stress in cells transfected with receptor for advanced glycation end products (RAGE). Anticancer Res. 2009; 29:1287–1294.
21. Tafani M, Schito L, Pellegrini L, Villanova L, Marfe G, Anwar T, Rosa R, Indelicato M, Fini M, Pucci B, Russo MA. Hypoxia-increased RAGE and P2X7R expression regulates tumor cell invasion through phosphorylation of Erk1/2 and Akt and nuclear translocation of NF-κB. Carcinogenesis. 2011; 32:1167–1175.
22. Medeiros MC, Frasnelli SC, Bastos Ade S, Orrico SR, Rossa C Jr. Modulation of cell proliferation, survival and gene expression by RAGE and TLR signaling in cells of the innate and adaptive immune response: role of p38 MAPK and NF-κB. J Appl Oral Sci. 2014; 22:185–193.
23. Sparvero L, Asafu-Adjei D, Kang R, Tang D, Amin N, Im J, Rutledge R, Lin B, Amoscato AA, Zeh HJ, Lotze MT. RAGE (Receptor for Advanced Glycation Endproducts), RAGE ligands, and their role in cancer and inflammation. J Transl Med. 2009; 7:17.
24. Blanchard Z, Mullins N, Ellipeddi P, Lage JM, McKinney S, El-Etriby R, Zhang X, Isokpehi R, Hernandez B, ElShamy WM. Geminin overexpression promotes imatinib sensitive breast cancer: a novel treatment approach for aggressive breast cancers, including a subset of triple negative. PLoS One. 2014; 9:e95663.
25. Blanchard Z, Malik R, Mullins N, Maric C, Luk H, Horio D, Hernandez B, Killeen J, ElShamy WM. Geminin overexpression induces mammary tumors via suppressing cytokinesis. Oncotarget. 2011; 2:1011–1027. doi: 10.18632/oncotarget.363.
26. Gardner L, Malik R, Shimizu Y, Mullins N, ElShamy WM. Geminin overexpression prevents the completion of topoisomerase IIα chromosome decatenation leading to aneuploidy in human mammary epithelial cells. Breast Cancer Res. 2011; 13:R53.
27. Nakuci E, Xu M, Pujana M, Valls J, ElShamy WM. Geminin is bound to chromatin in G2/M phase to promote proper cytokinesis. Int J Biochem Cell Biol. 2006; 38:1207–1220.
28. He Q, You H, Li XM, Liu TH, Wang P, Wang BE. HMGB1 promotes the synthesis of pro-IL-1β and pro-IL-18 by activation of p38 MAPK and NF-κB through receptors for advanced glycation end-products in macrophages. Asian Pac J Cancer Prev. 2012; 13:1365–1370.
29. Wu X, Mi Y, Yang H, Hu A, Zhang Q, Shang C. The activation of HMGB1 as a progression factor on inflammation response in normal human bronchial epithelial cells through RAGE/JNK/NF-κB pathway. Mol Cell Biochem. 2013; 380:249–257.
30. Fink, M. Ethyl pyruvate: a novel treatment for sepsis. Curr Drug Targets. 2007; 8:515–518.
31. Ko YB, Kim BR, Nam SL, Yang JB, Park SY, Rho SB. High-mobility group box 1 (HMGB1) protein regulates tumor-associated cell migration through the interaction with BTB domain. Cell Signal. 2014; 26:777–783.
32. Goswami C, Nakshatri H. PROGgene: gene expression based survival analysis web application for multiple cancers. J Clin Bioinforma. 2013; 3:22.
33. Goswami C, Nakshatri H. PROGgeneV2: enhancements on the existing database. BMC Cancer. 2014; 14:970.
34. Miller LD, Smeds J, George J, Vega VB Vergara L, Ploner A, Pawitan Y, Hall P, Klaar S, Liu ET, Bergh J. An expression signature for p53 status in human breast cancer predicts mutation status, transcriptional effects, and patient survival. Proc Natl Acad Sci USA. 2005; 102:13550–13555.
35. Wang Y, Klijn J, Zhang Y, Sieuwerts A, Look MP, Yang F, Talantov D, Timmermans M, Meijer-van Gelder ME, Yu J, Jatkoe T, Berns EM, et al. Gene-expression profiles to predict distant metastasis of lymph-node-negative primary breast cancer. Lancet. 2005; 365:671–679.
36. Ivshina AV, George J, Senko O, Mow B, Putti TC, Smeds J, Lindahl T, Pawitan Y, Hall P, Nordgren H, Wong J, Liu E, Bergh J, et al. Genetic reclassification of histologic grade delineates new clinical subtypes of breast cancer. Cancer Res. 2006; 66:10292–10301.
37. Schmidt M, Böhm D, von Törne C, Steiner E, Puhl A, Pilch H, Lehr HA, Hendstler JG, Kolbl H, Gehrmann M. The humoral immune system has a key prognostic impact in node-negative breast cancer. Cancer Res. 2008; 68:5405–5413.
38. Lotfi R, Eisenbacher J, Solgi G, Fuchs K, Yildiz T, Nienhaus C, Rojewski M, Schrezenmeier H. Human mesenchymal stem cells respond to native but not oxidized damage associated molecular pattern molecules from necrotic (tumor) material. Eur J Immunol. 2011; 41:2021–2028.
39. Xie HL, Zhang Y, Huang YZ, Li S, Wu CG, Jiao XF, Tan M, Huang Y, Deng L. Regulation of high mobility group box 1 and hypoxia in the migration of mesenchymal stem cells. Cell Biol. 2014; Int 38:892–897.
40. Gu XJ, Xu J, Ma BY, Chen G, Gu PY, Wei D, Hu WX. Effect of glycyrrhizin on traumatic brain injury in rats and its mechanism. Chin J Traumatol. 2014; 17:1–7.
41. Flier JS, Underhill LH, Dvorak HF. Tumors: wounds that do not heal. N Engl J Med. 1986; 315:1650–1659.
42. El-Haibi CP, Karnoub AE. Mesenchymal stem cells in the pathogenesis and therapy of breast cancer. J Mammary Gland Biol Neoplasia. 2010; 15:399–409.
43. McLean K, Gong Y, Choi Y, Deng N, Yang K, Bai S, Cabrera L, Keller E, McCauley L, Cho K, Buckanovich R. Human ovarian carcinoma associated mesenchymal stem cells regulate cancer stem cells and tumorigenesis via altered BMP production. J. Clin. Invest. 2011; 121:3206–3219.
44. Liu X, Fan D. The epithelial-mesenchymal transition and cancer stem cells: functional and mechanistic links. Curr Pharm Des. 2015; 21:1279–1291.
45. Kotiyal S, Bhattacharya S. Breast cancer stem cells, EMT and therapeutic targets. Biochem Biophys Res Commun. 2014; 453:112–116.
46. Yan X, Jia Y, Chen L, Zeng Q, Zhou J, Fu C, Chen H, Yuan H, Li Z, Shi L, Xu Y, Wang J, et al. Hepatocellular carcinoma-associated mesenchymal stem cells promote hepatocarcinoma progression: role of the S100A4-miR155-SOCS1-MMP9 axis. Hepatology. 2013; 57:2274–2286.
47. Pasquet M, Golzio M, Mery E, Rafii A, Benabbou N, Mirshahi P, Hennebelle I, Bourin P, Allal B, Teissie J, Mirshahi M, Couderc B. Hospicells (ascites-derived stromal cells) promote tumorigenicity and angiogenesis. Int J Cancer. 2010: 126:2090–2101.
48. Noman MZ, Messai Y, Muret J, Hasmim M, Chouaib S. Crosstalk between CTC, Immune System and Hypoxic Tumor Microenvironment. Cancer Microenviron. 2014; 7:153–160.
49. Zimmerlin L, Park TS, Zambidis ET, Donnenberg VS, Donnenberg AD. Mesenchymal stem cell secretome and regenerative therapy after cancer. Biochimie. 2013; 95:2235–2245.
50. Yang H, Pinello C, Luo J, Li D, Wang Y, Zhao L, Jahn S, Saldanha S, Chase P, Planck J, Geary K, Ma H, Law B, et al. Small-molecule inhibitors of acetyltransferase p300 identified by high-throughput screening are potent anticancer agents. Mol Cancer Ther. 2013; 12:610–20.
51. ElShamy WM, Livingston DM. Identification of BRCA1-IRIS, a BRCA1 locus product. Nat Cell Biol. 2004, 6:954–967.
52. Allred D, Clark G, Elledge R, Fuqua S, Brown R, Chamness G, Osborne C, McGuire W. Association of p53 protein expression with tumor cell proliferation rate and clinical outcome in node-negative breast cancer. J Natl Cancer Inst. 1993; 85:200–206.
53. Allred D, Harvey J, Berardo M, Clark G. Prognostic and predictive factors in breast cancer by immunohistochemical analysis. Mod Pathol. 1998; 11:155–168.
54. Raleigh J, Chou S, Tables L, Suchindran S, Varia M, Horsma M. Int. J. Radiat Oncol Biol Phys. 1998; 42:727–730.