
INTRODUCTION
Most biological activities in the lives of mammals, such as hormone secretion, cellular functionand metabolism, fluctuate over a 24-h period. This fluctuation, known as circadian rhythm, is generated through circadian variation in the expression of clock genes in nearly every cell in the body [1–6]. Light is one of the factors affecting circadian rhythm, but in the absence of light, the activities of life continue to operate over an approximately 24-h cycle. Thus, the circadian rhythm is one of the basic characteristics of an organism’s life [2, 5, 7].
King et al. cloned the first mammal clock gene, Clock, in 1997 [8]. Since then, at least 14 core clock genes have been reported, including PER1, PER2, PER3, CRY1, CRY2, ClOCK, BMAL1, TIM, CK1ε, NPAS2, REV-ERBs, DEC1, DEC2 and RORs [2, 3, 7, 9, 10]. Clock genes have three important functions [2, 4, 5]. First, circadian rhythm generated by circadian variation in clock gene expression maintains a high level of coordination and synchronization among different and complicated physiological processes. Second, the internal clock can be reset in response to external changes to better adapt to the environment. Third, clock genes control approximately 2%-10% of the genes in a mammal’s genome. These are known as clock-controlled genes (CCGs), and can affect cellular activities by altering expression downstream CCGs [11–13]. Moreover, recent studies have shown that aberrant expression and altered clock gene rhythms are associated with pathogenic conditions, including cancer, obesity and depression [9, 14, 15-17].
PER1 is an important clock gene that stabilizes the duration of circadian rhythm. Abnormal expression of PER1 in mammals is not only associated with circadian rhythm disturbances, but is also closely correlated with carcinogenesis and the development of cancers. Because there is a close relationship between the circadian rhythm and the cell cycle, aberrant PER1 expression can lead to abnormal expression of numerous downstream cell-cycle genes, including CyclinB1, CyclinD, Cyclin E, WEE-1, CDK1 and p53 [6, 20, 21]. It has therefore been suggested that PER1 can inhibit malignant cell transformation by altering the cell cycle and promoting cell-cycle checkpoint repair in response to DNA damage [6, 20]. However, carcinogenesis is a complex process involving cell growth, proliferation, apoptosis, invasion, metastasis and tumor angiogenesis [7, 9, 19, 22-24]. For that reason, in the present study we further investigated the relationship between PER1 and carcinogenesis. Our findings clarify the tumor suppressor role played by PER1 during carcinogenesis.
RESULTS
Construction of lentivirus shRNA plasmids
DNA sequencing showed the lentivirus PER1-shRNA-I-III plasmids to be exactly the same as the respective sense strands (Supplemental Figure S1 and Supplemental Table S1), which indicates the three shRNAs targeting PER1 were successfully constructed.
Levels of PER1 mRNA and protein in tumor cells
The relative level of PER1 mRNA (protein) normalized to the level of GAPDH mRNA (protein) was 1.58±0.52 (1.25±0.08) in untreated SCC15 cells, 1.55±0.45 (1.31±0.10) in cells expressing Control-shRNA, and 0.43±0.14 (0.75±0.12), 1.47±0.33 (1.12±0.08) and 1.09±0.11 (1.00±0.14), respectively, in cells expressing PER1-shRNA-I, -II or -III (Figure 1A-1C). Thus expression PER1-shRNA-I significantly (P<0.05) reduced levels of both PER1 mRNA and protein by about half as compared to the other groups. This demonstrates that PER1-shRNA-I effectively knocked down PER1 expression, and so it was used for the following experiments.
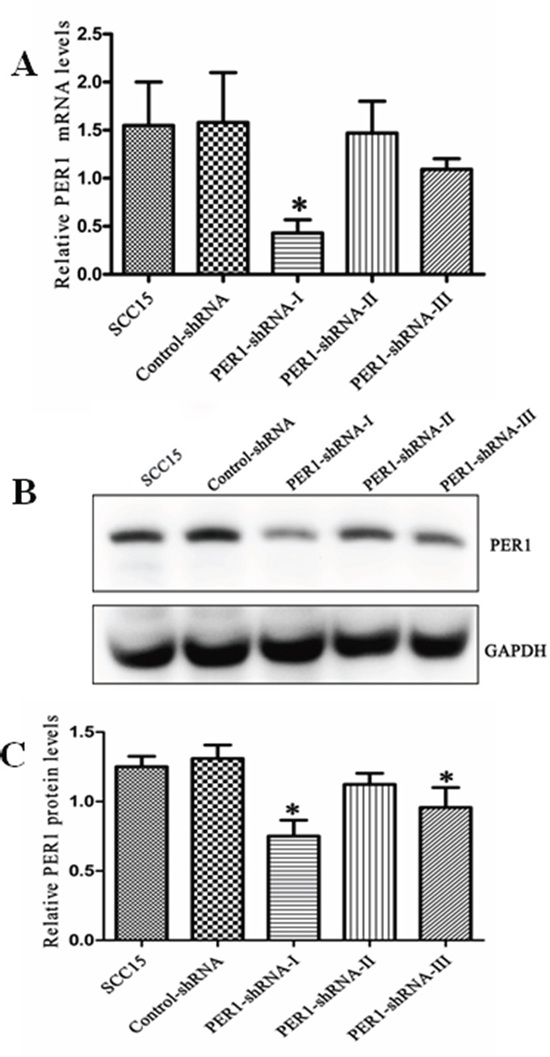
Figure 1: PER1 is efficiently knocked down in SCC15 cells transfected with PER1-shRNA-I. A. Levels of PER1 mRNA were significantly reduced in SCC15 cells transfected with PER1-shRNA-I. B. Levels of PER1 protein in the SCC15, Control-shRNA and PER1-shRNA-I-III groups. C. Expression of PER1 protein was significantly down-regulated in SCC15 cells transfected with PER1-shRNA-I or PER1-shRNA-III. Data were presented as the mean±SD. Significant differences between multiple groups were evaluated using ANOVA; differences between two groups were evaluated using the LSD test. *P<0.05.
Growth and proliferation of tumor cells
The results of CCK8 assays are shown in Figure 2A. Cell growth was obviously increased in the PER1-shRNA-I group as compared to the Control-shRNA and SCC15 groups (P<0.05), while there was no significant difference between the Control-shRNA and SCC15 groups (P>0.05). In addition, the colony formation rate in the PER1-shRNA-I group (73.00±6.08 %) was significantly higher than in the Control-shRNA (38.67±4.51 %) or SCC15 (44.67±4.51 %) group, which did not differ (P>0.05) (Figure 2B and 2C). This indicates that PER1 knockdown enhances cell growth potential.
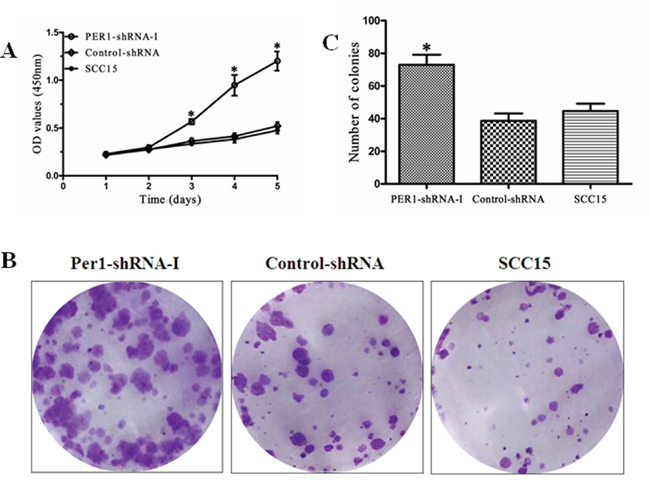
Figure 2: PER1 inhibits SCC15 cell growth and proliferation. A. CCK-8 assays of SCC15 cells in the PER1-shRNA-I, Control-shRNA and SCC15 groups. B. Representative micrographs of colonies formed by cells in the PER1-shRNA-I, Control-shRNA and SCC15 groups (crystal violet staining). C. The colony formation rate was significantly higher in SCC15 cells transfected with PER1-shRNA-I. Data were presented as the mean±SD. Differences between multiple groups were evaluated using ANOVA; differences between two groups were evaluated using the LSD test. *P<0.05.
Tumor cell apoptosis
The cell apoptosis index among cells expressing PER1-shRNA-I (16.91±1.78 %) was significantly lower than among cells expressing Control-shRNA (20.14±2.00 %) or untreated SCC15 cell (22.13±3.17 %), and again no difference was noted between the Control-shRNA and SCC15 groups (Figure 3A and 3B). This indicates that PER1 knockdown interferes with the progression of apoptosis in SCC15 cells.
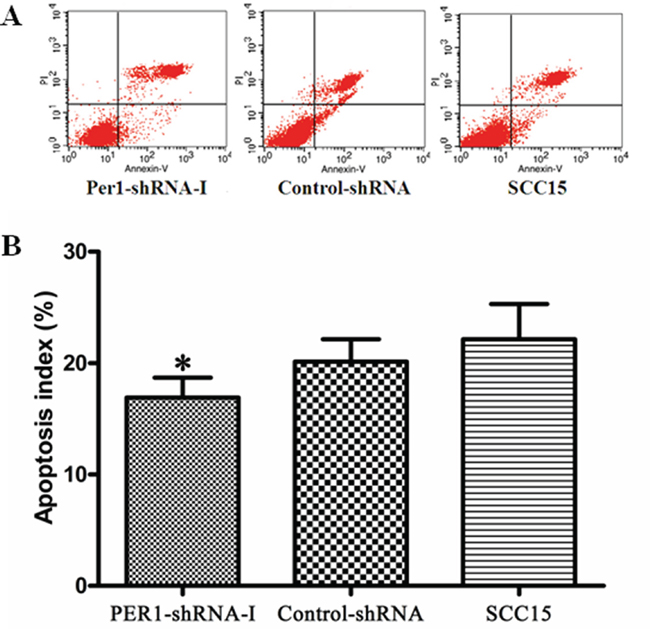
Figure 3: PER1 promotes SCC15 cell apoptosis. A. Representative flow cytometry profiles of apoptosis among cells in the PER1-shRNA-I, Control-shRNA and SCC15 groups. B. The apoptosis index was significantly reduced in SCC15 cells transfected with PER1-shRNA-I. Data were presented as the mean±SD. Differences between multiple groups were evaluated using ANOVA; differences between two groups were evaluated using the LSD test. *P<0.05.
Tumor cell migration and invasion
In Transwell assays, the average numbers of migrating (invading) cells in the PER1-shRNA-I, Control-shRNA and SCC15 groups were 113±12(52±6), 31±9 (23±6) and 32±8 (21±6), respectively (Figure 4A and 4B). PER1 knockdown significantly (P<0.05) increased both the migration and invasiveness of SCC15 cells as compared to cells in the Control-shRNA and SCC15 groups.
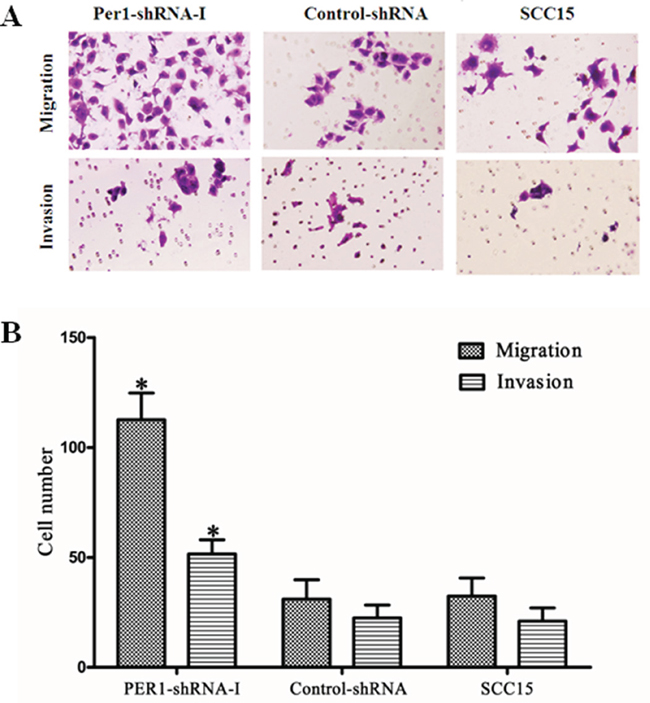
Figure 4: PER1 suppresses cell migration and invasion by SCC15 cells. A. Representative micrographs showing migrating and invading SCC15 cells in the indicated groups (crystal violet staining, 200×). B. PER1 knockdown increased migration and invasion by SCC15 cells. Data were presented as the mean±SD. Differences between multiple groups were evaluated using ANOVA; differences between two groups were evaluated using the LSD test. *P<0.05.
Levels of mRNA expression of tumor-related genes in tumor cells
Expression of KI-67, MDM2, BCL-2, MMP2 and MMP9 mRNA was significantly (P<0.05) up-regulated in the Per1-shRNA-I group ascompared to the Control-shRNA and SCC15 groups, while expression of C-MYC, p53, BAX and TIMP-2 mRNA was significantly (P<0.05) down-regulated. There was no notable difference between the Control-shRNA and SCC15 groups. In addition, there was no difference in expression of VEGF mRNA among the three groups (Table 1).
Table 1: Levels of mRNA expression of tumor-related genes in the PER1-shRNA-I, Control-shRNA and SCC15 groups (mean±SD)
Gene |
PER1-shRNA-I |
Control-shRNA |
SCC15 |
F |
P |
P1 |
P2 |
P3 |
|---|---|---|---|---|---|---|---|---|
PER1 |
0.43±0.14 |
1.55±0.45 |
1.58±0.52 |
7.88 |
0.021 |
0.015 |
0.013 |
0.931 |
KI-67 |
1.25±0.15 |
0.39±0.11 |
0.45±0.19 |
29.18 |
0.001 |
0.000 |
0.001 |
0.650 |
MDM2 |
1.02±0.04 |
0.58±0.21 |
0.63±0.20 |
5.93 |
0.038 |
0.020 |
0.031 |
0.749 |
C-MYC |
0.69±0.26 |
1.30±0.27 |
1.22±0.16 |
5.98 |
0.037 |
0.019 |
0.032 |
0.702 |
p53 |
1.20±0.23 |
2.60±0.72 |
2.78±0.22 |
10.89 |
0.010 |
0.009 |
0.005 |
0.643 |
BAX |
0.67±0.08 |
1.17±0.13 |
1.04±0.06 |
22.16 |
0.002 |
0.001 |
0.003 |
0.164 |
BCL-2 |
1.58±0.21 |
0.87±0.15 |
0.73±0.14 |
21.55 |
0.002 |
0.002 |
0.001 |
0.362 |
MMP2 |
1.61±0.19 |
0.98±0.03 |
0.95±0.14 |
23.03 |
0.002 |
0.001 |
0.001 |
0.749 |
MMP9 |
1.63±0.11 |
0.87±0.15 |
0.85±0.19 |
24.67 |
0.001 |
0.001 |
0.001 |
0.880 |
TIMP-2 |
0.82±0.17 |
1.44±0.42 |
1.33±0.19 |
14.75 |
0.005 |
0.002 |
0.006 |
0.376 |
VEGF |
1.55±0.48 |
1.27±0.37 |
1.37±0.31 |
0.40 |
0.689 |
0.414 |
0.591 |
0.767 |
Note: P values reflect differences in each gene expression among the three groups analyzed using one-way ANOVA.P1, P2, and P3 respectively reflect the intergroup differences between the PER1-shRNA-I and Control-shRNA groups, the PER1-shRNA-I and SCC15 groups, and the Control-shRNA and SCC15 groups analyzed using the LSD test after one-way ANOVA. Values of P<0.05 were considered significant.
In vivo tumorigenesis
Three weeks after subcutaneous injection of untreated SCC15 cells or cells expressing PER1-shRNA-I into the backs of 10 nude mice, the tumor weights (volumes) in the PER1-shRNA-I and SCC15 groups were respectively 0.48±0.04g (0.28±0.09 cm3) and 0.19±0.07 g (0.10±0.08 cm3) (P<0.05) (Figure 5A-5C). This finding demonstrates that PER1 knockdown promotes in vivo tumorigenesis by SCC15 cells.
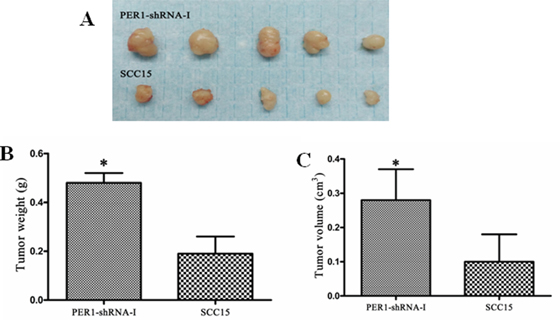
Figure 5: PER1 reduces SCC15 cells’ capacity for tumorigenesis in vivo. A. Photographs tumors from nude mice transplanted with untreated SCC15 cells or cells expressing PER1-shRNA-I. B and C. Average weights and volumes of transplanted tumors from nude mice were significantly increased after PER1 knockdown. Data were presented as the mean±SD. Student’s t-test was used to analyze the significanceof differences. *P <0.05.
DISCUSSION
Aberrant suppression of PER1 is strongly linked to carcinogenesis and tumor development [6, 9, 14, 15, 21]. Indeed, down-regulation of PER1 accelerates cell growth in breast cancer, whereas up-regulation of PER1 inhibits cell growth and promotes cell apoptosis in colon, prostate and lung cancers [6, 7, 15, 20]. Oral squamous cell carcinoma (OSCC) accounts for about 90% of oral cancers [9, 14, 19]. Our previous clinical research revealed that PER1 expression is decreased in OSCC and closely correlated with clinical phase and lymph node metastasis in patients with OSCC [9, 19]. This implies that PER1 protein acts as an important tumor suppressor.
Clock genes sustain organismal circadian rhythm and regulate downstream CCGs to affect cellular activities [2, 5, 11-13, 18, 20, 21]. Up to now, there have been more studies focused on the molecular mechanisms by which PER1 regulates circadian rhythm [2, 7, 14] than attempt to address the contribution of aberrant PER1 expression to the development and progression of carcinomas. Recent studies have demonstrated that PER1 overexpression can inhibit transcription of various downstream cell-cycle genes, including CyclinB1, CyclinD, CyclinE, WEE-1 and p21, and activate C-MYC and p53[6, 20]. Moreover, aberrant expression of PER1 disrupts cell cycle progression and inhibits repair of DNA damage, resulting in malignant transformation of affected cells [6, 20, 22]. However, carcinogenesis is a complex process involving cell growth, proliferation, apoptosis, invasion, metastasis and tumor angiogenesis [19, 22–24]. Recent studies have also shown that many important genes associated with tumor behavior exhibit circadian rhythm [3, 10, 22, 23, 25, 26]. These include the oncogene MDM2 and various genes supporting cell proliferation (KI-67), apoptosis (Bax), tumor invasion and metastasis (MMP9) and tumor angiogenesis (VEGF), as well as the anti-apoptosis gene BCL-2. These genes thus appear to function as CCGs under the control of clock genes, though it is unclear whether they are regulated specifically by PER1.
Our study is the first demonstration that PER1 knockdown in OSCC cells up-regulates expression of KI-67, MDM2, BCL-2, MMP2 and MMP9 and down-regulates expression of BAX and TIMP-2 expression. At the same time, PER1 knockdown enhanced tumor cell growth, proliferation, apoptosis resistance, invasion and metastasis in vitro and tumorigenesis in vivo. TIMP-2 is an inhibitor of MMPs [27]. We found that PER1 knockdown not only increased MMP2 and MMP9 expression, but also decreased TIMP-2 expression, presumably leading to the observed increases in tumor cell migration and invasion. We also observed that expression of the cell cycle genes C-MYC and p53 was significantly reduced after PER1 knockdown, which is consistent with the findings of Gery et al. [20]. Moreover, PER1 knockdown had no obvious effect on VEGF transcription. This may be because VEGF expression is not affected by PER1, or cell culture conditions failed to achieve hypoxia, an activator of VEGF transcription.
Earlier studies suggest that abnormal PER1 expression could change circadian rhythm and/or the cell cycle, leading to carcinogenesis [6, 20, 22]. Future studies will likely clarify the specific signaling pathways affected by PER1 as well as the contribution made by aberrant PER1 expression to the development and progression of carcinomas. It is also anticipated that emerging from these studies will be new and effective molecular targets for the treatment of cancers.
MATERIALS AND METHODS
Construction of lentivirus shRNA plasmids
Based on the GenBank mRNA sequence encoding hPER1 (NM_002616.2), shRNA target points (PER1-I, CAGCACCACTAAGCGTAAATG; PER1-II, CCAGCACCACTAAGCGTAAAT; PER1-III:CCATGGACATGTCCACCTATA) were selected. Then using the design principles for RNA interference [28], three pairs of shRNA plasmids targeting PER1(PER1-shRNA-I, PER1-shRNA-II and PER1-shRNA-III) were designed and synthesized by Shanghai Genechem Co. Ltd (Table 2). We then separately inserted each of the shRNAs into a PLKO.1 lentiviral vector, after which the vector was linearized using AgeI and EcoRI (NEB, USA). The linearized vector fragments along with double stranded DNA fragments and vector fragments were collected and combined using T4 DNA Ligase. The scramble shRNA 5'-CCTAAGGTTAAGTCGCCCTCGCTCGAGCGAGGGCGACTTAACCTTAGG-3' (Sigma-Aldrich, St. Louis, MO), which had no interference effects on any genes, served as the control. The recombinant vector plasmids were then transformed into freshly prepared Escherichia coli DH5α cells (Sangon Biotech, China). Bacterial colonies were then selected in LB medium with Amp antibiotic and cultured for 14 h at 37°C. Plasmids were extracted using a QIAGEN Plasmid Midi Kit (Qiagen, Germany), and the results of DNA sequencing were analyzed using Chromas v2.1(Technelysium, Australia).
Table 2: Sequences of PER1-shRNAs
Sense strand |
Antisense strand |
|
|---|---|---|
PER1-shRNA-I |
5'-CCGGCAGCACCACTAAGCGTAAATGC TCGAGCATTTACGCTTAG TGGTGCTGTTTTTG-3' |
5'-AATTCAAAAACAGCACCACTAAGCGTAAA TGCTCGAGCATTTACGCTTAGTGGTGCTG-3' |
PER1-shRNA-II |
5'-CCGGCCAGCACCACTAAGCGTAAATC TCGAGATTTACGCTTAG TGGTGCTGGTTTTTG-3' |
5'-AATTCAAAAACCAGCACCACTAAGCGTAAATC TCGAGATTTACGCT TAGTGGTGCTGG-3' |
PER1-shRNA-III |
5'-CCGGCCATGGACATGTCCACCTATAC TCGAGTATAGGTGGACATG TCCATGGTTTTTG-3' |
5'-AATTCAAAAACCATGGACATGTCCACCTAT ACTCGAGTATAGG TGGACATGTCCATGG-3' |
Lentivirus PER1-shRNA plasmid packing
Lentiviral PER1-shRNA-I-III and scramble plasmids (8 μg) were transfected into 70-80% confluent 293T cells (Life Sciences Institute of Chongqing Medical University, China) using 20 μl of Lipofectamine 2000 (Invitrogen, USA). After incubation for 24 h, the cells were lysed and centrifuged, and four different plasmid lentiviruses were collected in the supernatant. The plasmids were then filtered through 0.45 μm cellulose acetate filters and at -80°C for later use.
Cell transfection
SCC15 cells (Life Sciences Institute of Chongqing Medical University, China) were routinely cultured in DMEM/F12 supplemented with 10% fetal bovine serum (FBS), 100 U/mL penicillin and 100 μg/mL streptomycin in a humidified incubator at 37°C under an atmosphere of 5% CO2. During logarithmic growth, cells were seeded into 4 ml of medium containing 10% FBS. Thereafter 1 ml of medium containing the lentivirus vectors was added. After incubation for 24 h, stably transfected cells were selected in puromycin-containing medium (2 μg/ml), which was refreshed every other day. The transfectants was divided into 5 groups: three experimental groups expressing PER1-shRNA-I, -II or -III, a Control-shRNA group expressing scramble shRNA, and an untreated SCC15 cell group (blank control group).
Quantitative real-time PCR assay (qRT-PCR)
qRT-PCR was performed according to the manufacturer’s instructions (TaKaRa, Japan). Briefly, total RNA was extracted from cells using RNAiso Plus (Takara, Japan), after which the RNA concentration and quality was determined using a UV/Visible spectrophotometer (AmershamBiosciences, Sweden) to measure absorbance at 260 nm and 280 nm. The RNA was then reverse transcribed to cDNA synthesis using a PrimeScript RT reagent Kit according to the manufacturers (Takara, Japan) instructions. For qRT-PCR, the primers for PER1, KI-67, MDM2, C-MYC, p53, BAX, BCL-2, MMP2, MMP9, TIMP-2 and VEGF were designed using Oligo17.0 software and are listed in Table 3. β-actin served as a normalization control. The reaction mixture for qPCR contained 12.5 μl of 2×SYBR Premix Ex TaqTMII, 2 μl of cDNA template, 1μl of 0.4 μM forward and reverse primers and double distilled H2O in a total volume of 25 μl. qPCR was performed using a C-1000TM Thermal Cycler (Bio-Rad, USA). The PCR protocol entailed 1 cycle at 95°C for 1.5 min and 40 cycles of 10 s at 95°C and 30s at 60°C. The cycle threshold (Ct) values were determined and normalized against the expression of β-actin in each sample, and the data were analyzed using the2-ΔΔCt method. The assays were done in triplicate.
Table 3: Primer sequences used for quantitative real-time PCR
Gene |
Forward primer sequence (5'-3') |
Reverse primer sequence (5'-3') |
|---|---|---|
PER1 |
CTGCTACAGGCACGTTCAAG |
CTCAGGGACCAAGGCTAGTG |
KI-67 |
TAACACCATCAGCAGGCAAA |
GCAGGTCCAGTTTCTCCACT |
MDM2 |
TCTGAAAGCACCAGCACTTG |
TACTGAACACGCCTCCCATC |
C-MYC |
CGGAACTCTTGTGCGTAAGG |
GGTTGTGAGGTTGCATTTGA |
p53 |
TAGTGTGGTGGTGCCCTATG |
CCAGTGTGATGATGGTGAGG |
BAX |
ATGGGCTGGACATTGGAC |
GGGACATCAGTCGCTTCAGT |
BCL-2 |
CAACACAGACCCACCCAGA |
TGGCTTCATACCACAGGTTTC |
MMP2 |
AGTTTCCATTCCGCTTCCAG |
CGGTCGTAGTCCTCAGTGGT |
MMP9 |
ACTACTGTGCCTTTGAGTCC |
AGAATCGCCAGTACTTCCCA |
TIMP-2 |
AGGCTTAGTGTTCCCTCCCT |
TGTCACCAAAGCCACCTACC |
VEGF |
GGCAAAGTGAGTGACCTGCT |
CGGTGTCTGTCTGTCTGTCC |
β-actin |
AGCGAGCATCCCCCAAAGTT |
GGGCACGAAGGCTCATCATT |
Western blot analysis
Cells were lysed in RIPA buffer [50 mmol/L Tris-HCl (pH 7.4), 150 mmol/L NaCl, 0.5% NP-40] for 30 min at 0°C and centrifuged for 15 min (12000 rpm, 4°C). Protein expression was quantified using a BCA Protein Assay Kit according to the manufacturer's instructions (Beyotime, China). The lysates (50 mg protein) were subjected to SDS-PAGE, after which the proteins were transferred to polyvinylidene fluoride (PVDF) membranes (Millipore, USA), which were then blocked with Tris-buffered saline (TBS)-Tween containing 5% non-fat dried milk for 2 h. The membranes were then probed with rabbit polyclonal anti-hPER1 antibody (1:1000, Genetex, USA) and mouse monoclonal anti-hGAPDH antibody (1:3000, Zhongshan Golden-Bridge Biotechnology, China) overnight at 4°C, followed by horseradish peroxidase-conjugated goat anti-rabbit IgG (1:5000, Zhongshan Golden-Bridge Biotechnology, China) at 37°C for 1 h. The precipitated proteins were washed three times in PBS, and an ECL-advance Western Blot Detection System (ChemiDocXRS+, Bio-Rad, USA) was used for detection and photography. The assays were done in triplicate.
Cell counting Kit-8(CCK-8) assay
PER1 mRNA and protein was knocked down most efficiently in PER1-shRNA-I cells, which were used for the following experiments. PER1-shRNA-I, Control-shRNA and untreated SCC15 cells were seeded into 96 well plates to a density of 1000 cells/well and then counted every 24 h for 5 days. Medium containing 10% FBS with no cells served as an internal reference. On the day of assays, the cells were fed with 100 μl of fresh medium along with 10 μl of CCK-8 (Dojindo, Japan) solution and incubated at 37°C for 1 h. Cell growth was measured based on the absorbance at 450 nm using a microplate reader (BioTek, USA). The assays were done in triplicate to ensure the accuracy of the data.
Colony formation assay
Approximately 100 cells collected during the logarithmic growth phase were seeded into each well of 6-well plates. The medium was replaced every other day. Cells were fixed with methanol and stained with 0.1% crystal violet after 12 days, then washed with deionized water. Colonies containing over 50 cells were counted manually (200×) under a microscope (Olympus, Japan). The colony formation rate was expressed as the percentage of colonies per numbers of inoculated cells. The experiments were repeated three times to obtain the average colony formation rate.
Flow cytometric apoptosis assay
Cells in logarithmic growth phase were harvested by trypsinization and centrifuged for 5 min (1000 rpm, 4°C), after which the supernatant was discarded and the cell pellets were washed twice with PBS and resuspended in DMED/F12 medium at a density of 1×10⁶/ml. Aliquots of suspension (1 ml) were centrifuged for 5 min. The cell pellets were then incubated with 200 μl of AnnexinV-FITC reagent for 15 min at 22°C, and then stained with 1 ml of propidium iodide solution for 5 min at 4°C in the dark. Apoptosis was analyzed using FACSVantage flow cytometry (BD, USA). The following formula was used to calculate the tumor cells apoptotic index (AI): AI = (number of apoptotic cells/total number of cells)×100%. Each experiment was carried out in triplicate.
Cell migration assay
Transwell chambers (Corning, USA) were divided into upper and lower chambers by an 8-μm-pore polycarbonate membrane. After addition of 1.0×10³ cells serum-free DMEM/F12 medium to the upper chamber and medium containing 10% FBS to the lower chamber, the chambers were incubated for 24 h at 37°C under 5% CO2. The medium was then aspirated from the inside of the insert, and the non-migrated cells on the upper side of the membrane were removed using a cotton swab. The membrane was fixed then with methanol for 20 min and stained with 0.1% crystal violet for 15 min. Cells that had migrated to the lower surface of the membrane were counted in 10 random microscope fields (200×) and photographed. The values reported here are the averages of triplicate experiments.
Cell invasion assay
The experiment procedures were roughly the same as for the cell migration assay described above, except the upper surface of a polycarbonate membrane was coated with 60 μl of Matrigel (BD, USA).
In vivo tumorigenesis assay
Ten specific pathogen-free (SPF) BALB/c nu/nu nude mice (female, 4-6 weeks old, 18-22 g) were purchased from the Experimental Animal Center of the Chongqing Medical University and divided into two groups: PER1-shRNA-I and SCC15. The mice in the corresponding groups were then subcutaneously injected into the right back with 0.2 ml of PBS containing 1×10⁶ PER1-shRNA-I or SCC15 cells. Three weeks later, noticeable tumors were present, and the mice were sacrificed by cervical dislocation. The tumors were immediately excised, washed with PBS, dried on filter paper and weighed using a precise balance (AA250, Denver Instrument, USA). Tumor size was measured using a caliper, and tumor volume was calculated using the formula V=0.5×L×W2, where V is the volume, L is the length, and W is the width. The tumors were then fixed in 4% paraformaldehyde, embedded in paraffin blocks, and cut into 4-μm slices. Routine HE staining was then performed, and the sections were observed under an optical microscope (200×). This experiment was conducted in strict accordance with the recommendations in the Guide for the Care and Use of Laboratory Animals of the Chongqing Medical University. All animal experimental protocols were approved by the Ethics Committee of Chongqing Medical University (Permit Number: CQMU 2011-28).
Statistical analysis
All statistical analyses were performed using SPSS 17.0 software (IBM Corporation, USA). Data are expressed as the mean±SD. Comparisons between multiple groups were made using one-way analysis of variance (ANOVA). Comparisons between two groups were made using the least significant difference (LSD) test. Student’s t-test was used to analyze differences between two groups of tumorigenesis assay. Values of p<0.05 were considered statistically significant.
ACKNOWLEDGMENTS
We thank H. Ye, X. M. Tan for their technical and statistical assistance. We also thank X. L. SU, who volunteered her time to participate in some experiments.
CONFLICTS OF INTEREST
The authors declare no conflict of interest in the work presented.
REFERENCES
1. Eismann EA, Lush E, Sephton SE. Circadian effects in cancer-relevant psychoneuroendocrineand immune pathways. Psychoneuroendocrinology. 2010; 35:963-76.
2. Greene MW. Circadian rhythms and tumor growth. Cancer Lett. 2012; 318:115-23.
3. Zieker D, Jenne I, Koenigstrainer I, Zdichavsky M, Nieselt K, Buck K, Zieker J, Beckert S, Glatzle J, Spanagel R, Koenigstrainer A, Northoff H, Loeffler M. Circadian expression of clock-and tumor suppressor genes in human oral mucosa. Cell Physiol Biochem. 2010; 26:155-166.
4. Zheng B, Albrecht U, Kaasik K, Sage M, Lu W, Vaishnav S, Li Q, Sun ZS, Eichele G, Bradley A, Lee CC. Nonredundant Roles of the mPer1 and mPer2 Genes in the Mammalian Circadian Clock. Cell. 2001; 105:683-94.
5. Rohling JH, vanderLeest HT, Michel S, Vansteensel MJ, Meijer JH. Phase Resetting of the Mammalian Circadian Clock Relies on a Rapid Shift of a Small Population of Pacemaker Neurons. PLoS One. 2011; 6:e25437.
6. Yang X, Wood PA, Ansell CM, Quiton DF, Oh EY, Du-Quiton J, Hrushesky WJ. The circadian clock gene Perl suppresses cancer cell proliferation and tumor growth at specific Times of day. Chronobiol Int. 2009; 26:1323-1339.
7. Cao Q, Gery S, Dashti A, Yin D, Zhou Y, Gu J, Koeffler HP. A Role for the Clock Gene Per1 in Prostate Cancer. Cancer Res. 2009; 69:7619-25.
8. King DP, Zhao Y, Sangoram AM, Wilsbacher LD, Tanaka M, Antoch MP, Steeves TD, Vitaterna MH, Kornhauser JM, Lowrey PL, Turek FW, Takahashi JS. Positional cloning of the mouse circadian clock gene. Cell. 1997; 89:641-53.
9. Zhao N, Yang K, Yang G, Chen D, Tang H, Zhao D, Zhao C. Aberrant Expression of Clock Gene Period1 and Its Correlations with the Growth, Proliferation and Metastasis of Buccal Squamous Cell Carcinoma. PLoS ONE. 2013; 8:e55894.
10. YeH, Yang K, Tan XM, Fu XJ, Li HX. Daily rhythm variations of the clock genePER1 and cancer-related genes during various stages of carcinogenesis in a golden hamster model ofbuccal mucosa carcinoma. OncoTargets and Therapy. 2015, 8:1419-26.
11. Panda S, Antoch MP, Miller BH, Su AI, Schook AB, Straume M, Schultz PG, Kay SA, Takahashi JS, Hogenesch JB. Coordinated transcription of key pathways in the mouse by the circadian clock. Cell. 2002; 109:307-20.
12. Storch KF, Lipan O, Leykin I, Viswanathan N, Davis FC, Wong WH, Weitz CJ. Extensive and divergent circadian gene expression in liver and heart. Nature. 2002; 417:78-83.
13. Grundschober C, Delaunay F, Pühlhofer A, Triqueneaux G, Laudet V, Bartfai T, Nef P. Circadian regulation of diverse gene products revealed by mRNA expression profiling of synchronized fibroblasts. J Biol Chem. 2001; 276:46751-8.
14. Hsu CM, Lin SF, Lu CT, Lin PM, Yang MY. Alteredexpressionofcircadian clockgenesinhead and necksquamous cell carcinoma. Tumour Biol. 2012; 33:149-55.
15. Gery S, Komatsu N, Kawamata N, Miller CW, Desmond J, Virk RK, Marchevsky A, Mckenna R, Taguchi H, Koeffler HP. Epigenetic silencing of the candidate tumor suppressor gene Per1 in non-small cell lung cancer. Clin Cancer Res. 2007; 13:1399-404.
16. Nernpermpisooth N, Qiu S, Mintz JD, Suvitayavat W, Thirawarapan S, Rudic DR, Fulton DJ, Stepp DW. Obesity alters the peripheral circadian clock in the aorta and microcirculation. Microcirculation. 2015; 22:257-66.
17. Pinho M, Sehmbi M, Cudney LE, Kauer-Sant'anna M, Magalhães PV, ReinaresM, Bonnin CM, Sassi RB, Kapczinski F, Colom F, Vieta E, Frey BN, Rosa AR. The association between biological rhythms, depression, and functioning in bipolar disorder: a large multi-center study. Acta Psychiatr Scand. 2015 May 22. doi: 10.1111/acps.12442.
18. Bae K, Jin X, Maywood ES, Hastings MH, Reppert SM, Weaver DR. Differential functions of mPer1, mPer2, and mPer3 in the SCN circadian clock. Neuron. 2001; 30:525-36.
19. Chen R, Yang K, Zhao NB, Zhao D, Chen D, Zhao CR, Tang H. Abnormal expression of PER1 circadian-clock gene in oral squamous cell carcinoma. Onco Targets Ther, 2012; 5:403-407.
20. Gery S, Komatsu N, Baldjyan L, Yu A, Koo D, Koeffler HP. The circadian gene per1 plays an important role in cell growth and DNA damage control in human cancer cells. Mol Cell. 2006; 22:375-82.
21. Sato F, Nagata C, Liu Y, Suzuki T, Kondo J, Morohashi S, Imaizumi T, Kato Y, Kijima H. PERIOD1 is an anti-apoptotic factor in human pancreatic and hepatic cancer cells. J Biochem. 2009; 146:833-838.
22. Granda TG, Liu XH, Smaaland R, Cermakian N, Filipski E, Sassoneé-Corsi P, Lévi F. Circadian regulation of cell cycle and apoptosis proteins in mouse bone marrow and tumor. FASEB J, 2005; 19:304-6.
23. Koyanagi S, Kuramoto Y, Nakagawa H, Aramaki H, Ohdo S, Soeda S, Shimeno H. A molecular mechanism regulating circadian expression of vascular endothelial growth factor in tumor cells. Cancer Res. 2003; 63:7277-83.
24. Zhanfeng N, Yanhui L, Zhou F, Shaocai H, Guangxing L, Hechun X. Circadian genes Per1 and Per2 increase radiosensitivity of glioma in vivo. Oncotarget. 2015; 6:9951-8. doi: 10.18632/oncotarget.3179.
25. Fu L, Pelicano H, Liu J, Huang P, Lee C. The Circadian Gene Period2 Plays an Important Role in Tumor Suppression and DNA Damage Response In Vivo. Cell. 2002; 111:41-50.
26. Bjarnason GA, Jordan RC, Sothern RB. Circadianvariationin the expressionofcell-cycleproteins inhumanoralepithelium. Am J Pathol. 1999; 154:613-22.
27. Dai Y, Xia W, Song T, Su X, Li J, Li S, Chen Y, Wang W, Ding H, Liu X, Li H, Zhao Q, Shao N. MicroRNA-200b is overexpressed in endometrial adenocarcinomas and enhances MMP2 activity by downregulating TIMP2 in human endometrial cancer cell line HEC-1A cells. Nucleic Acid Ther. 2013; 23:29-34.
28. Reynolds A, Leake D, Boese Q, Scaringe S, Marshall WS, Khvorova A. Rational siRNA design for RNA interference. Nat Biotechnol, 2004; 22:326-30.