
Introduction
Aflatoxins, a group of mutagenic compounds and a contaminant of many food sources, especially in some parts of Africa, Asia and Latin America. The naturally occurring aflatoxins are aflatoxin B1, B2, G1 and G2 (AFB1, AFB2, AFG1 and AFG2), in which AFB1 is the most abundant, toxic and carcinogenic [1-3]. Williams et al. [4] have estimated that 4.5 billion of the world’s population is exposed to aflatoxins. In animals, these toxins also impair growth and are immunosuppressive. The latter effect is of increasing interest in human populations, because an increased tumors incidence probably is resulted from the poor immunity of the host [5, 6].
Secondary to the effect on liver, the immunosuppressive nature of AFB1 is the best documented area of its toxicity [7], but there are few studies on the relationship of aflatoxins and immunity in human. Previous researches showed that dietary AFB1 could decrease secretory IgA (sIgA) in saliva production, antibody response, percentage of CD3+, CD4+, CD8+, and CD19+ lymphocytes, and level of cytokines in peripheral blood in human [8-10]. In livestock and laboratory animals, the negative effects associated with AFB1 exposure on immune system include the decrease of relative weight of immune organs, T-cell subsets, cytokines, antibody titers, complement activity, and the increase incidence of lymphoid tissues injury [11-14]. Furthermore, several studies suggested that AFB1 treatment could induce oxidative stress, cell cycle arrest, excessive apoptosis, and mitochondria injury in lymphoid tissues [15-18]. These findings indicated that the injuries of immune organs might play critical roles in immunosuppression induced by AFB1 administration, but its mechanisms need to be further clarified.
Recently, it is well accepted that apoptosis in immunocytes is important for immunosuppressive function in human and various animal species in vivo and in vitro [19-24]. Chen et al. [17] showed that oxidative stress and apoptosis play key roles in AFB1 induced toxicity of immune organs. As we know that the mitochondria, death receptor, and endoplasmic reticulum mediated apoptotic pathways are the three key pathways in apoptosis [25]. However, the exact mechanism of AFB1 induced thymus apoptosis has not been elucidated. To address this, we use a broiler model to examine the roles of mitochondria, death receptors, and endoplasmic reticulum pathways in AFB1 induced toxicity of thymocytes. We analyzed the histological and ultra-structural changes of thymus, T cell subsets, mitochondrial membrane potential, percentage of apoptotic thymocytes, and relative expression of apoptosis-regulating genes. Taken together, our data reveal that the mitochondrial and death receptor pathways are involved in AFB1 induced thymocytes apoptosis.
Results
Histopathological and ultrastructural analysis
In the control group, the morphology of the epithelial reticular cells was clear in the contex and medulla, and there were no obvious histopathological changes in the thymus (Figure 1A, 1C). When compared with the control group, congestion, degenerated reticulocytes and increased nuclear debris were observed in the AFB1 group. The congestion showed as relatively increased capillaries and expanded vessels containing many blood cells, the degenerated reticulocytes had unclear nuclear shape and were surrounded by more debris (Figure 1B, 1D). The incidence of congestion in medulla and increased nuclear fragmentation of thymus was showed in Table 2.
The ultrastructure of the thymus in the control broilers appeared normal (Figure 1E). In the AFB1 group, the mitochondria of some lymphocytes enlarged and contained fewer cristae, which was an indicative of mitochondrial swelling (Figure1F). The apoptotic thymocytes could be found easily, and the hyper-condensed chromatin of apoptotic cells was under the plasma membrane, or was seen as multiple electron-dense nuclear fragments in the shape of crescent or petal (Figure 1F).
Table 1: A list of oligonucleotides used as primers in qRT-PCR analysis of gene expression in chicken thymocytes
Gene symbol |
RefSeq mRNA number |
Forward primers |
Reverse primers |
Amplicon length (bp) |
GSH-Px |
NM001277853 |
TTGTAAACATCAGGGGCAAA |
TGGGCCAAGATCTTTCTGTAA |
140 |
CuZn-SOD |
NM205064 |
CGCAGGTGCTCACTTTAATCC |
CTATTTCTACTTCTGCCACTCCTCC |
119 |
Mn-SOD |
NM204211 |
CACTCTTCCTGACCTGCCTTACG |
TTGCCAGCGCCTCTTTGTATT |
146 |
GR |
GQ853055 |
CTGTGGCAAAGCCCTCCTGA |
ATGGGTGGGTGGCTGAAGAC |
135 |
CAT |
NM001031215 |
CTGTTGCTGGAGAATCTGGGTC |
TGGCTATGGATGAAGGATGGAA |
160 |
Bcl-2 |
NM_205339 |
TGTTTCTCAAACCAGACACCAA |
CAGTAGGCACCTGTGAGATCG |
205 |
Bcl-xl |
NM_001025304 |
GAGGTACCGGAGGGCTTTCA |
CAAAGCTCTGGTACGCCGTG |
74 |
Bak-1 |
NM_001030920 |
CTGTTCGCTTCCTTCCCCTG |
TTGCAGAGATGCTGTGGGAC |
167 |
Bax |
XM_422067 |
GGTGACAGGGATCGTCACAG |
TAGGCCAGGAACAGGGTGAA |
108 |
Cyt c |
K02303.1 |
AGGCAAGCACAAGACTGGA |
CTGACTATCACCAAGAACCACC |
150 |
Apaf-1 |
XM_416167 |
ACCTTTCCCGTCTGGTTGTTC |
AGCAATCTCTCTCCGCTTTCT |
139 |
Casp-9 |
AY057940 |
CCAACCTGAGAGTGAGCGATT |
GTACACCAGTCTGTGGGTCGG |
87 |
AIFM1 |
NM_001007490 |
CTGGGTCCTGATGTGGGCTAT |
TGTCCCTGACTGCTCTGTTGC |
123 |
Casp-3 |
NM_204725 |
TGGCCCTCTTGAACTGAAAG |
TCCACTGTCTGCTTCAATACC |
139 |
Fas |
NM_001199487 |
TCCACCTGCTCCTCGTCATT |
GTGCAGTGTGTGTGGGAACT |
78 |
FasL |
NM_001031559 |
GGCATTCAGTACCGTGACCA |
CCGGAAGAGCACATTGGAGT |
78 |
FADD |
XM_421073 |
GGGGTAAAGAGGCTGAACTCTTA |
TGAGTCCTATTGCACTGCTGTC |
163 |
Casp-8 |
NM_204592 |
GTCTCCGTTCAGGTATCTGCT |
TCTCAATGAAAACGTCCGGC |
143 |
Casp-10 |
XM_421936 |
CTGGGGGCTCCAAAAGTCC |
AAAGGGGGACAAAGCCAACA |
204 |
Bid |
NM_204552 |
GAGCAGCTTGCTGGAGAGAA |
GAGGCAGCTGGATCACAAGT |
187 |
Grp78 |
NM_205491 |
GGTGTTGCTTGATGTGTGTCC |
GCTGATTGTCAGAAGCTGTGG |
134 |
Grp94 |
NM_204289 |
TGACCTGGATGCAAAGGTGGA |
TTAAACCCCACACCATCCCTCAAC |
250 |
CaM |
NM_205005 |
GGAGTTGGTAAAATGAGGGAACA |
ACATTGTGGACGATTGACAGTCT |
233 |
β-actin |
L08165 |
TGCTGTGTTCCCATCTATCG |
TTGGTGACAATACCGTGTTCA |
178 |
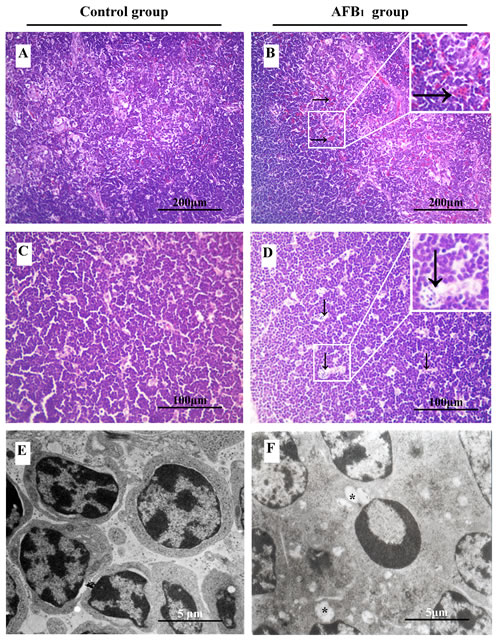
Figure 1: The impact of aflatoxin B1 exposure on thymus histopathology (congestion and nuclear debris) and ultra-structural pathology (mitochondria vacuole and chromatin margination). Histological assessment of H&E-stained thymus tissues from 21-day-old broilers exposed to AFB1 diet B. and D. and control diet A. and C.. Congestion in thymic medulla ↓., D. and increased number of nuclear debris →., B.. Ultrastructural assessment of uranyl acetate and lead citrate stained thymus sections from the control E. and AFB1 group F.. Vacuolated mitochondria with degenerated cristae (*, F), and chromatin margination in lymphocytes.
TUNEL assay and flow cytometry analysis of apoptotic thymocytes
The TUNEL-positive cells were mainly around reticulocytes in cortex or around Hassall’s corpuscles in medulla (Figure 2C, 2D). The apoptotic thymocytes were stained brown (Figure 2C, 2D) or with green fluorescence staining (Figure 2A, 2B). The apoptotic thymocytes in the AFB1 group (Figure 2B, 2D) were increased when compared with those of the control group (Figure 2A, 2C) at 7, 14 and 21 days of age. The statistical results are shown in Figure 2G.
Annexin-V-FITC was used to determine the percentage of cells undergoing apoptosis. Apoptotic cells were examined by counting the total percentage of early apoptotic cells (Annexin-V positive and PI negative) and late apoptotic cells (both Annexin-V and PI positive). The results of FCM analysis revealed similar trend as TUNEL. The percentage of apoptotic thymocytes in the AFB1 group (Figure 2F) was significantly higher (p < 0.05 or p < 0.01) than that in the control group (Figure 2E), and the statistical results are shown in Figure 2G at 7, 14 and 21 days of age.
Table 2: Incidence of major histological lesions of thymus.
Pathological Lesions |
Time |
Control group |
AFB1 group |
Congestion in red pulp |
7 days |
0/6 |
2/6 |
14 days |
0/6 |
4/6 |
|
21 days |
0/6 |
5/6 |
|
Nuclear fragmentation increased |
7 days |
0/6 |
1/6 |
14 days |
0/6 |
3/6 |
|
21 days |
0/6 |
5/6 |
Incidence of lesions in the thymus among animals from different experimental groups (n=6)
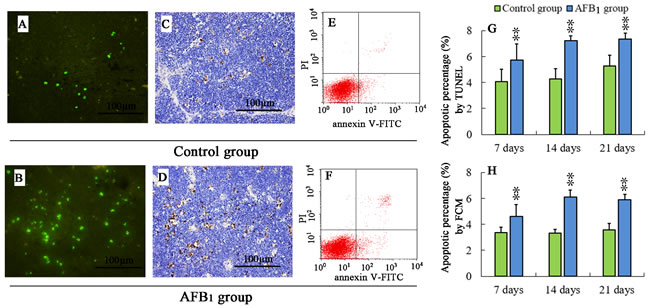
Figure 2: Percentage of apoptotic thymocytes from the broilers exposed to the control and AFB1 diets. TUNEL stained slices of the thymuses from 21-day-old broilers in the control A., C. and AFB1 group B., D.. The nuclei of apoptotic cells were with green fluorescence (stained with FITC fluorescein-dUTP), or brown (stained with diaminobenzidine). Image E and F are representatives of the apoptosis by FCM. Bar graph G. and H. indicate the mean with standard deviation, and are representatives of apoptosis rate by TUNEL and FCM (*p < 0.05, **p < 0.01 vs control), six birds per group.
Changes of thymic T-cell subsets
At 7, 14 and 21 days of age, compared to the control group, the percentages of CD3+ and CD3+CD8+ T cells were significantly decreased (p < 0.05 or p < 0.01) in the AFB1 group, and significantly decreased (p < 0.01) percentage of CD3+CD4+ T cells was observed in the AFB1 group at 14 and 21 days of age. The results are shown in Figure 3.
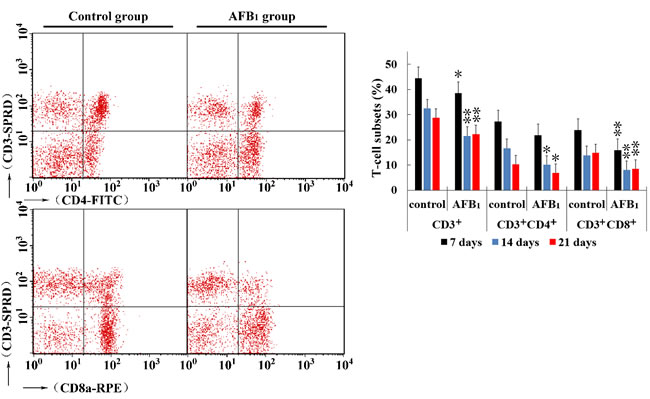
Figure 3: Percentages of CD3+, CD3+CD4+ and CD3+CD8+ T-cell in thymus from the broilers exposed to the control and AFB1 diets. The average measured percentages of CD3+, CD3+CD4+ and CD3+CD8+ T lymphocytes with representative scatter diagram of the T lymphocyte subsets detected by FCM. Bar graph indicates the mean with standard deviation, and are representatives of the percentages of CD3+, CD3+CD4+ and CD3+CD8+ T lymphocytes of thymus (*p < 0.05, **p < 0.01 vs control), six birds per group.
Changes of ∆ψm
Apoptosis is frequently associated with depolarization of mitochondrial membrane potential (∆ψm), resulting in increased numbers of cells with reduced JC-1 fluorescence in the FL-2 channel. That is, the apoptotic population frequently presents a lower red fluorescence signal intensity. The number of cells with lower red fluorescence in the AFB1 group was higher than that in the control group. The results suggested that the percentage of thymocytes depolarized with collapse of the ∆ψm was increased (p < 0.01) significantly at 7, 14 and 21 days of age.
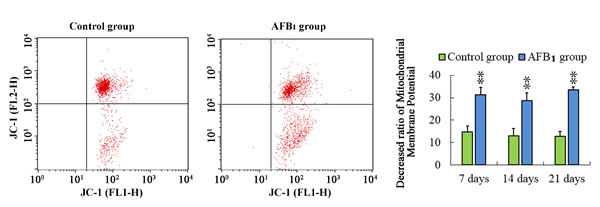
Figure 4: Determining mitochondrial membrane potential in thymus from the broilers exposed to the control and AFB1 diets. Assessment of mitochondrial membrane potential in thymus from the control A. and AFB1 B. exposed broilers with Assessment of mitochondrial membrane potential of thymocytes with JC-1 staining by flow cytometry method. Bar graph indicates the mean with standard deviation, and are representatives of the percentage of thymocytes with lowered red fluorescence (*p < 0.05, **p < 0.01 vs control), six birds per group.
qRT-PCR analysis of relative expressions of apoptosis- and antioxidative-related genes
At 7, 14 and 21 days of age, compared with the control group, the increased (p < 0.05 or p < 0.01) expressions of Bak-1, Bax, Apaf-1, caspase-3, caspase-8 and FasL were observed in the AFB1 group, and the mRNA level of caspase-10 increased obviously at 7 and 14 days of age. Moreover, the mRNA contents of CytC, caspase-9, Fas and Bid were significantly increased (p < 0.05 or p < 0.01) at 14 and 21 days of age. However, the expressions of Akt and Bcl-2 were significantly down-regulated at 14 and 21 days of age. What’s more, the mRNA content of Bcl-xL was significantly lower than those in the control group at 7, 14 and 21 days of age. There were no significant changes observed in the expressions of AIF, Grp78, Grp94, and CaM. The results were shown in Figure 5.
Comparing with those of the control group, the expressions of glutathione reductase (GR), CuZn-superoxide dismutase (CuZn-SOD), Mn-superoxide dismutase (Mn-SOD) and catalase (CAT) were significantly decreased (p < 0.05 or p < 0.01) in the AFB1 group at 7, 14 and 21days of age. What’s more, the mRNA contents of glutathione peroxidase (GSH-Px) were significantly lower at 21 days of age than that in the control group. (Figure 6)
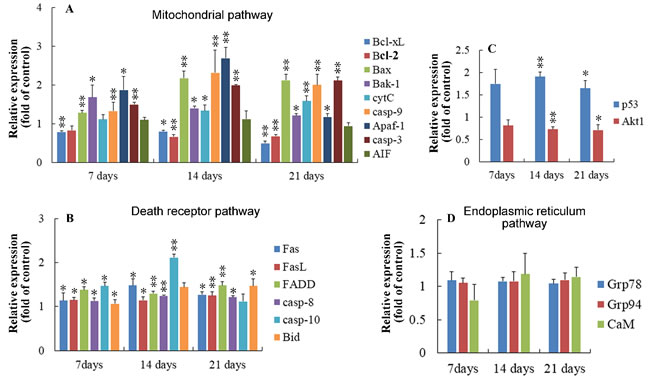
Figure 5: Relative expression of genes regulating apoptosis in thymus from the broilers exposed to the control and AFB1 diets. A. In the mitochondrial pathway, the mRNA expressions of Bcl-xL, Bcl-2, Bax, BAak-1, cytC, casp-9, Apaf-1, casp-3 and AIF in the thymocytes of the AFB1-fed broilers are expressed as fold change relative to the control-fed broilers. B. In the death-receptor pathway, the mRNA levels of Fas, FasL, FADD, casp-8, casp-10 and Bid in the thymocytes of the AFB1-fed broilers are expressed as fold change relative to the control-fed broilers. C. The mRNA expressions of p53 and Akt1 in the thymocytes of the AFB1-fed broilers are expressed as fold change relative to the control-fed broilers. D. In the endoplasmic reticulum pathway, the mRNA expression of GRP78, GRP94 and CaM have no obvious changes compared to the control-fed broilers. All data are expressed as the mean value with deviation. *p < 0.05, *p < 0.01 vs control, n = 6 for each group.
Antioxidation biochemistry analysis parameters
At 7, 14 and 21 days of age, the activities of SOD, CAT, GSH-Px and GR were significantly lower (p < 0.01 or p < 0.05) than those in the control group. Comparing to the control group, the decreased (p < 0.05 or p < 001) contents of GSH and increased (p < 0.05 or p < 0.01) contents of malonic dialdehyde (MDA) were observed in the AFB1 group at 7, 14 and 21 days of age. Meanwhile, the total ant-oxidative capacity (T-AOC) was significantly decreased (p < 0.01) in the AFB1 group at 14 and 21 days of age. The results are shown in Figure 6.
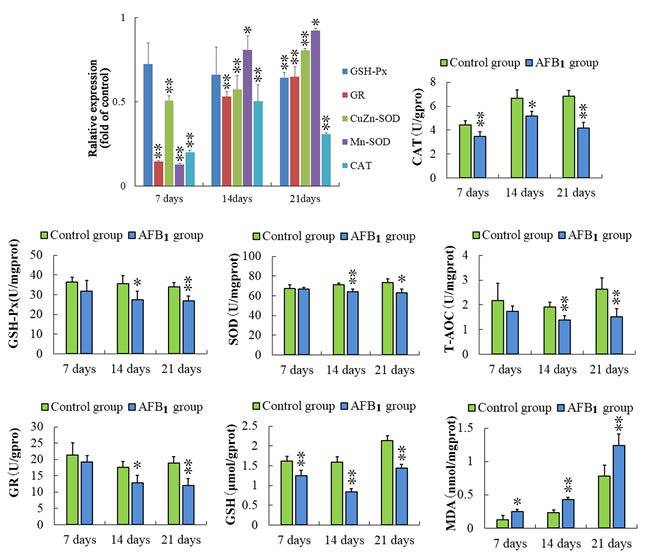
Figure 6: Assessment of the antioxidant function in thymus from the broilers exposed to the control and AFB1 diets. The mRNA expressions of GSH-Px, GR, CuZn-SOD, Mn-SOD, and CAT in the thymocytes of the AFB1-fed broilers are expressed as fold change relative to the control-fed broilers. Others bar graph indicate the mean with standard deviation, and are representatives of the enzymatic activities of GSH-Px, GR, CuZn-SOD, Mn-SOD, CAT and T-AOC, and the contents of GSH and MDA (*p < 0.05, **p < 0.01 vs control), six birds per group.
Discussion
AFB1 exhibits toxic effects in humans as well as in all animal species so far investigated [26]. Broilers are sensitive to AFB1, and a low dosage of AFB1 can induce immunosuppression, which showed as the decrease of T cell subsets, some cytokines contents, antibody titers, and complement activity [27-30]. In the present study, the toxic effects of AFB1 on thymus were investigated in chicken. As revealed by histopathological examination, T-cell subsets assay and apoptosis analysis, an obvious congestion in medulla (Figure 1B) and increase of nuclear debris in cortex (Figure 1D), significant decrease of CD3+, CD3+CD4+ and CD3+CD8+ T-cell percentages (Figure 3), and increase of apoptotic thymocytes (by flow cytometer and TUNEL essay) (Figure 2) were consistently observed in the AFB1 group, which were in line with our earlier research [31]. Our previous and present studies both demonstrated that the apoptosis of thymocytes might be closely related to AFB1-induced immunosuppression, but it should be further clarified that if mitochondria, death receptor and endoplasmic reticulum mediated apoptotic pathways were all involved in this apoptotic procedure. Our study is the first to answer this question by determining 18 key signaling molecules in the three apoptotic pathways by using a broiler model.
Apoptosis is an energy-dependent process of cell suicide in response to a variety of stimuli and is characterized by a number of distinct morphological features including cell shrinkage, plasma membrane blebbing, chromatin condensation, and ultimately, cell fragmentation into apoptotic bodies which are phagocytosed without provoking an inflammatory response [32, 33]. In the AFB1 group, the apoptotic lymphocytes with condensed chromatin could be easily found, and obvious swollen mitochondria with degenerated cristae was observed in the thymic lymphocytes. These ultrastructural changes mean that the apoptotic mechanisms maybe associated with mitochondria signaling pathway. Because depolarization of the ∆ψm was observed to occur early during mitochondria mediated apoptosis [34], we detected the changes of ∆ψm by JC-1 staining method. The result showed that the percentage of thymocytes with low red fluorescence (thymocytes with depolarized ∆ψm) was increased in the AFB1 group, suggesting that mitochondrial pathway was activated during the AFB1 induced apoptosis in thymocytes.
Based on the increase of Bax and caspase-3 mRNA expression, and the decrease of Bcl-2 mRNA expression, it has been suggested that the AFB1-induced apoptosis could be triggered through mitochondria pathway in the thymocytes, splenocytes and bursa of Fabricius cells of chicken [15], and in the hepatocytes of duckling [35]. In our study, when chickens exposed to AFB1, the decreased expressions of Bcl-2 and Bcl-xL, increased expressions of Bax, Bak, cytC, apaf-1, caspase-9 and caspase-3 confirmed that the activated mitochondrial pathway was important for AFB1 induced thymocytes’ apoptosis in chicken. The mitochondrial pathway can be regulated by the pro- and anti-apoptotic Bcl-2 family proteins, including Bax, Bak, Bcl-xL and Bcl-2 [36], as well as caspase family proteins, such as caspase-9, caspase-3, and caspase-7 et al. [37]. The down-regulation of Bcl-xL, Bcl-2 and up-regulation of Bak, Bax can induce increased permeabilization of mitochondrial outer membrane, thereby causing release of cytC, apoptosis-inducing factor (AIF), and ATP from mitochondria [38]. Subsequently, the formation of tetramer (composed of caspase-9, Apaf-1, cytC and dATP) leads Apaf-1 apoptosome to facilitate the autocatalytic activation of caspase-9 [39]. And then the activated caspase-9 in turn cleaves and activates effector caspases (caspase-3, caspase-7 et al) [40]. In addition, the down-regulated expression of Bcl-2 and Bcl-xL might trigger PI3K/Akt pathway and excessive expression of Bid [41]. Moreover, p53 could participate in apoptosis through mitochondrial pathway by up-regulating the expression of Bax and down-regulating the expression of Bcl-2 [42, 43]. Collectively, our results revealed that mitochondria mediated apoptotic pathway was involved in AFB1 induced thymocytes apoptosis.
The death receptor pathway can be induced through the activation of death receptors, such as Fas, which requires binding to the Fas ligand (FasL) [44]. And then caspase-8 is activated through the Fas associated death domain (FADD)[44]. Josse et al. [45] observed that AFB1 at a concentration of 0.05 μM could cause an higher expression of Fas in human hepatocytes. In the present study, AFB1 administration led to the increased expression of Fas, FasL, FADD, caspase-8, caspase-10, and Bid in the thymus. Our results demonstrated that the excessive thymocytes apoptosis induced by AFB1 involved the death receptor pathway. According to previous studies, caspase-8 activates not only downstream of caspase-3 and caspase-7 [46], but the Bcl-2 homology Bid, which translocates to mitochondria and blinds to Bax, enable a crosstalk to the mitochondrial apoptotic pathway [47].
The endoplasmic reticulum pathway is initiated by endoplasmic reticulum stress due to a number of factors, including cytotoxicity, and nutrient limitation [48]. Grp78 and Grp94 function as molecular chaperones and can bind to malfolded proteins and unassembled complexes [49, 50]. CaM, a highly conserved Ca2+ binding protein, is also related to endoplasmic reticulum pathway [51]. In the present study, no changes were observed in the expressions of GRP78, GRP94 and CaM in the AFB1 group when compared with those of the control group. It is evident that the endoplasmic reticulum pathway may not involve in AFB1 induced thymocytes apoptosis in this experiment. However, it is should be further clarified in the future studies if prolonged or excessive exposure of AFB1 could active this pathway in thymus.
AFB1 is bioactivated by P450 enzymes to generate AFB1exo-8,9-epoxide, which can react with DNA, forming trans-8,9-dihydro-8-(N7-guanyl)-9-hydroxyaflatoxin B1 (AFB1-N7-Gua) [52]. The DNA adducts provoke severe steric alterations in DNA that impair DNA-dependent metabolic process, including DNA replication and transcription [53]. It is well accepted that oxidative stress is an apoptosis inducer [54]. Previous studies showed that an imbalance between reactive oxygen species (ROS) and the antioxidant reserve may cause oxidative stress, which could result in DNA damage and mitochondrial lesions, and trigger apoptosis [17, 55, 56]. In the current study, the decreased activities of GSH-Px, SOD, CAT, GR, T-AOC, increased concentration of MDA, decreased content of GSH and decreased mRNA levels of antioxidant enzymes (GSH-Px, SOD, CAT and GR), were found in broilers fed with AFB1 diet (Figure 6). These results suggested that the intake of AFB1 could induce accumulation of ROS through inhibiting the production and activity of antioxidant enzymes. Clearly, our results demonstrated that oxidative stress may be a main mediator of AFB1 induced excessive apoptosis of thymocytes in chickens.
In summary, our study shows that dietary AFB1 exposure is able to induce excessive apoptosis of thymocytes in chicken by triggering mitochondrial and death receptor mediated apoptosis pathways (Figure 7). We also demonstrate that the mechanism of oxidative DNA damage is involved in the apoptosis. Future studies will focus on a deeper understanding of the mechanisms of AFB1-induced immunosuppression.
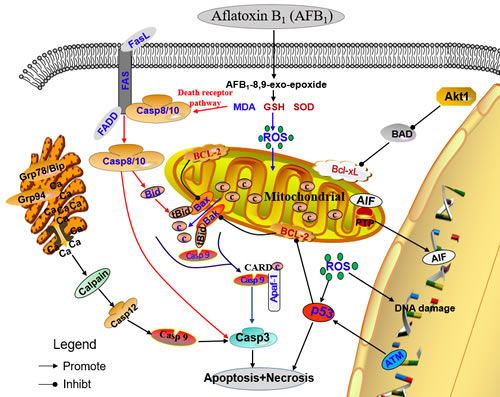
Figure 7: Schematic diagram of the proposed mechanisms of aflatoxin B1 induced apoptosis.
Materials and Methods
Investigation has been conducted in accordance with the ethical standards and according to the Declaration of Helsinki and according to national and international guidelines and has been approved by Sichuan Agricultural University Animal Care and Use Committee (Approval No: 2012-024).
Chickens and diets
One hundred and fifty-six one-day-old healthy Cobb broilers were purchased from Chia Tai Group (Wenjiang, Sichuan, China), and were randomly divided into two equal groups of three replicates and 26 birds per replicate, namely control group (0 mg/kg AFB1) and AFB1 group (0.6 mg/kg AFB1). The basal diet, namely the control diet, was formulated according to National Research Council (NRC, 1994) [57] and Chinese Feeding Standard of Chicken (NY/T33-2004) recommendations. The AFB1-contaminated diet was made, referring to the method described by Kaoud [58]. Briefly, 27 mg AFB1 (A6636, Sigma-Aldrich, USA) was dissolved into 30 ml methanol, and then the 30 ml mixture was mixed into 45 kg corn-soybean basal diet to formulate the AFB1-contaminated diet. The equivalent methanol was mixed into corn-soybean basal diet to produce the control diet. Then the methanol of diets was evaporated at 98 °F (37 °C). The AFB1 concentrations were analyzed by HPLC (Waters, Milford, MA, USA) with fluorescence detection (Waters, Model 2475, Milford, MA, USA), and the AFB1 concentration were determined as < 0.001mg/kg and 0.061mg/kg respectively in the control diet and AFB1 diet. Broilers were housed in cages with electrically heated units and provided with water as well as aforementioned diet ad libitum for 21 days.
Histopathological and ultrastructural examination
Six broilers in each group were euthanized at 7, 14 and 21 days of age. The thymuses were fixed in 4% paraformaldehyde (PFA) and routinely processed in paraffin. Thin sections (5 μm) of each tissue were sliced and mounted on glass. Slides were stained with hematoxylin and eosin Y. The histological structures of the tissues were observed and photographed with a digital camera (Nikon, eclipse 50i, Japan).
At the end of the trial, one chick per replicate in each group was euthanized and then immediately necropsied. Small pieces of thymus tissues were rapidly fixed with 2.5% glutaraldehyde and post-fixed in 2% Veronal acetate-buffered OsO4. After dehydration in graded alcohol, the tissues were embedded in Araldite. The blocks were sectioned in a microtome with a glass knife. Sections, 65-75 nm thick, were placed in uncoated copper grids. The sections were stained with uranyl acetate, and post-stained with 0.2% lead citrate. The subcellular structure of thymus was examined with a Hitachi H-600 electron microscope (Japan).
Determination of the thymic T-cell subsets
The thymuses of six birds in each group were sampled to determine the T cells subsets by flow cytometry method at 7, 14 and 21 days of age. Thymic cell suspension was prepared by gently cutting with scissors, and filtered through a 300-mesh nylon screen. Then the cells were washed and suspended in phosphate buffer (PBS, PH: 7.2) at a concentration of 1×10⁶ cells/mL. 100 µL cell suspension was transferred to another centrifuge tube, and stained with mouse anti-chicken CD3-SPRD (Cat. No: 8200-13, Southern Biotech, USA), mouse anti-chicken CD4-FITC (Cat. No: 8210-02, Southern Biotech, USA), and mouse anti-chicken CD8a-RPE (Cat. No: 8220-09, Southern Biotech, USA) for 15min at 4 ℃ in the dark. After 2 mL PBS added and centrifugal elutriation performed once, the supernatant was discarded. The cells were resuspended in 450µL PBS and determined by BD FACSCalibur flow cytometer (FCM. BD. USA).
Annexin V-FITC/PI double staining assay
The percentage of apoptotic cells was determined by flow cytometry. 5 µL of Annexin V-Fluorescein isothiocyanate (V-FITC) (BD Pharmingen, USA, 51-65874X) and 5 µL of Propidium iodide (PI) (BD Pharmingen, USA, 51-66211E) were added into 100 µL cell suspension (made in procedure T cell subsets determination), and incubated at 25 ℃ in the dark for 15 min. 450 µL of 1×Annexin binding buffer (BD Pharmingen, USA, 51-66121E) was added to the mixture, and the percentages of apoptotic cells were assayed by FCM within 1 hour.
TUNEL assay
The DNA fragmentation indicative of apoptosis was examined using terminal deoxynucleotidyl transferase-mediated dUTP nick end labeling method (TUNEL). TUNEL assay was performed using Insitu Cell Death Detection Kit (Cat. NO. 11684817910, Roche Molecular Biochemicals, Germany) according to the instructions of the manufacturer, as described by Tayman [59].
Detection of mitochondrial membrane potential (∆ψm)
JC-1 (Cat.No.551302, BD, USA) was used to determine mitochondrial membrane potential (∆ψm). A total of 1 ml cell suspension (made in procedure T cell subsets determination) was transferred into 5 mL culture tube and centrifuged. Afterwards, 0.5 mL of JC-1 working solution was immediately added and gently mixed. And then incubating the mixture for 15 min at 37 ℃ under 5% CO2 incubator. At the end of the incubations, cells were washed twice with 1× Assay Buffer cells. And then resuspended each pellet in 450 µL 1× Assay Buffer. And then ∆ψm was assayed by FCM within 30 minutes.
Quantitative real-time PCR (qRT-PCR)
At 7, 14, and 21 days of age, thymuses from six birds in each group were removed and immediately stored in liquid nitrogen. Then, thymuses were homogenized by crushing with a mortar and pestle. The powdered tissues were collected into eppendorf tubes and stored at -80°C. Total RNA was extracted from thymus using TriPure Isolation Reagent (Cat No. 11667165001, Roche Applied Science, Germany) following the procedure provided by manufacturer. The yield of extraction was assessed by measuring light absorbency at 260 nm, and the quality of RNA was detected by calculating the ratio of the absorbency at 260 and 280 nm. Extracted RNA immediately reverse-transcribed into cDNA by using Transcriptor First Strand cDNA Synthesis Kit (Cat No: 04897030001, Roche Applied Science, Germany), according to the manufacturer’s instructions. And then the cDNA was used as a template for quantitative real-time PCR analysis.
For qRT-PCR reactions, 20 µL mixtures were made by using FastStart Universal SYBR Green Master mix (Cat No: 04913914001, Roche Applied Science, Germany) containing 10 µL faststart universal SYBR green master (ROX), 0.6µL forward primer, 0.6 µL reverse primer, 6.8 µL RNAase-free water and 2 µL cDNA. Reaction conditions were set to 10 min at 95 ℃ (first segment, one cycle), 10 s at 95 ℃ and 30 s at melting temperature (Tm) of a specific primer pair (second segment, 44 cycles) followed by 10 s at 95 ℃, and 72 ℃ for 10 s (dissociation curve segment) using Thermal Cycler (Step One Plus, Applied BioSystems, USA). Gene expression was analyzed, and β-actin was used as an internal control [60, 61]. Accession number list in Table 1 was obtained from GenBank of NCBI. Primers were designed with Primer 5 and synthesized by Sangon Biotech (Shanghai, China) (Table 1). The qRT-PCR data were analyzed with 2-∆∆Ct calculation method described by Livak and Schmittgen [62].
Biochemical analysis
At 7, 14 and 21 days of age, six broilers in each group were euthanized and immediately necropsied. Then thymuses were immediately removed and put into 0 ℃ 0.85% NaCl solution. 1 g thymus was homogenized with 9 mL 0.85% NaCl solution. After the homogenates were centrifuged at 3500×g at 4 ℃, the total protein in the supernatant was determined by total protein quantification kit (A045-2). The activities of SOD (A001-1), CAT (A007), GSH-Px (A005) and GR (A062), contents of GSH (A006) and MDA (A003-2), and T-AOC (A015) in the supernatant were detected using commercial kits (NJJCBIO, Nanjing, China), according to the manufacturer’s instructions.
Statistical analysis
The significance of difference between two groups was analyzed by variance analysis, and results are expressed as the mean value with deviation. The analysis was performed using the independent sample t test of SPSS software for Mac v.20.0 (IBM Corp, Armonk, NY, USA) and a value of p < 0.05 was considered significant, while p value < 0.01 was considered markedly significant.
Acknowledgments
This work was supported by the program for Changjiang scholars and university innovative research team (IRT 0848) and the Science and Technology Department of Sichuan Province (2013FZ0072, 2012FZ0066).
Conflicts of Interest
The authors declare no competing financial interests.
References
1. Qi LN, Bai T, Chen ZS, Wu FX, Chen YY, De Xiang B, Peng T, Han ZG and Li LQ. The p53 mutation spectrum in hepatocellular carcinoma from Guangxi, China: role of chronic hepatitis B virus infection and aflatoxin B1 exposure. Liver Int. 2015; 35:999-1009.
2. Abbès S, Salah-Abbès JB, Abdel-Wahhab MA and Ouslati R. Immunotoxicological and biochemical effects of Aflatoxins in rats prevented by Tunisian Montmorillonite with reference to HSCAS. Immunopharm Immunot 2010; 32:514-522.
3. Wild CP and Gong YY. Mycotoxins and human disease: a largely ignored global health issue. Carcinogenesis. 2010; 31:71-82.
4. Williams JH, Phillips TD, Jolly PE, Stiles JK, Jolly CM and Aggarwal D. Human aflatoxicosis in developing countries: a review of toxicology, exposure, potential health consequences, and interventions. Am J Clin Nutr 2004; 80:1106-1122.
5. Prehn RT. Do tumors grow because of the immune response of the host? Immunol Rev. 1976; 28:34-42.
6. Urso P and Gengozian N. Depressed humoral immunity and increased tumor incidence in mice following in utero exposure to benzo [a] pyrene. J Toxicol Environ Health. 1980; 6:569-576.
7. Yunus AW, Razzazi-Fazeli E and Bohm J. Aflatoxin B1 in affecting broiler’s performance, immunity, and gastrointestinal tract: A review of history and contemporary issues. Toxins. 2011; 3:566-590.
8. Turner PC, Moore SE, Hall AJ, Prentice AM and Wild CP. Modification of immune function through exposure to dietary aflatoxin in Gambian children. Environ Health Perspect. 2003; 111:217.
9. Jiang Y, Jolly PE, Ellis WO, Wang JS, Phillips TD and Williams JH. Aflatoxin B1 albumin adduct levels and cellular immune status in Ghanaians. Int Immunol. 2005; 17:807-814.
10. Jiang Y, Jolly PE, Preko P, Wang J-S, Ellis WO, Phillips TD and Williams JH. Aflatoxin-related immune dysfunction in health and in human immunodeficiency virus disease. Clin Dev Immunol. 2008; 2008.
11. Weaver AC, See MT, Hansen JA, Kim YB, De Souza AL, Middleton TF and Kim SW. The use of feed additives to reduce the effects of aflatoxin and deoxynivalenol on pig growth, organ health and immune status during chronic exposure. Toxins. 2013; 5:1261-1281.
12. Hao S, Pan Sc, Hu Jf, Qian G and Huang K. Aflatoxin B1 suppressed T-cell response to anti-pig-CD3 mAb stimulation in Primary Porcine Splenocytes: a role for ERK 1/2 MAPK signaling pathway. J Agric Food Chem. 2015; 63:6094-6101.
13. Zain ME. Impact of mycotoxins on humans and animals. J Saudi Chem Soc 2011; 15:129-144.
14. Dhanasekaran D, Panneerselvam A, Thajuddin N and Shanmugapriya S. (2011). Aflatoxins and aflatoxicosis in human and animals: INTECH Open Access Publisher).
15. Peng X, Zhang K, Bai S, Ding X, Zeng Q, Yang J, Fang J and Chen K. Histological Lesions, Cell Cycle Arrest, Apoptosis and T Cell Subsets Changes of Spleen in Chicken Fed Aflatoxin-contaminated Corn. Int J Environ Res Public Health 2014; 11:8567-8580.
16. Manafi M, Murthy H and Swamy HN. Evaluation of Different Mycotoxin Binders on Aflatoxicosis in Broiler Breeders Induced with Aflatoxin B: Effects on Biochemical and Immunological Parameters. Agric & Environ 2012; 12:429-433.
17. Chen J, Chen K, Yuan S, Peng X, Fang J, Wang F, Cui H, Chen Z, Yuan J and Geng Y. Effects of aflatoxin B1 on oxidative stress markers and apoptosis of spleens in broilers. Toxicol Ind Health. 2013.
18. Bbosa GS, Lubega A, Kyegombe DB, Kitya D, Ogwal-Okeng J and Anokbonggo WW. (2013). Review of the biological and health effects of aflatoxins on body organs and body systems: INTECH Open Access Publisher).
19. Cohen JJ, Duke RC, Fadok VA and Sellins KS. Apoptosis and programmed cell death in immunity. Annu Rev Immunol. 1992; 10:267-293.
20. Arguello F, Alexander M, Sterry JA, Tudor G, Smith EM, Kalavar NT, Greene JF, Koss W, Morgan CD and Stinson SF. Flavopiridol induces apoptosis of normal lymphoid cells, causes immunosuppression, and has potent antitumor activity in vivo against human leukemia and lymphoma xenografts. Blood. 1998; 91:2482-2490.
21. McKallip RJ, Lombard C, Martin BR, Nagarkatti M and Nagarkatti PS. Δ9-Tetrahydrocannabinol-induced apoptosis in the thymus and spleen as a mechanism of immunosuppression in vitro and in vivo. J Pharmacol Exp Ther. 2002; 302:451-465.
22. Peng X, Zhang S, Fang J, Cui H, Zuo Z and Deng J. Protective Roles of Sodium Selenite against Aflatoxin B1-Induced Apoptosis of Jejunum in Broilers. Int J Env Res Public Health. 2014; 11:13130-13143.
23. Mary VS, Theumer MG, Arias SL and Rubinstein HR. Reactive oxygen species sources and biomolecular oxidative damage induced by aflatoxin B1 and fumonisin B1 in rat spleen mononuclear cells. Toxicology. 2012; 302:299-307.
24. Hinton DM, Myers MJ, Raybourne RA, Francke-Carroll S, Sotomayor RE, Shaddock J, Warbritton A and Chou MW. Immunotoxicity of aflatoxin B1 in rats: effects on lymphocytes and the inflammatory response in a chronic intermittent dosing study. Toxicol Sci. 2003; 73:362-377.
25. Wang H, Liu H, Zheng Z-M, Zhang K-B, Wang T-P, Sribastav S-S, Liu W-S and Liu T. Role of death receptor, mitochondrial and endoplasmic reticulum pathways in different stages of degenerative human lumbar disc. Apoptosis. 2011; 16:990-1003.
26. Hussein HS and Brasel JM. Toxicity, metabolism, and impact of mycotoxins on humans and animals. Toxicology. 2001; 167:101-134.
27. Rawal S, Kim JE and Coulombe R. Aflatoxin B 1 in poultry: toxicology, metabolism and prevention. Res Vet Sci. 2010; 89:325-331.
28. He Y, Fang J, Peng X, Cui H, Zuo Z, Deng J, Chen Z, Lai W, Shu G and Tang L. Effects of Sodium Selenite on Aflatoxin B1-Induced Decrease of Ileac T cell and the mRNA Contents of IL-2, IL-6, and TNF-α in Broilers. Biol Trace Elem Res. 2014; 159:167-173.
29. Chen K, Yuan S, Chen J, Peng X, Wang F, Cui H and Fang J. Effects of sodium selenite on the decreased percentage of T cell subsets, contents of serum IL-2 and IFN-γ induced by aflatoxin B1 in broilers. Res Vet Sci. 2013; 95:143-145.
30. Sirajudeen M, Gopi K, Tyagi JS, Moudgal RP, Mohan J and Singh R. Protective effects of melatonin in reduction of oxidative damage and immunosuppression induced by aflatoxin B1-contaminated diets in young chicks. Environ Toxicol. 2011; 26:153-160.
31. Chen K, Shu G, Peng X, Fang J, Cui H, Chen J, Wang F, Chen Z, Zuo Z and Deng J. Protective role of sodium selenite on histopathological lesions, decreased T-cell subsets and increased apoptosis of thymus in broilers intoxicated with aflatoxin B1. Food Chem Toxicol. 2013; 59:446-454.
32. White E. Life, death, and the pursuit of apoptosis. Genes Dev. 1996; 10:1-15.
33. Roulston A, Marcellus RC and Branton PE. Viruses and apoptosis. Annu Rev Microbiol. 1999; 53:577-628.
34. Zamzami N, Marchetti P, Castedo M, Decaudin D, Macho A, Hirsch T, Susin SA, Petit PX, Mignotte B and Kroemer G. Sequential reduction of mitochondrial transmembrane potential and generation of reactive oxygen species in early programmed cell death. J Exp Med. 1995; 182:367-377.
35. Liao S, Shi D, Clemons-Chevis CL, Guo S, Su R, Qiang P and Tang Z. Protective Role of Selenium on Aflatoxin B1-Induced Hepatic Dysfunction and Apoptosis of Liver in Ducklings. Biol Trace Elem Res. 2014; 162:296-301.
36. Reed JC. (2015). Roles of Apoptosis-Regulating Bcl-2 Family Genes in AML. Targeted Therapy of Acute Myeloid Leukemia: Springer), pp. 47-65.
37. Masud A, Kuida K, Lakhani SA, Booth CJ, Inayat I, Porter GA, Mehal WZ and Flavell RA. Caspases 3 and 7: Key Mediators of Mitochondrial Events of Apoptosis. Science. 2006; 311:847-851.
38. Crompton M. The mitochondrial permeability transition pore and its role in cell death. Biochem j 1999; 341:233-249.
39. Hu Q, Wu D, Chen W, Yan Z, Yan C, He T, Liang Q and Shi Y. Molecular determinants of caspase-9 activation by the Apaf-1 apoptosome. Proc Natl Acad Sci USA/PNAS 2014; 111:16254-16261.
40. Li P, Nijhawan D, Budihardjo I, Srinivasula SM, Ahmad M, Alnemri ES and Wang X. Cytochrome c and dATP-dependent formation of Apaf-1/caspase-9 complex initiates an apoptotic protease cascade. Cell. 1997; 91:479-489.
41. Chen N, Chen X, Huang R, Zeng H, Gong J, Meng W, Lu Y, Zhao F, Wang L and Zhou Q. BCL-xL is a target gene regulated by hypoxia-inducible factor-1α. J Biol Chem. 2009; 284:10004-10012.
42. Miyashita T, Krajewski S, Krajewska M, Wang HG, Lin H, Liebermann DA, Hoffman B and Reed JC. Tumor suppressor p53 is a regulator of bcl-2 and bax gene expression in vitro and in vivo. Oncogene. 1994; 9:1799-1805.
43. Chipuk JE, Kuwana T, Bouchier-Hayes L, Droin NM, Newmeyer DD, Schuler M and Green DR. Direct activation of Bax by p53 mediates mitochondrial membrane permeabilization and apoptosis. Science. 2004; 303:1010-1014.
44. Hirsova P and Gores GJ. Death Receptor-Mediated Cell Death and Proinflammatory Signaling in Nonalcoholic Steatohepatitis. Cell Mol Gastroenterol Hepatol 2015; 1:17-27.
45. Josse R, Dumont J, Fautrel A, Robin M-A and Guillouzo A. Identification of early target genes of aflatoxin B1 in human hepatocytes, inter-individual variability and comparison with other genotoxic compounds. Toxicol Appl Pharmacol. 2012; 258:176-187.
46. Stennicke HR, Jürgensmeier JM, Shin H, Deveraux Q, Wolf BB, Yang X, Zhou Q, Ellerby HM, Ellerby LM and Bredesen D. Pro-caspase-3 is a major physiologic target of caspase-8. J Biol Chem. 1998; 273:27084-27090.
47. Kaufmann T, Strasser A and Jost P. Fas death receptor signalling: roles of Bid and XIAP. Cell Death Differ. 2011; 19:42-50.
48. Boussabbeh M, Salem IB, Prola A, Guilbert A, Bacha H, Abid-Essefi S and Lemaire C. Patulin induces apoptosis through ROS-mediated endoplasmic reticulum stress pathway. Toxicol Sci. 2015.
49. Little E, Ramakrishnan M, Roy B, Gazit G and Lee AS. The glucose-regulated proteins (GRP78 and GRP94): functions, gene regulation, and applications. Crit Rev Eukaryot Gene Expr. 1993; 4:1-18.
50. Pfaffenbach KT and Lee AS. The critical role of GRP78 in physiologic and pathologic stress. Curr Opin Cell Biol. 2011; 23:150-156.
51. Han F. Single-prolonged stress induces endoplasmic reticulum-dependent apoptosis in the hippocampus in a rat model of post-traumatic stress disorder. PLoS One. 2013; 8:61-61.
52. Wang J-S and Groopman JD. DNA damage by mycotoxins. Mutation Research/Fundamental and Molecular Mechanisms of Mutagenesis. 1999; 424:167-181.
53. Roos WP and Kaina B. DNA damage-induced cell death by apoptosis. Trends Mol Med. 2006; 12:440-450.
54. Chandra J. Triggering and modulation of apoptosis by oxidative stress. Free Radic Biol Med. 2000; 29:323-333.
55. Buttke TM and Sandstrom PA. Oxidative stress as a mediator of apoptosis. Immunol Today. 1994; 15:7-10.
56. Kujoth G, Hiona A, Pugh T, Someya S, Panzer K, Wohlgemuth S, Hofer T, Seo A, Sullivan R and Jobling W. Mitochondrial DNA mutations, oxidative stress, and apoptosis in mammalian aging. Science. 2005; 309:481-484.
57. Council NR. (1994). National research council nutrient requirements of poultry: ninth revised edition. (Washington, DC,USA: National Academies Press).
58. Kaoud HA. Innovative methods for the amelioration of aflatoxin (AFB1) effect in broiler chicks. Sci J Appl Res. 2013; 1:15-19.
59. Tayman C, Tonbul A, Kosus A, Hirfanoglu IM, Haltas H, Uysal S, Tatli MM and Andiran F. Protective effects of caffeic acid phenethyl ester (CAPE) on intestinal damage in necrotizing enterocolitis. Pediatr Surg Int. 2011; 27:1179-1189.
60. Hong YH, Lillehoj HS, Lillehoj EP and Lee SH. Changes in immune-related gene expression and intestinal lymphocyte subpopulations following Eimeria maxima infection of chickens. Vet Immunol Immunopathol. 2006; 114:259-272.
61. Shini S and Kaiser P. Effects of stress, mimicked by administration of corticosterone in drinking water, on the expression of chicken cytokine and chemokine genes in lymphocytes. Stress. 2009; 12:388-399.
62. Livak KJ and Schmittgen TD. Analysis of relative gene expression data using real-time quantitative PCR and the 2-ΔΔCT method. Methods. 2001; 25:402-408.