
Introduction
Myeloproliferative neoplasms (MPNs) are clonal disorders of hematopoietic stem cells (HSCs) characterized by aberrant proliferation of one or several myeloid lineages. MPNs include essential thrombocythemia (ET), polycythemia vera (PV), and primary myelofibrosis (PMF). Whilst these disorders have overlapping clinical features it is only in recent years that the molecular basis of these diseases have been defined [1]. The W515L mutation in the thrombopoietin receptor, MPL, occurs in around 10% of ET and PMF patients. [2] Furthermore, as PV progresses bone marrow scarring can occur leading to myelofibrosis (MF) in 5- 15% of cases [3]. MF arises via a poorly understood process but results in bone marrow failure [4]. Whilst the median survival for patients with PV is more than 10 years [5] that for MF is only five years. [6] As well as the onset of MF patients with MPN can progress to acute myeloid leukemia (AML). [7] Thus a consideration of the effects of MPL W515L will inform our understanding of MF and leukemic progression. This could lead to effective management of the disease.
In MPNs HSCs are thought to secrete factors that activate fibroblasts in the bone marrow, TGFβ being one such factor [8] and this has been reported to promote MF and myeloproliferation, both hallmarks of MF. [9] TGFβ induced liver fibrosis has been shown to be related to intracellular sphingosine 1-phosphate (S1P) levels. [10] S1P can bind to a cognate receptor to elicit signal transduction in HSCs [11] which has differential effects on the motility of HSC and more mature populations in the bone marrow. [12]
We have published that there is a poor correlation between oncogene-mediated mRNA and proteome changes. [13, 14] Therefore we analysed the effects of the MPL W515L using proteomics. The aim was to identify the downstream effectors of MPL W515L that may offer opportunities for therapeutic intervention. We demonstrate that MPL W515L expression leads to an increase in proteins associated with motility and that chemokinesis is increased in these cells. MPL W515L-induced phosphorylation of the spliceosome protein THOC5 is critical in this process. We also show that the THOC5 induced effects on chemokinesis are reliant on MYC signalling and S1P effectors. The observations on motility were validated in primary patient material and we demonstrate the potential therapeutic value of disruption of MYC and S1P.
Results
Analysis of MPL W515L effects
To gain an understanding of the mechanisms of MPL W515L induced effects we undertook a proteomic investigation. The MPL W515L transfected cell line was shown to be independent of Interleukin-3 (normally required for survival and proliferation of Ba/F3 cells) and to have the same growth rate as control cells cultured in Interleukin-3 (Supplementary Figure 2A-2B). The workflow for the mass spectrometric analysis is illustrated in Supplementary Figure 2C. Replicate samples were present in each of the three experiments to allow the calculation of the values defining a change in protein level ensuring only high confidence changes were considered. [13, 15] We defined a protein level as changing where a protein has an isobaric tag reporter ion-based quantification ratio outside the range in which 95% of protein ratios for the internal replicate are found and a p-value of 0.05 or less. This “significance interval” was determined for each experimental run and accounts for the technical and biological variation seen in each run (see Supplementary Table 2).
Cellular fractionation was undertaken (Supplementary Figure 2D) to allow improved data acquisition and quantification of cytosolic and nuclear proteins. [15, 16] As previously reported the expression of leukemogenic oncogenes did not affect the cellular protein content [13] and the average nuclear to cytoplasmic protein content ratio was 1:3.5 +/-0.2 (mean+/-SEM). Thus 100µg of each cell population was used for isobaric tag labelling with no normalisation required for protein content differences. We identified 3392 nuclear proteins (Supplementary Table 3) and 3550 cytoplasmic proteins (Supplementary Table 4) with associated isobaric tag quantification (3469 and 3922 proteins in total).The false discovery rate was 0.14% for the nuclear fraction and 0.08% for the cytoplasmic fraction.
The effect of MPL W515L on the nuclear proteome
Of the nuclear proteins quantified 27 were shown to change as a consequence of MPL W515L expression (Table 1). Within the proteins shown to change there was evidence for perturbation of the RAS pathway in that both JUN b and Traf3ip3 change in expression. In a previous study looking for commonalities in the action of six different leukemogenic tyrosine kinases we showed that disruption of DNA mismatch repair to be a common feature [15]. The data presented here also shows potential disruption of DNA repair in that both MDC1 and MSH6 expression levels are altered by MPL W515L. The changes in Cnot7 have links to the post translational regulation of THOC5 a spliceosome protein known to be a common downstream phosphorylation target of numerous leukemogenic oncogenes. [17]
Table 1: Nuclear proteins whose expression is altered by the expression of MPLW515L
Accession |
Gene Symbol |
Protein Name |
Significance |
Ratio |
ENSMUSP00000080949 |
Mdc1 |
Mediator of DNA damage checkpoint protein 1 |
0.99 |
1.62 |
ENSMUSP00000087947 |
Fyb |
FYN-binding protein (FYN-T-binding protein |
0.99 |
1.65 |
ENSMUSP00000023074 |
Parvg |
Gamma-parvin |
-0.99 |
0.54 |
ENSMUSP00000109325 |
Tpm1 |
Tpm1 protein |
0.99 |
1.62 |
ENSMUSP00000029941 |
Pdlim5 |
PDZ and LIM domain protein 5 |
-0.95 |
0.69 |
ENSMUSP00000028059 |
Rsu1 |
Ras suppressor protein 1 (Rsu-1)(RSP-1) |
0.98 |
1.43 |
ENSMUSP00000099375 |
Itga2b |
Integrin alpha-IIb Precursor |
0.99 |
1.78 |
ENSMUSP00000005503 |
Msh6 |
DNA mismatch repair protein Msh6 |
-0.96 |
0.76 |
ENSMUSP00000015581 |
Gzmb |
Granzyme B(G,H) Precursor |
-0.99 |
0.53 |
ENSMUSP00000077342 |
Skap2 |
Src kinase-associated phosphoprotein 2 |
0.98 |
1.68 |
ENSMUSP00000118997 |
Cbfa2t3 |
Core-binding factor, runt domain, alpha subunit 2 |
0.98 |
1.47 |
ENSMUSP00000040977 |
Traf3ip3 |
TRAF3-interacting JNK-activating modulator |
-0.97 |
0.7 |
ENSMUSP00000095286 |
Dock10 |
Dedicator of cytokinesis protein 10 (Zizimin-3) |
-0.99 |
0.53 |
ENSMUSP00000101921 |
Sept1 |
Putative uncharacterized protein Sept1 |
-0.98 |
0.63 |
ENSMUSP00000117606 |
Fcho1 |
Putative uncharacterized protein Fcho1 |
-0.96 |
0.7 |
ENSMUSP00000064680 |
Junb |
Transcription factor jun-B (MyD21) |
0.96 |
1.48 |
ENSMUSP00000106311 |
Pitrm1 |
Presequence protease, mitochondrial Precursor |
0.98 |
1.77 |
ENSMUSP00000110707 |
Fam107b |
Protein FAM107B |
-0.99 |
0.48 |
ENSMUSP00000073124 |
Plec |
Plectin-1 (Plectin-6)(PLTN)(PCN) |
-0.99 |
0.68 |
ENSMUSP00000117304 |
Cnot7 |
CCR4-NOT transcription complex, subunit 7, isoform |
0.97 |
1.68 |
ENSMUSP00000039776 |
Pold1 |
DNA polymerase delta catalytic subunit |
-0.92 |
0.8 |
ENSMUSP00000030684 |
Gnl2 |
Nucleolar GTP-binding protein 2 |
0.93 |
1.28 |
ENSMUSP00000030030 |
Tex10 |
Testis-expressed sequence 10 protein |
0.94 |
1.28 |
ENSMUSP00000067685 |
Iqgap2 |
Ras GTPase-activating-like protein IQGAP2 |
-0.93 |
0.73 |
ENSMUSP00000074216 |
Gm8894 |
Myosin light polypeptide 6 |
-0.95 |
0.62 |
ENSMUSP00000103267 |
Ldha |
L-lactate dehydrogenase A chain (LDH-A) |
-0.91 |
0.7 |
ENSMUSP00000082682 |
Hmgb1 |
High mobility group protein B1 |
-0.9 |
0.71 |
Proteins shown are those that are defined as changing by the parameters outlined in Results section 1. ‘’ratio’’ represents an average of the MPL W515L:MSCV protein ratios across multiple experiments. This is supported by the averaged confidence across experiments, ‘’significance’’, which indicates how closely the experiments agree. For inclusion the ‘’significance’’ level was 0.90 or above.
The proteomic analysis also showed that FYB was up-regulated in MPL W515L expressing cells. FYB is known to bind SRC family members and prevent the degradation of SKAP2. The data also indicate an increase in SKAP2 expression. The up regulation of FYB and SKAP2 were confirmed by western blot analysis (Figure 1A) verifying the robust nature of iTRAQ proteome data as we have previously shown. [13, 15, 18] The disruption of the SRC signalling pathway, as indicated by the up-regulation of FYB and SKAP2, was investigated further by qRT-PCR of SRC family members. The results of the PCR (data not shown) suggested an up regulation of the SRC kinase family member LYN in MPL W515L expressing cells. This up regulation of LYN expression was confirmed by western blot (Figure 1B). We have previously shown that SRC family proteins stimulate the phosphorylation of THOC5 on tyrosine Y225 [19]. This along with the changes in Cnot7 (see above) led us to investigate the status of THOC expression and phosphorylation in MPL W515L expressing cells. Whilst the expression of THOC was unaffected by MPL W515L expression the degree of Y225 phosphorylation was markedly increased (Figure 1C). THOC5 shuttles between the nucleus and cytosol but the Y225 phosphorylated THOC5 has a mainly cytosolic location (Figure 1C). This MPL W515L enhanced THOC5 phosphorylation was modulated by the JAK2 inhibitor ruxolotinib which reduced the level of THOC5 Y225 phosphorylation (Figure 1D). Analysis of transcription factors with binding motifs present in the promoter region of genes for those proteins that changed in expression in response to MPL W515L revealed that MYC consensus binding sites were associated with a number of genes whose proteins increased in expression. This tentative observation and the fact that THOC5 has been shown to regulate MYC expression [20] led us to investigated whether MPL W515L had any effect on MYC expression levels. Western blot analysis of MYC levels showed an increase when MPL W515L was present and that MYC had a mainly nuclear distribution (Figure 1E).
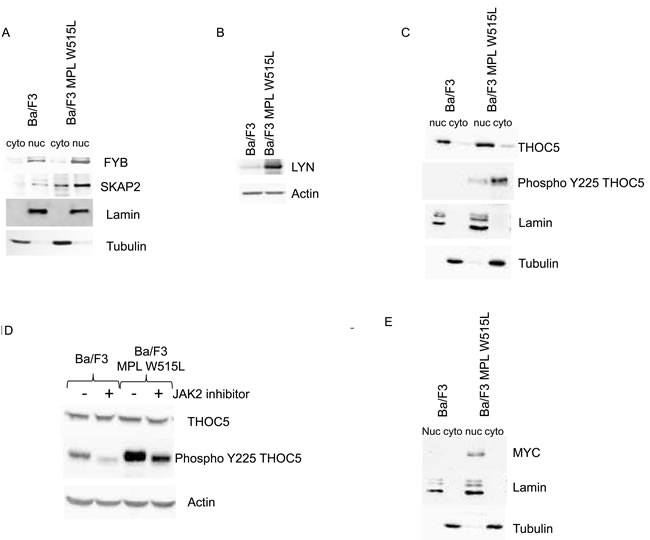
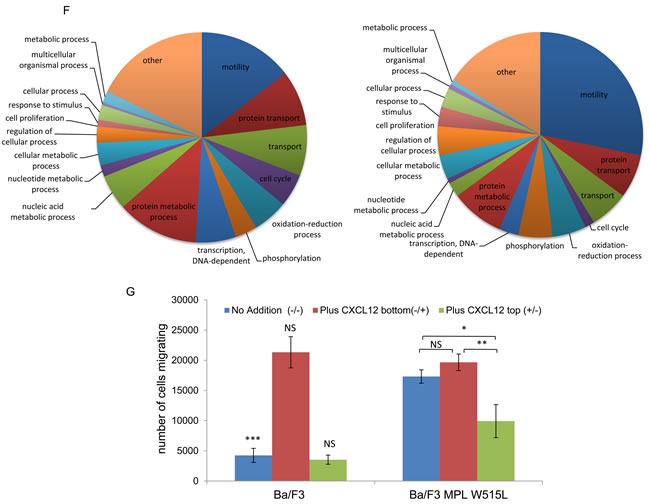
Figure 1: The effect of MPL W515L on the Nuclear and cytoplasmic proteome. Control and MPL W515L expressing cells were subject to nuclear/cytoplasmic fractionation and the levels and distribution of the proteins indicated assessed by western blot analysis. (A, C and E). Lamin and tubulin expression were used as loading controls and fractionation markers. B. The expression level of Lyn was assessed by western blot in whole cell lysates. Actin was used as a loading control. D. Western blot analysis of THOC5 phosphorylation in control and MPL W515L expressing cells following treatment with 0.5µM of the Jak2 inhibitor Ruxolitinib for 16hours. Actin was used as a loading control. F. Pie charts of cytoplasmic proteins categorised by biological-process are shown. The left panel represents all the proteins identified (3447) with an assigned biological process and the right panel those defined as changing (131) in at least two of the three replicates. G. The CXCL12 induced chemotactic response of control and MPL W515L expressing cells was assessed in Boyden chamber assays. Cells (1x10⁵) were added to the top well. CXCL12 (200ng/ml) was added to bottom well (-/+), top well (+/-) or omitted (-/-). The number of cells in the bottom well was counted after 6 hours. Results are the mean ± SEM, n = 4. The results of a t-test between Ba/F3 and MPL W515L are shown above the results for Ba/F3 and between the treatments for the MPL W515L. The results of the t-test are represented by; NS non-significant, * < 0.05, ** < 0.01, *** < 0.001.
The effect of MPL W515L on the cytoplasmic proteome
From the comprehensive list of proteins quantified in the cytoplasmic fractions 42 were designated as changing as a consequence of MPL W515L expression (Table 2). In addition to the JAK/STAT pathway MPL activation has been shown to involve the RAS/RAF/MAPK pathway and it has been demonstrated that RAS and RAP1 are needed for sustained ERK activation in MPL signalling. [21] In line with these observations, and agreement with perturbation of the RAS pathway in our nuclear proteome analysis, four of the proteins identified as changing as a consequence of MPL W515L expression in the cytoplasm are constituents of the RAS pathway.
When all the proteins identified and those designated as changing were assigned to a biological process a specific enrichment of proteins involved in motility (15% to 28%) was seen in the proteins shown to be changing (Figure 1F). This is of interest since MPNs are often characterised by a large increase in the number of circulating CD34+ cells indicating that adhesion within or egress from the stem cell niche is disrupted. We therefore asked the question whether MPL W515L expression led to a modulation of cellular motility. Whilst the MPL W515L expressing cells displayed no change in their chemotactic response to CXCL12 (p = 0.13) they showed a 4.1 fold increase in chemokinesis in the absence of any external stimulus (p < 0.001) (Figure 1G). Thus the changes in expression of the motility proteins we observed are associated with a change in a biological parameter relevant in blood cell production/function and leukemogenesis.
The mechanism for the effect of MPL W515L on motile response
The perturbation in chemotactic response is in keeping with the pathology of MPNs [22]. We therefore investigated this phenomenon in greater detail to understand the mechanism by which this was achieved. CD45 has been reported to be a JAK2 phosphatase [23] and our data indicated a downregulation of CD45 in MPL W515L expressing cells (Table 2). We therefore investigated the CXCL12/CXCR4/CD45 pathway in an attempt to understand the potential mechanism of motility stimulus. Surprisingly, given the increase in chemokinesis, both CXCR4 and CD45 levels (in agreement with our proteomic data) were reduced in the MPL W515L expressing cells (Figure 2A-2D). The number of cells expressing cell surface CXCR4 was vastly reduced (Figure 2A) and this was reflected in a reduced overall level of expression as assessed by western blot on whole cell lysates (Figure 2B). Whilst all cells expressed CD45 the amount of cell surface CD45 was reduced (Figure 2C) and again this was reflected in a reduced overall level of expression (Figure 2D and Table 2).
THOC5 a target for MPL W515L (Figure 1C, 1D) is an mRNA processing protein that lies downstream of the CXCL12/CD45 signalling pathway and its phosphorylation can affect motility. [19] Therefore we next determined whether THOC5 phosphorylation and increased MYC expression played any role in the enhanced chemokinetic behaviour of the MPL W515L expressing cells. We have previously shown that knockdown of THOC5 expression causes apoptosis [24] which negates the use of such techniques in the study of the effects of THOC5 phosphorylation. We therefore chose to express a phospho-mutant of THOC, Y225F, in the MPL W515L cells to investigate whether this had any dominant negative effects on the increased chemokinesis. THOC5 Y225F displayed a similar nuclear/ cytoplasmic localisation/ratio to endogenous THOC5 (Supplementary Figure 3A) and did not appear to influence endogenous THOC5 expression or phosphorylation. However THOC5 Y225F expression in the MPL W515L cells led to a loss of both the enhanced oncogene mediated chemokinesis and the cellular ability to respond to CXCL12 (Figure 2E).
Table 2: Cytoplasmic proteins whose expression is altered by the expression of MPLW515L
Accession |
Gene Symbol |
Protein Name |
Significance |
Ratio |
ENSMUSP00000028059 |
Rsu1 |
Ras suppressor protein 1 |
0.98 |
1.93 |
ENSMUSP00000099375 |
Itga2b |
Integrin alpha-IIb Precursor |
0.99 |
2.44 |
ENSMUSP00000021611 |
Pitrm1 |
Presequence protease, mitochondrial Precursor |
0.98 |
1.82 |
ENSMUSP00000021028 |
Itgb3 |
Integrin beta-3 Precursor |
0.99 |
2.60 |
ENSMUSP00000003017 |
Tbxas1 |
Thromboxane-A synthase |
0.98 |
2.23 |
ENSMUSP00000121201 |
Lcp1 |
Putative uncharacterized protein Lcp1 |
-0.97 |
0.57 |
ENSMUSP00000002640 |
Scin |
Adseverin (Scinderin) |
-0.99 |
0.41 |
ENSMUSP00000003912 |
Calr |
Calreticulin Precursor |
-0.96 |
0.64 |
ENSMUSP00000110707 |
Fam107b |
Protein FAM107B |
-0.98 |
0.46 |
ENSMUSP00000025762 |
Banf1 |
Barrier-to-autointegration factor |
-0.97 |
0.56 |
ENSMUSP00000086795 |
Lgals1 |
Galectin-1 (Gal-1)(Lectin galactoside-binding soluble 1) |
-0.99 |
0.28 |
ENSMUSP00000075690 |
Serpinb1a |
Leukocyte elastase inhibitor A |
-0.98 |
0.54 |
ENSMUSP00000028239 |
Gsn |
Gelsolin Precursor |
-0.97 |
0.54 |
ENSMUSP00000027645 |
Ptprc |
Receptor-type tyrosine-protein phosphatase C Precursor |
-0.98 |
0.52 |
ENSMUSP00000084882 |
Gda |
Guanine deaminase (Guanase)(Guanine aminase) |
-0.99 |
0.42 |
ENSMUSP00000043724 |
Rcsd1 |
CapZ-interacting protein (Protein kinase substrate CapZIP) |
-0.98 |
0.52 |
ENSMUSP00000025207 |
Tmem173 |
Transmembrane protein 173 |
-0.99 |
0.41 |
ENSMUSP00000066238 |
Rap1b |
Ras-related protein Rap-1b Precursor |
0.97 |
1.86 |
ENSMUSP00000070427 |
Zyx |
Zyxin |
0.97 |
1.79 |
ENSMUSP00000070113 |
Nrgn |
Neurogranin |
0.95 |
1.63 |
ENSMUSP00000097772 |
AC123724.1 |
Putative uncharacterized protein Bin2 |
0.96 |
1.60 |
ENSMUSP00000104825 |
Ifi47 |
Interferon gamma inducible protein 47 |
0.96 |
1.69 |
ENSMUSP00000020529 |
Ahsa2 |
Activator of 90 kDa heat shock protein ATPase homolog 2 |
0.96 |
1.68 |
ENSMUSP00000052020 |
Flnb |
Filamin-B |
-0.96 |
0.63 |
ENSMUSP00000114705 |
Dbi |
Diazepam binding inhibitor |
-0.95 |
0.65 |
ENSMUSP00000025904 |
Prdx5 |
Peroxiredoxin-5, mitochondrial Precursor |
-0.95 |
0.64 |
ENSMUSP00000097154 |
Tjp2 |
Tight junction protein ZO-2 |
-0.96 |
0.62 |
ENSMUSP00000063825 |
Pcx |
Pyruvate carboxylase, mitochondrial Precursor |
-0.96 |
0.63 |
ENSMUSP00000085253 |
Rab44 |
Ras-related protein Rab-44 |
-0.98 |
0.50 |
ENSMUSP00000099853 |
Cd47 |
Leukocyte surface antigen CD47 Precursor |
-0.98 |
0.49 |
ENSMUSP00000073975 |
Pdcd4 |
Programmed cell death protein 4 |
-0.98 |
0.40 |
ENSMUSP00000101657 |
Ifitm1 |
Interferon induced transmembrane protein 1 |
-0.99 |
0.33 |
ENSMUSP00000039797 |
Prkar2b |
cAMP-dependent protein kinase type II-beta regulatory subunit |
0.94 |
1.44 |
ENSMUSP00000105647 |
Lgmn |
Legumain Precursor |
0.92 |
1.50 |
ENSMUSP00000023486 |
Tfrc |
Transferrin receptor protein 1 |
0.91 |
1.47 |
ENSMUSP00000032949 |
Coro1a |
Coronin-1A |
-0.95 |
0.67 |
ENSMUSP00000109707 |
Capg |
Macrophage-capping protein |
-0.95 |
0.67 |
ENSMUSP00000067685 |
Iqgap2 |
Ras GTPase-activating-like protein IQGAP2 |
-0.91 |
0.69 |
ENSMUSP00000072840 |
Sh3kbp1 |
SH3 domain-containing kinase-binding protein 1 |
-0.92 |
0.67 |
ENSMUSP00000103007 |
Idh2 |
Isocitrate dehydrogenase [NADP] |
-0.95 |
0.66 |
ENSMUSP00000040956 |
Sccpdh |
Probable saccharopine dehydrogenase |
-0.94 |
0.68 |
ENSMUSP00000116616 |
Tbcel |
Putative uncharacterized protein Tbcel |
-0.92 |
0.66 |
Proteins shown are those that are defined as changing as in Table 1.
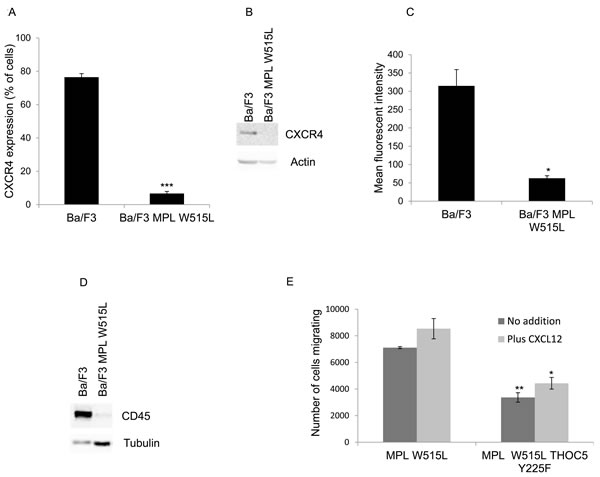
Figure 2: THOC5 plays a role in MPL W515L induced motility. A. Cell surface expression of CXCR4 was assessed using flow cytometry. Results are expressed as the number of positively staining cells +/-SEM (n = 3). B. Western blot analysis of CXCR4 expression in whole cell lysates. Actin was used as a loading control. C. Cell surface expression of CD45 was assessed using flow cytometry. Results are expressed as the mean fluorescence intensity +/-SEM (n = 3). D. Western blot analysis of CD45 expression in whole cell lysates. Tubulin was used as a loading control. E. Chemokinesis was measured using Boyden chamber assays in parental Ba/F3 cells, MPL W515L expressing cells and MPL W515L co-transfected with THOC5 Y225F. The results of a t-test between Ba/F3 and MPL W515L (A, B) or MPL W515L and MPL W515L THOC5 Y225F (E) are shown and represented by; * < 0.05, ** < 0.01, *** < 0.001.
The next question we investigated was whether the increase in chemokinesis was via the modulation of MYC. Either knockdown of MYC using siRNA (Figure 3A) or the inhibition of MYC with the BET bromodomain inhibitor JQ1 (Figure 3B) led to a reduction in the chemokinetic enhancement induced by MPL W515L. Both siRNA and JQ1 treatment led to a significant down regulation of MYC (Supplementary Figure 3B, 3C). Given our previous observations on the role of THOC5 in MYC regulation [20] and the apparent role of THOC5 and MYC in the MPL W515L-induced chemokinesis we hypothesised that the phosphorylation of THOC5 at Y225 achieved its effects on motility via the modulation of MYC expression. Western blot analysis of MYC expression in the MPL W515L cells transfected with THOC5 Y225F clearly shows a down regulation of MYC protein levels (Figure 3C). This suggested a signalling cascade existed from MPL W515L which led to THOC5 phosphorylation altering MYC expression contributing to increased motility. The next question we addressed was whether THOC5 Y225 phosphorylation has any effect on the MPL W515L induced decrease in CXCR4 and CD45 expression. Flow cytometric analysis and western blot assessment of CXCR4 and CD45 expression in THOC5 Y225F transfected cells suggested that whilst THOC5 phosphorylation may be downstream of these proteins a feedback loop does not exist as it does not lead to any alteration in CXCR4 or CD45 expression (Figure 3D-3G).
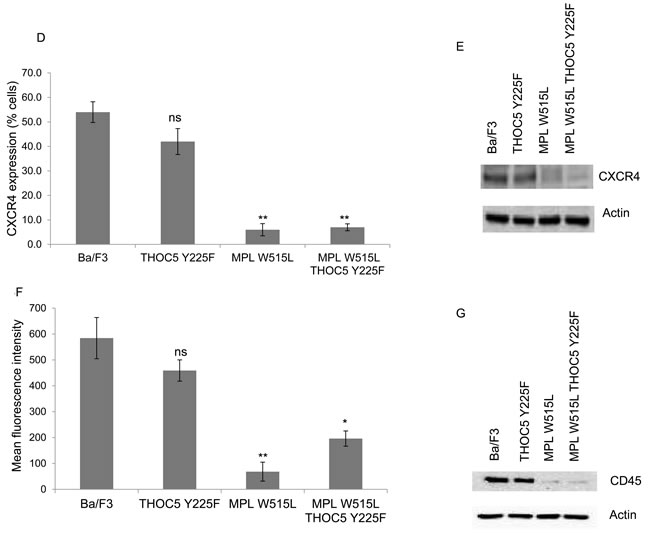
Figure 3: MYC plays a role in MPL W515L induced motility. Chemokinesis and chemotaxis was measured using Boyden chamber assays in parental Ba/F3 cells and MPL W515L expressing cells 24 hours post transfection with c-MYC SiRNA A. or following 2 hours pre-incubation with 500nM of the MYC inhibitor JQI B. Results shown are the number of cells migrating (mean ± SEM, n = 3), cell viability was greater than 94% post migration assay. C. Western blot analysis of MYC expression with actin as a loading control. D. Cell surface expression of CXCR4 was assessed using flow cytometry. Results are expressed as the number of positively staining cells +/-SEM (n = 4). E. Western blot analysis of CXCR4 expression in whole cell lysates. Actin was used as a loading control. F. Cell surface expression of CD45 was assessed using flow cytometry. Results are expressed as the mean fluorescence intensity +/-SEM (n = 3). G. Western blot analysis of CD45 expression in whole cell lysates. Tubulin was used as a loading control. The results of a t-test against Ba/F3 (D, F) or as shown (A, B) are shown and represented by; * < 0.05, ** < 0.01, *** < 0.001.
TGFβ and S1P are involved in the MPL W515L induced chemotaxis
To further delineate the pathways involved in this MPL W515L - THOC5 - MYC enhancement of motility we undertook a screen of signal transduction inhibitors to gain insight into which pathways may be up-regulated so contributing to the increased motility (Figure 4A). It has been reported that MPL W515L leads to the constitutive activation of the PI3K and ERK pathway [25, 26] and that Src is involved in motility signalling via the CXCR4/CD45 axis. [27, 28] We therefore chose inhibitors to these pathways. JAK2 inhibitor ruxolitinib (INCB018424) can be seen to totally abolish any chemokinectic behaviour. Of the inhibitors employed only MEK (U0126) and TGFβ (LY364947) inhibition had any significant effect on MPL W515L-mediated chemokinesis.
Interestingly we have previously reported that TGFβ protein level is up-regulated by leukemogenic oncogenes. [15] There was also an indication in one LCMSMS iTRAQ experiment that this cytokine was elevated by MPL W515L expression. Given this data and TGFβ’s importance in CML pathogenesis, [8] MPN fibrosis [9, 29] and motility [30] we investigated the levels of TGFβ in the extracellular medium. ELISA based immunoassays of secreted TGFβ showed a marked increase in conditioned media from MPL W515L expressing cells (Figure 4B). Perhaps somewhat surprisingly the secretion of TGFβ does not appear to act in a paracrine fashion failing to activate the classical TGFβ signalling pathways with no change in expression of either SMAD 7 (Figure 4C) or phosphorylation of SMAD 2 (Figure 4D).
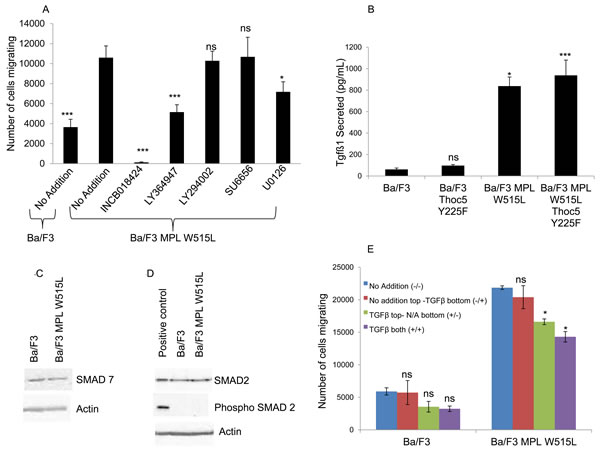
Figure 4: A role for TGFβ-1 in the MPL W515L induced chemotaxis. A. The effect of inhibitor treatment on chemokinesis in MPL W515L was assessed. Cells were pre-incubated with inhibitors for 2 hours before undertaking the motility assay. 105 cells were used and the number of cells migrating into the bottom well counted after 6 hours incubation. Results are the mean ± SEM of at least three experiments. Inhibitors used were 50 µM INCB018424 (JAK2 inhibitor), 5µM LY364947 (TGFβ inhibitor), 10µM LY294002 (PI3K inhibitor), 20µM SU6656 (Src inhibitor) and 10µM U0126 (MEK 1/2 inhibitor). Cell viability was greater than 90% prior to and post the migration assay. B. The levels of TGFβ-1 were measured in culture supernatants from parental Ba/F3, MPL W515L, THOC5 Y225F and MPL W515L co-transfected with THOC5 Y225F expressing cells using the Quantikine ELISA from R&D systems. Results are displayed as pg/ml of cell culture supernatant +/-SEM (n = 3). The levels of SMAD7 C., SMAD2 and phospho S465/467 SMAD2 D. expression in Ba/F3 and MPL W515L expressing cells was assessed by western blot. E. Chemokinesis was measured using Boyden chamber assays in parental Ba/F3 cells and MPL W515L expressing cells with 5ng/ml TGFβ added to either the top well (+/-) bottom well (-/+) or both wells (+/+). Results shown are the number of cells migrating (mean ± SEM, n = 3). The results of a t-test against MPL W515L no addition (A) Ba/F3 (B) or no addition (E) are shown and represented by; * < 0.05, ** < 0.01, *** < 0.001.
Does this increase in TGFβ play a role in the enhanced chemokinesis? Despite showing a decrease in the enhanced chemokinesis the MPL W515L Ba/F3 cells transfected with the phospho mutant of THOC5, THOC5 Y225F, still produce TGFβ to a comparable level to that of the MPL W515L Ba/F3 cell line (Figure 4B). Also TGFβ does not display any chemotactic properties on the Ba/F3 cells (Figure 4E). These results offer a paradox given that we have already shown that inhibition of TGFβ led to a partial reduction in the chemokinesis in the MPL W515L expressing cells (Figure 4A). A possible explanation would be that the TGFβ may activate a secondary pathway in the MPL W515L expressing cells. TGFβ signalling has been shown to interact with that of S1P [31] and also to activate S1P release. [32, 33] In addition sphingosine kinase has been reported to play a role in mediating TGFβ enhanced migration of both breast and esophageal cancer cells. [34, 35] Given the importance of S1P in the egress of HSCs from the bone marrow [11, 36] and our previous data on the differential effects of S1P on the motility of primitive haemopoietic cells [12] we investigated the possibility that the TGFβ effects were mediated via S1P. Interference of S1P production via inhibition of sphingosine kinase completely blocked the enhanced chemokinesis seen in the MPL W515L expressing cells (Figure 5A) and in accordance with our observations on the role of THOC5 and MYC led to a dramatic decrease in the level of THOC5 Y225 phosphorylation and MYC expression (Figure 5B). This is despite the fact that S1P added exogenously did not act as a chemo-attractant for either Ba/F3 or MPL W515L expressing Ba/F3 cells (Figure 5C) or lead to the phosphorylation of THOC5 (Supplementary Figure 4). Yu et al have previously reported that whilst extracellular S1P is chemo-attractant intracellular S1P acts to induce non-directional cell movement. [37] In accordance with the report of Yu et al measurement of intracellular S1P levels indicate that the MPL W515L expressing cells have increased levels of this phospholipid (Figure 5D). Transfection of the MPL W515L cells with the THOC mutant Y225F reduced the level of S1P (Figure 5D) which is in line with the reduction in chemokinesis observed in these cells (Figure 2E).
The Ba/F3 cell study has provided insights into the downstream effectors of MPL W515L. This analysis was not possible using primary cell material. We then considered the relevance of these data to primary MPL W515L positive cells.
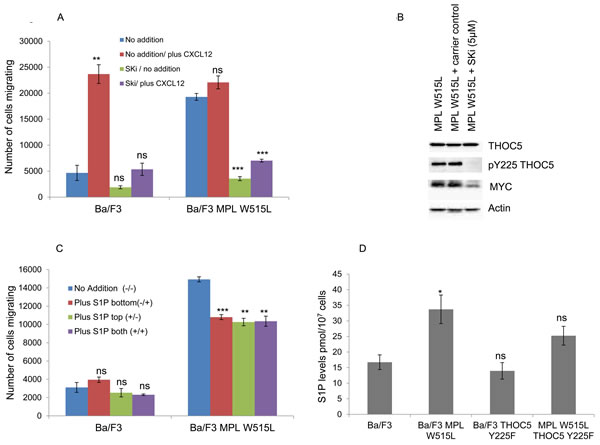
Figure 5: The role of S1P in the MPL W515L-induced chemotaxis. A. Chemokinesis was measured using Boyden chamber assays in parental Ba/F3 cells and MPL W515L expressing cells following 2 hours pre-incubation with 10µM sphingosine kinase inhibitor SKi. Results shown are the number of cells migrating (mean ± SEM, n = 3). B. Assessment of THOC5 phosphorylation and MYC expression by western blot analysis in Ba/F3 and Ba/F3 cells expressing MPL W515L following 6 hours treatment with 10µM sphingosine kinase inhibitor SKi. C. Chemokinesis was measured using Boyden chamber assays in parental Ba/F3 cells and MPL W515L expressing cells with 5µg/ml S1P added to either the top well (+/-) bottom well (-/+) or both wells (+/+). Results shown are the number of cells migrating (mean ± SEM, n = 3). D. Levels of intracellular S1P in the cell lines indicated were measured by Mass Spectrometry. Results shown are expressed as pmol per 107 cells (mean ± SEM, n = 6). The results of a t-test between treated and untreated are shown and represented by; * < 0.05, ** < 0.01, *** < 0.001.
Confirmation of cell line observations in patient material
Despite the extremely limited availability of clinical material from patients with the MPL W515L mutation we succeeded in obtaining samples to verify our cell line based observations in primary patient material. Given the scarcity of samples we chose to verify the downstream effects of the protein changes rather than the protein changes themselves. We first asked the question whether MPL W515L positive patient cells displayed increased chemokinetic behaviour. This was indeed the case with CD34+ cells of MPL W515L positive patients demonstrating increased chemokinesis compared to non-leukemic CD34+ cells (Figure 6A). We next undertook an investigation into whether any of the perturbed pathways we had identified offered any potential as therapeutic targets. As the ultimate goal of any therapy is elimination of the leukemic repopulating cell we assessed the effects of inhibition of both MYC and sphingosine kinase on CD34+ cells in colony forming assays. The inhibitors chosen, JQ1 and Ski, or derivatives of these inhibitors are already in clinical trial for the treatment of other cancers which would aid repositioning of the drugs for use in the treatment of MPL W515L driven leukaemia. Given the extremely limited availability of patient material we tested the drugs for their dose related effects using cell lines then used the optimal dose for the work described below. Whilst individually the drugs did not have a significant difference in terms of inhibition of colony formation the combination appears to promote preferential killing of the leukemic cells (Figure 6B).
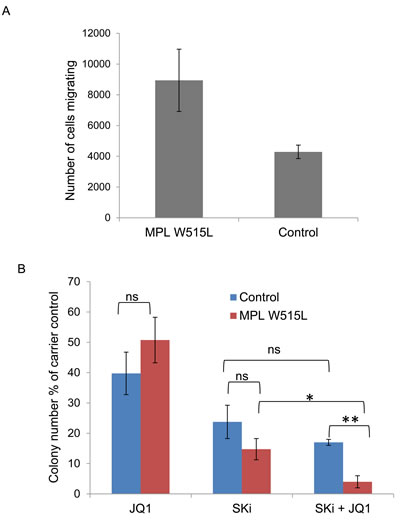
Figure 6: Confirmation of cell line observations in primary cells. A. Chemokinesis of CD34+ cells from MPL W515L positive Essential Thrombocythemia patients and non-leukemic patients was assessed using Boyden chamber assays in 96-transwell plates. 3 x 10⁴ CD34+ cells in 30µl of media (Fischers 10% v/v HS) were placed in the top well and 30µl of media in the bottom wells. Plates were incubated at 370C for 6 hours and the number of cells migrating into the bottom well were counted. Results shown are the number of cells migrating (mean+/-SEM, n = 3). B. The effect of MYC inhibition (250nM JQ1) and sphingosine kinase inhibition (10 µM SKi) on the ability of CD34+ cells from MPL W515L positive Essential Thrombocythemia patients and non-leukaemic patients to form colonies in methylcellulose was assessed. Data is displayed as the total number of colonies expressed as a percentage of the carrier control (mean+/-SEM, n = 4).
Discussion
Leukemias and myeloproliferative disorders are associated with mutated genes in signal transduction pathways. These offer targets to treat leukemias and successful approaches have been developed which have in the form of tyrosine kinase inhibitor based therapies for diseases such as CML. [38] The identification of activating mutations in the thrombopoietin receptor gene (MPL W515L) in myelofibrosis thus afforded opportunities to define downstream targets for therapeutic intervention. A cautionary point, however is that although MPL W515L activates JAK2 the use of inhibitors to JAK2 does not reduce mutant allele burden [39, 40] and as such have been argued to offer little improvement on chemotherapeutic agents (such as hydroxyurea) in MPNs [41]. Hence, understanding the effectors of MPL more fully is important for the development of a firm knowledge base on the molecular pathogenesis of MF thereby leading to opportunities for increased translational research. In this respect we have produced a comprehensive data set on the proteomics effects of MPL W515L.
We observed that MPL W515L potentiated expression of proteins involved in motility and disrupted the CXCL12/CXCR4/CD45/SRC/THOC5 pathway (Summarised in Figure 7). We have clearly shown chemokinesis is increased not only in our model but also in primary cells from patients with the MPL W515L mutation. This observation fits with the pathology of the disease in that patients with PMF display a mobilisation of haemopoietic progenitors from the bone marrow and upto a 200-fold increase in the number of circulating CD34+ cells have been reported. [22, 42] It has been proposed that this increase results from several mechanisms including a reduced CXCR4 expression on CD34+ cells [43, 44] and disruption of the CXCR4/SDF-1 axis by a bone marrow proteolytic environment resulting from altered expression of proteases. [45, 46] Gene expression analysis of the consequences of Givinostat treatment, a drug with antiproliferative and proapoptotic activity against MPN cells, demonstrated that of the genes associated with haemopoiesis shown to change, 25% were associated with motility and adhesion. [47] The consequences of MPL W515L expression on this process at a protein level have been elucidated in this study.
Although the mechanism underlying myelofibrosis associated with JAK2 (a MPL W515L stimulated target) induced MPNs has been reported to be the excess production of TGFβ by CD34+ cells [48] the importance of TGFβ to the pathogenesis of myelofibrosis and its utility as a therapeutic target in treatment of JAK2 induced MPN are still not clear. For example rather than a direct effect on fibroblasts it has been suggested that TGFβ promotes tumorigenesis by the metabolic reprogramming of the tumour microenvironment changing the mitochondrial activity of adjacent cancer cells. [49] Here we show that MPL W515L expressing cells display a profound induction of TGFβ secretion and that this TGFβ release is involved in the increased chemokinesis observed. Further we show that this TGFβ induced chemokinesis is achieved via S1P and the phosphorylation of THOC5 a protein involved in RNA processing and export. Given the increase in circulating CD34+ cells in the peripheral blood of MPN patients and the importance of S1P in the egress of HSCs from the bone marrow [11, 36] these observations are of clinical relevance.
Several reports link S1P to leukemia [50], [51] and it has very recently been reported that sphingosine kinase plays an oncogenic role in acute lymphoblastic leukemia by regulating MYC expression. [52] Here we extend these observations by not only showing that S1P plays a role in MYC expression but does so via THOC5 phosphorylation and potentially contributes to leukemogenesis by altering the motile behavior of the cells. Given our findings that changes in protein expression are not directly linked to changes in mRNA expression [13, 14] and THOC5 binds MYC mRNA [20] it is noteworthy that Jiang et al [53] demonstrated that overexpression of SPK led to an increase in MYC expression via induction of MYC mRNA translation. It is therefore possible to hypothesize since THOC5 phosphorylation is a cytoplasmic event that it is linked to mRNA translation rather than mRNA transport. It is also interesting to speculate that the observed increase in S1P is related to the reported JAK2 activated changes in PP2a [54] which has been shown to selectively eradicate drug-resistant CML stem cells [55]. These and other data [19] are developing an understanding of THO complex modulation by leukemogenic oncogenes and also chemotactic factors that control stem cell retention in the marrow.
In conclusion our analysis of the effects of the leukemogenic oncogene MPL W515L has revealed effects on motility which are linked to MYC and TGFβ expression, S1P production and THOC5 phosphorylation hence offering novel potential targets for therapeutic intervention. We have illustrated the potential of a combination therapy of MYC and sphingosine kinase inhibition to preferentially kill HSCs from MPL W515L positive patients and we are in the process of assessing the utility of S1P, TGFβ and MYC inhibitors further. These studies will include a proteomic and transcriptomic assessment of drug action increasing our knowledge of MPLW515L driven malignancies. These studies will be undertaken alongside a more detailed analysis of THOC5 phosphorylation mediated control of MYC expression which will allow the identification of further treatment strategies. In addition we are utilising our cell line model to identify drugs capable of preventing the up-regulation of TGFβ production with a view to preventing fibrosis. All this knowledge will be used to inform any in vivo studies undertaken.
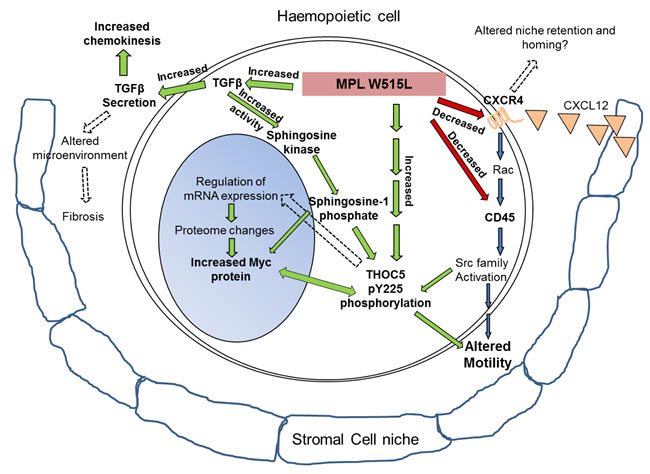
Figure 7: MPL W515L induced pathways: Schematic representation of the results depicting the MPL W515L induced protein and phenotypic changes. Red/green arrows and bold text represent observations from this study and blue arrows and normal text recognised pathways. In addition broken arrows depict hypothesised effects.
Materials and Methods
Cell lines and mass spectrometry
Ba/F3 cells were transfected with MSCV retroviral vectors and maintained as previously described. [13] Cellular fractionation was undertaken with a kit from Active Motif (Belgium) with modifications as previously described. [15] Isobaric tagging using 8 channel ITRAQTM reagent and nanoflow liquid chromatography plus tandem mass spectrometry were performed as described previously. [15] Data was processed by a ‘Thorough’ search against the Ensembl (FIXME, www.ensembl.org) mouse database (release 58) using ProteinPilot 3 software (Paragon version 3.0.0.0, 113442, SCIEX) with default settings including the allowance of one missed/nonspecific cleavage, MMTS and 8 plex iTRAQ modifications. All the data was normalised such that the median was 1.0 and the ratios checked to ensure they had a normal distribution (Supplementary Figure 1). Sphingosine-1-phosphate was extracted and analysed by liquid chromatography coupled to electrospray ionisation tandem mass spectrometry (LC/ESI-MS/MS) as previously described. [56]
Protein measurement
Western blot analysis was performed using standard protocols and images acquired using Quantity One software (BioRad, UK). Antibodies used are shown in Supplementary Table 1. Cell surface expression of specific proteins was assessed using flow cytometry with the LSRFortessa cell analyzer (Becton Dickinson, UK) and data analysed with FlowJo (Tree Star, USA) software as previously described. [19] Cells were stained with either APC rat-anti mouse CD184/CXCR4 or PE Rat anti-mouse CD45 (Becton Dickinson). TGFβ concentrations in cell culture supernatants were measure using the ‘’Quantikine’’ ELISA kit (R&D Systems, UK) as per manufacturer’s instructions.
Cell motility assays
Chemotaxis assays were performed as previously described [12] using a Boyden chamber assay. Primary cell work was carried out in a 96 well plate format (Neuroprobe, USA) and cell line work in 24 well plate format (Sigma Aldrich, UK). The number of cells migrating in response to 200ng/ml CXCL12 was assessed over 6 hours. Where indicated cells were pre-incubated with inhibitors for 2 hours.
siRNA transfection
Cells were transiently transfected with the 260nM MISSION® esiRNA targeting mouse MYC (Sigma Aldrich) or a negative control siRNA (Silencer Select Negative Control 2, Ambion, UK). Transient transfection was achieved using the Amaxa Nucleofector II device (Kit V, Program X-001) as per manufacturer’s instructions (Lonza, Switzerland). Following transfection the cells were incubated at 37°C in a 5% (v/v) CO2 in air incubator for 48 hours before being used in motility assays and protein expression assessed via western blot.
Patient material
Use of human tissue had ethical approval from the NRES committee of the regional NHS health research authority (14/LO/0489).Primary MPL W515L positive samples from patients with Essential Thrombocythemia were obtained from the Cambridge Blood and Stem Cell Biobank. The CD34+ population was enriched using CliniMACS (Miltenyi Biotec) according to standard protocols. Control samples were peripheral blood samples obtained from patients with no known diseases. Colony forming assays were performed by plating CD34+ cells in Methylcellulose complete media (R&D systems) supplemented with 2u/ml EPO at a density of 3000cells/ml. Plates were incubated at 370C in 5% CO2 /5% O2 for 7 days before the number of colonies were counted.
conflicts of Interest
The authors declare no conflict of interest.
Grant support
This work was supported by Bloodwise UK (Grant 13005). NCA was sponsored by Majlis Amanah Rakyat and Universiti Kuala Lumpur, Malaysia. Patient material was provided by the Cambridge Blood and Stem Cell Biobank which is supported by the Cambridge NIHR Biomedical Research Centre and the Cambridge Experimental Cancer Medicine Centre UK
References
1. Cleary C and Kralovics R. (2013). Molecular basis and clonal evolution of myeloproliferative neoplasms. Clinical Chemistry and Laboratory Medicine, pp. 1889.
2. Pikman Y, Lee BH, Mercher T, McDowell E, Ebert BL, Gozo M, Cuker A, Wernig G, Moore S, Galinsky I, DeAngelo DJ, Clark JJ, Lee SJ, Golub TR, Wadleigh M, Gilliland DG, et al. MPLW515L is anovel somatic activating mutation in myelofibrosis with myeloid metaplasia. Plos Medicine. 2006; 3:1140-1151.
3. Tefferi A. Primary myelofibrosis: 2012 update on diagnosis, risk stratification, and management. American Journal of Hematology. 2011; 86:1017-1026.
4. Vannucchi AM, Bianchi L, Paoletti F, Pancrazzi A, Torre E, Nishikawa M, Zingariello M, Di Baldassarre A, Rana RA, Lorenzini R, Alfani E, Migliaccio G and Migliaccio AR. A pathobiologic pathway linking thrombopoietin, GATA-1, and TGF-β1 in the development of myelofibrosis. Blood. 2005; 105:3493-3501.
5. Tefferi A, Rumi E, Finazzi G, Gisslinger H, Vannucchi AM, Rodeghiero F, Randi ML, Vaidya R, Cazzola M, Rambaldi A, Gisslinger B, Pieri L, Ruggeri M, Bertozzi I, Sulai NH, Casetti I, et al. Survival and prognosis among 1545 patients with contemporary polycythemia vera: an international study. Leukemia. 2013; 27:1874-1881.
6. Cervantes F, Dupriez B, Pereira A, Passamonti F, Reilly JT, Morra E, Vannucchi AM, Mesa RA, Demory J-L, Barosi G, Rumi E and Tefferi A. New prognostic scoring system for primary myelofibrosis based on a study of the International Working Group for Myelofibrosis Research and Treatment. Blood. 2009; 113:2895-2901.
7. Cervantes F, Tassies D, Salgado C, Rovira M, Pereira A and Rozman C. Acute Transformation in Nonleukemic Chronic Myeloproliferative Disorders: Actuarial Probability and Main Characteristics in a Series of 218 Patients. Acta Haematologica. 1991; 85:124-127.
8. Naka K, Hoshii T, Muraguchi T, Tadokoro Y, Ooshio T, Kondo Y, Nakao S, Motoyama N and Hirao A. TGF- [bgr]-FOXO signalling maintains leukaemia-initiating cells in chronic myeloid leukaemia. Nature. 2010; 463:676-680.
9. Chagraoui H, Komura E, Tulliez M, Giraudier S, Vainchenker W and Wendling F. Prominent role of TGF-β1 in thrombopoietin-induced myelofibrosis in mice. Blood. 2002; 100:3495-3503.
10. Xiu L, Chang N, Yang L, Liu X, Yang L, Ge J and Li L. Intracellular Sphingosine 1-Phosphate Contributes to Collagen Expression of Hepatic Myofibroblasts in Human Liver Fibrosis Independent of Its Receptors. The American Journal of Pathology. 2015; 185:387-398.
11. Juarez JG, Harun N, Thien M, Welschinger R, Baraz R, Dela Pena A, Pitson SM, Rettig M, DiPersio JF, Bradstock KF and Bendall LJ. Sphingosine-1-phosphate facilitates trafficking of hematopoietic stem cells and their mobilization by CXCR4 antagonists in mice. Blood. 2012; 119:707-716.
12. Whetton AD, Lu Y, Pierce A, Carney L and Spooncer E. Lysophospholipids synergistically promote primitive hematopoietic cell chemotaxis via a mechanism involving Vav 1. Blood. 2003; 102:2798-2802.
13. Pierce A, Unwin RD, Evans CA, Griffiths S, Carney L, Zhang L, Jaworska E, Lee C-F, Blinco D, Okoniewski MJ, Miller CJ, Bitton DA, Spooncer E and Whetton AD. Eight-channel iTRAQ Enables Comparison of the Activity of Six Leukemogenic Tyrosine Kinases. Molecular & Cellular Proteomics. 2008; 7:853-863.
14. Unwin RD, Smith DL, Blinco D, Wilson CL, Miller CJ, Evans CA, Jaworska E, Baldwin SA, Barnes K, Pierce A, Spooncer E and Whetton AD. Quantitative proteomics reveals posttranslational control as a regulatory factor in primary hematopoietic stem cells. Blood. 2006; 107:4687-4694.
15. Pierce A, Williamson A, Jaworska E, Griffiths JR, Taylor S, Walker M, O’Dea MA, Spooncer E, Unwin RD, Poolman T, Ray D and Whetton AD. Identification of Nuclear Protein Targets for Six Leukemogenic Tyrosine Kinases Governed by Post-Translational Regulation. PLoS ONE. 2012; 7:e38928.
16. Lu R, Markowetz F, Unwin RD, Leek JT, Airoldi EM, MacArthur BD, Lachmann A, Rozov R, Ma’ayan A, Boyer LA, Troyanskaya OG, Whetton AD and Lemischka IR. Systems-level dynamic analyses of fate change in murine embryonic stem cells. Nature. 2009; 462:358-U126.
17. Pierce A, Carney L, Hamza HG, Griffiths JR, Zhang L, Whetton BA, Sanchez MBG, Tamura T, Sternberg D and Whetton AD. THOC5 spliceosome protein: a target for leukaemogenic tyrosine kinases that affects inositol lipid turnover. British Journal of Haematology. 2008; 141:641-650.
18. Unwin RD, Sternberg DW, Lu YN, Pierce A, Gilliland DG and Whetton AD. Global effects of BCR/ABL and TEL/PDGFR beta expression on the proteome and phosphoproteome - Identification of the rho pathway as a target of BCR/ABL. J Biol Chem. 2005; 280:6316-6326.
19. Griaud F, Pierce A, Sanchez MB, Scott M, Abraham SA, Holyoake TL, Tran DD, Tamura T and Whetton AD. A pathway from leukaemogenic oncogenes and stem cell chemokines to RNA processing via THOC5. Leukemia. 2012; 3:283.
20. Tran DDH, Saran S, Williamson AJK, Pierce A, Dittrich-Breiholz O, Wiehlmann L, Koch A, Whetton AD and Tamura T. THOC5 controls 3′end-processing of immediate early genes via interaction with polyadenylation specific factor 100 (CPSF100). Nucleic Acids Research. 2014; 42:12249-12260.
21. Garcia J, de Gunzburg J, Eychène A, Gisselbrecht S and Porteu F. Thrombopoietin-Mediated Sustained Activation of Extracellular Signal-Regulated Kinase in UT7-Mpl Cells Requires Both Ras-Raf-1- and Rap1-B-Raf-Dependent Pathways. Molecular and Cellular Biology. 2001; 21:2659-2670.
22. Barosi G, Viarengo G, Pecci A, Rosti V, Piaggio G, Marchetti M, Frassoni F and Investigators Italian Registry M. Diagnostic and clinical relevance of the number of circulating CD34(+) cells in myelofibrosis with myeloid metaplasia. Blood. 2001; 98:3249-3255.
23. Irie-Sasaki J, Sasaki T, Matsumoto W, Opavsky A, Cheng M, Welstead G, Griffiths E, Krawczyk C, Richardson CD, Aitken K, Iscove N, Koretzky G, Johnson P, Liu P, Rothstein DM and Penninger JM. CD45 is a JAK phosphatase and negatively regulates cytokine receptor signalling. Nature. 2001; 409:349-354.
24. Carney L, Pierce A, Rijnen M, Gonzalez Sanchez MB, Hamzah HG, Zhang L, Tamura T and Whetton AD. THOC5 couples M-CSF receptor signaling to transcription factor expression. Cellular Signalling. 2009; 21:309-316.
25. Gery S, Gueller S, Chumakova K, Kawamata N, Liu L and Koeffler HP. Adaptor protein Lnk negatively regulates the mutant MPL, MPLW515L associated with myeloproliferative disorders. Blood. 2007; 110:3360-3364.
26. Levine RL, Pardanani A, Tefferi A and Gilliland DG. Role of JAK2 in the pathogenesis and therapy of myeloproliferative disorders. Nat Rev Cancer. 2007; 7:673-683.
27. Okabe S, Tauchi T, Ohyashiki K and Broxmeyer HE. Stromal-cell-derived factor-1/CXCL12-induced chemotaxis of a T cell line involves intracellular signaling through Cbl and Cbl-b and their regulation by Src kinases and CD45. Blood Cells, Molecules, and Diseases. 2006; 36:308-314.
28. Orschell CM, Borneo J, Munugalavadla V, Ma P, Sims E, Ramdas B, Yoder MC and Kapur R. Deficiency of Src family kinases compromises the repopulating ability of hematopoietic stem cells. Experimental Hematology. 2008; 36:655-666.
29. MartyrÉ M-C. TGF-β and Megakaryocytes in the Pathogenesis of Myelofibrosis in Myeloproliferative Disorders. Leukemia & Lymphoma. 1995; 20:39-44.
30. Basu S and Broxmeyer HE. Transforming growth factor-β1 modulates responses of CD34+ cord blood cells to stromal cell-derived factor-1/CXCL12. Blood. 2005; 106:485-493.
31. Radeke HH, von Wenckstern H, Stoidtner K, Sauer B, Hammer S and Kleuser B. Overlapping signaling pathways of sphingosine 1-phosphate and TGF-beta in the murine Langerhans cell line XS52. J Immunol. 2005; 174:2778-2786.
32. Gellings Lowe N, Swaney JS, Moreno KM and Sabbadini RA. Sphingosine-1-phosphate and sphingosine kinase are critical for transforming growth factor-beta-stimulated collagen production by cardiac fibroblasts. Cardiovasc Res. 2009; 82:303-312.
33. Yamanaka M, Shegogue D, Pei H, Bu S, Bielawska A, Bielawski J, Pettus B, Hannun YA, Obeid L and Trojanowska M. Sphingosine kinase 1 (SPHK1) is induced by transforming growth factor-beta and mediates TIMP-1 up-regulation. J Biol Chem. 2004; 279:53994-54001.
34. Miller AV, Alvarez SE, Spiegel S and Lebman DA. Sphingosine Kinases and Sphingosine-1-Phosphate Are Critical for Transforming Growth Factor β-Induced Extracellular Signal-Regulated Kinase 1 and 2 Activation and Promotion of Migration and Invasion of Esophageal Cancer Cells. Molecular and Cellular Biology. 2008; 28:4142-4151.
35. Sukocheva O, Wadham C, Holmes A, Albanese N, Verrier E, Feng F, Bernal A, Derian CK, Ullrich A, Vadas MA and Xia P. Estrogen transactivates EGFR via the sphingosine 1-phosphate receptor Edg-3: the role of sphingosine kinase-1. The Journal of Cell Biology. 2006; 173:301-310.
36. Ratajczak MZ, Lee H, Wysoczynski M, Wan W, Marlicz W, Laughlin MJ, Kucia M, Janowska-Wieczorek A and Ratajczak J. Novel insight into stem cell mobilization-Plasma sphingosine-1-phosphate is a major chemoattractant that directs the egress of hematopoietic stem progenitor cells from the bone marrow and its level in peripheral blood increases during mobilization due to activation of complement cascade/membrane attack complex. Leukemia. 2010; 24:976-985.
37. Yu H, Okada T, Kobayashi M, Abo-Elmatty DM, Jahangeer S and Nakamura S-i. Roles of extracellular and intracellular sphingosine 1-phosphate in cell migration. Genes to Cells. 2009; 14:597-605.
38. Druker BJ, Tamura S, Buchdunger E, Ohno S, Segal GM, Fanning S, Zimmermann J and Lydon NB. Effects of a selective inhibitor of the Abl tyrosine kinase on the growth of Bcr-Abl positive cells. Nature Medicine. 1996; 2:561-566.
39. Bhagwat N, Koppikar P, Keller M, Marubayashi S, Shank K, Rampal R, Qi J, Kleppe M, Patel HJ, Shah SK, Taldone T, Bradner JE, Chiosis G and Levine RL. Improved targeting of JAK2 leads to increased therapeutic efficacy in myeloproliferative neoplasms. Blood. 2014; 123:2075-2083.
40. Koppikar P, Abdel-Wahab O, Hedvat C, Marubayashi S, Patel J, Goel A, Kucine N, Gardner JR, Combs AP, Vaddi K, Haley PJ, Burn TC, Rupar M, Bromberg JF, Heaney ML, de Stanchina E, et al. Efficacy of the JAK2 inhibitor INCB16562 in a murine model of MPLW515L-induced thrombocytosis and myelofibrosis. Blood. 2010; 115:2919-2927.
41. Tefferi A. JAK inhibitors for myeloproliferative neoplasms: clarifying facts from myths. Blood. 2012; 119:2721-2730.
42. Castromalaspina H, Rabellino EM, Yen A, Nachman RL and Moore MAS. Human megakaryocyte stimulation of proliferation of bone marrow fibroblasts Blood. 1981; 57:781-787.
43. Guglielmelli P, Zini R, Bogani C, Salati S, Pancrazzi A, Bianchi E, Mannelli F, Ferrari S, Le Bousse-Kerdiles M-C, Bosi A, Barosi G, Migliaccio AR, Manfredini R and Vannucchi AM. Molecular profiling of CD34(+) cells in idiopathic myelofibrosis identifies a set of disease-associated genes and reveals the clinical significance of Wilms’ tumor gene 1 (WT1). Stem Cells. 2007; 25:165-173.
44. Rosti V, Massa M, Vannucchi AM, Bergamaschi G, Campanelli R, Pecci A, Viarengo G, Meli V, Marchetti M, Guglielmelli P, Bruno E, Xu M, Hoffman R, Barosi G and Investigators Italian R. The expression of CXCR4 is down-regulated on the CD34+cells of patients with myelofibrosis with myeloid metaplasia. Blood Cells Molecules and Diseases. 2007; 38:280-286.
45. Ciurea SO, Merchant D, Mahmud N, Ishii T, Zhao Y, Hu W, Bruno E, Barosi G, Xu M and Hoffman R. Pivotal contributions of megakaryocytes to the biology of idiopathic myelofibrosis. Blood. 2007; 110:986-993.
46. Xu MJ, Bruno E, Chao J, Huang S, Finazzi G, Fruchtman SM, Popat U, Prchal JT, Barosi G, Hoffman R and Consortium MPDR. Constitutive mobilization of CD34(+) cells into the peripheral blood in idiopathic myelofibrosis may be due to the action of a number of proteases. Blood. 2005; 105:4508-4515.
47. Calzada AA, Todoerti K, Donadoni L, Pellicioli A, Tuana G, Gatta R, Neri A, Finazzi G, Mantovani R, Rambaldi A, Introna M, Lombardi L, Golay J and Investigators A. The HDAC inhibitor Givinostat modulates the hematopoietic transcription factors NFE2 and C-MYB in JAK2(V617F) myeloproliferative neoplasm cells. Experimental Hematology. 2012; 40:634-645.
48. Le Bousse-Kerdiles M, Chevillard S, Charpentier A, Romquin N, Clay D, Smadja-Joffe F, Praloran V, Dupriez B, Demory J, Jasmin C and Martyre M. Differential expression of transforming growth factor-beta, basic fibroblast growth factor, and their receptors in CD34+ hematopoietic progenitor cells from patients with myelofibrosis and myeloid metaplasia. Blood. 1996; 88:4534-4546.
49. Guido C, Whitaker-Menezes D, Capparelli C, Balliet R, Lin Z, Pestell RG, Howell A, Aquila S, Ando S, Martinez-Outschoorn U, Sotgia F and Lisanti MP. Metabolic reprogramming of cancer-associated fibroblasts by TGF-beta drives tumor growth Connecting TGF-beta signaling with “Warburg-like” cancer metabolism and L-lactate production. Cell Cycle. 2012; 11:3019-3035.
50. Li QF, Huang WR, Duan HF, Wang H, Wu CT and Wang LS. Sphingosine kinase-1 mediates BCR//ABL-induced upregulation of Mcl-1 in chronic myeloid leukemia cells. Oncogene. 2007; 26:7904-7908.
51. Bonhoure E, Lauret A, Barnes DJ, Martin C, Malavaud B, Kohama T, Melo JV and Cuvillier O. Sphingosine kinase-1 is a downstream regulator of imatinib-induced apoptosis in chronic myeloid leukemia cells. Leukemia. 2008; 22:971-979.
52. Wallington-Beddoe CT, Powell JA, Tong D, Pitson SM, Bradstock KF and Bendall LJ. Sphingosine Kinase 2 Promotes Acute Lymphoblastic Leukemia by Enhancing MYC Expression. Cancer Research. 2014; 74:2803-2815.
53. Jiang P, Smith AD, Li R, Rao JN, Liu L, Donahue JM, Wang J-Y and Turner DJ. Sphingosine kinase 1 overexpression stimulates intestinal epithelial cell proliferation through increased c-Myc translation. Am J Physiol Cell Physiol. 2013; 304:C1187-C1197.
54. Oaks JJ, Santhanam R, Walker CJ, Roof S, Harb JG, Ferenchak G, Eisfeld A-K, Van Brocklyn JR, Briesewitz R, Saddoughi SA, Nagata K, Bittman R, Caligiuri MA, Abdel-Wahab O, Levine R, Arlinghaus RB, et al. Antagonistic activities of the immunomodulator and PP2A-activating drug FTY720 (Fingolimod, Gilenya) in Jak2-driven hematologic malignancies. Blood. 2013; 122:1923-1934.
55. Neviani P, Harb JG, Oaks JJ, Santhanam R, Walker CJ, Ellis JJ, Ferenchak G, Dorrance AM, Paisie CA, Eiring AM, Ma Y, Mao HC, Zhang B, Wunderlich M, May PC, Sun C, et al. PP2A-activating drugs selectively eradicate TKI-resistant chronic myeloid leukemic stem cells. The Journal of Clinical Investigation. 2013; 123:4144-4157.
56. Kendall AC, Pilkington SM, Massey KA, Sassano G, Rhodes LE and Nicolaou A. Distribution of Bioactive Lipid Mediators in Human Skin. J Invest Dermatol. 2015; 135:1510-1520.