
INTRODUCTION
Non-alcoholic fatty liver disease (NAFLD) is the most common form of chronic liver disease. 5% to 42% of the general population in Asian countries and 24% to 42% in Western countries suffer from the disease [1–3]. As is commonly associated with hypertension, obesity, insulin resistance, and dyslipidemia, NAFLD is the result of accumulated hepatic fat without excessive alcohol intake or other causes of liver disease [4, 5]. With NAFLD, patients have a significantly higher risk of death compared with the general population [6, 7]. A large effort has been extended to investigate risk factors associated with NAFLD and recent studies have met with some success which has encouraged further work in this field [8, 9].
High sensitive C reactive protein (hsCRP) is a biomarker of inflammation, which has been noted to predict the prevalence of type 2 diabetes, atherosclerosis and metabolic syndrome (MS) [10–12]. Though NAFLD is a pathologic condition relative to MS, whether hsCRP could function as an independent factor to predict NAFLD is poorly defined. Previously a study has suggested sex differences should be highlighted, although is not adopted in current clinical medical guidelines. Other studies have reported that compared with males, the impact of elevated hsCRP level in cardiovascular disease is likely associated with a worse prognosis in women [13–15].
In this study, we conducted our analyses in the southeast of China to evaluate the relationship between sex-specific hsCRP levels and NAFLD.
RESULTS
Subject characteristics
A total of 23754 subjects were initially enrolled into the study, while only 8618 remained according to exclusion criteria (Figure 1). In the available data, 4304 males and 4314 females were included, with a mean age of 40.9±14.6 years and 37.2±10.5 years, respectively. The median follow-up time was 1100 days in male and 1169 days in female subjects. Baseline characteristics of study subjects are presented in Table 1 according to their quartile measurements of hsCRP. The relationship between hsCRP concentration and prevalence of NAFLD is parabolic rather than linear for extremely low or extremely high level of hsCRP, both of which resulted in higher prevalence of NAFLD. BMI, Cr, TC, TG, SBP, DBP, FPG, BUN, LDL-C were higher, whereas HDL-C was lower, in Q1 and Q4. The proportion of Q1, Q2, Q3, and Q4 in the male group is 11.7%, 29.3%, 29.1% and 29.9%. The proportion of Q1, Q2, Q3, and Q4 in the female group is 16.1%, 52.7%, 18.6% and 12.2%.
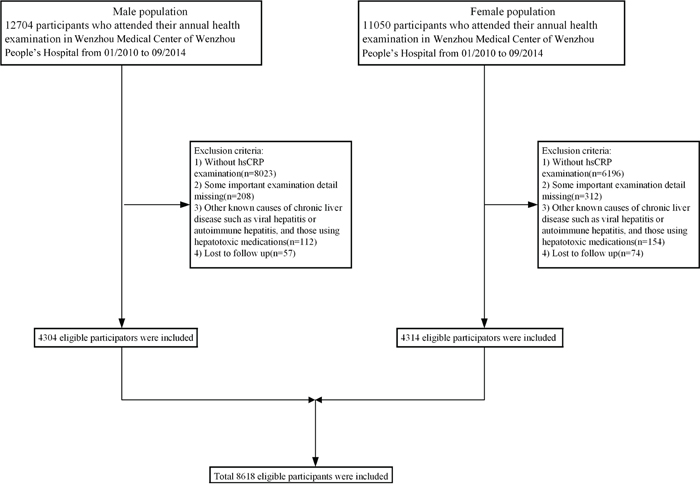
Figure 1: Study flow diagram. A total of 23754 subjects were initially enrolled, while 15136 participants who did not meet the inclusion criteria were excluded. Finally, 60,455 individuals (49,092 in the cross-sectional population and 11,363 in the longitudinal population) were included.
Table 1: Baseline characteristics of 4304 males and 4314 females, stratified by quartiles of hsCRP*
hsCRP quartiles |
||||||
All |
Q1 |
Q2 |
Q3 |
Q4 |
P value |
|
N |
4304 |
502 |
1263 |
1254 |
1285 |
|
4314 |
708 |
2273 |
804 |
528 |
||
hsCRP (mg/L) |
0-25.9 |
0-0.1 |
0.2-0.4 |
0.5-0.8 |
0.9-25.9 |
|
0-28.4 |
0-0.1 |
0.2-0.6 |
0.7-1.2 |
1.3-28.4 |
||
Age (years) |
40.92±14.55 |
38.20±11.32 |
38.63±12.39 |
40.81±14.29 |
44.35±17.02 |
<0.01 |
37.24±10.52 |
34.62±8.36 |
36.24±9.61 |
40.12±11.93 |
40.64±12.64 |
<0.01 |
|
BMI (kg/m2) |
22.63±2.55 |
22.23±2.61 |
22.16±2.48 |
22.78±2.42 |
23.12±2.63 |
<0.01 |
20.72±2.30 |
20.30±2.20 |
20.42±2.11 |
21.18±2.28 |
21.86±2.67 |
<0.01 |
|
Height (m) |
170.33±23.85 |
170.73±5.56 |
170.34±5.64 |
169.90±5.82 |
170.58±42.78 |
<0.01 |
159.33±5.10 |
159.61±4.79 |
159.64±4.98 |
158.83±5.37 |
158.41±5.38 |
<0.01 |
|
Weight (kg) |
65.44±8.27 |
64.85±8.73 |
64.30±7.91 |
65.77±7.98 |
66.45±8.58 |
<0.01 |
52.60±6.29 |
51.74±6.28 |
52.06±6.01 |
53.42±6.26 |
54.84±6.89 |
<0.01 |
|
SBP (mmHg) |
123.92±14.44 |
122.34±13.42 |
122.02±13.28 |
124.13±14.23 |
126.18±15.75 |
<0.01 |
112.21±13.23 |
110.61±12.22 |
111.05±12.54 |
114.64±13.72 |
115.65±15.44 |
<0.01 |
|
DBP (mmHg) |
76.77±10.21 |
76.22±9.76 |
75.98±9.70 |
76.93±10.54 |
77.60±10.48 |
0.88 |
69.37±9.29 |
68.25±8.79 |
68.66±8.90 |
71.24±9.66 |
71.13±10.29 |
0.88 |
|
HDL-C (mmol/L) |
1.31±0.29 |
1.30±0.29 |
1.33±0.28 |
1.31±0.28 |
1.29±0.29 |
<0.01 |
1.53±0.32 |
1.56±0.31 |
1.54±0.32 |
1.51±0.32 |
1.49±0.31 |
<0.01 |
|
LDL-C (mmol/L) |
2.63±0.64 |
2.53±0.61 |
2.58±0.61 |
2.64±0.65 |
2.70±0.65 |
<0.01 |
2.39±0.62 |
2.30±0.59 |
2.35±0.59 |
2.46±0.64 |
2.59±0.68 |
<0.01 |
|
TG (mmol/L) |
1.44±0.91 |
1.36±0.84 |
1.33±0.74 |
1.45±0.88 |
1.55±1.09 |
<0.01 |
0.96±0.54 |
0.89±0.49 |
0.91±0.49 |
1.06±0.63 |
1.11±0.61 |
<0.01 |
|
TC (mmol/L) |
4.58±0.85 |
4.45±0.81 |
4.52±0.81 |
4.61±0.87 |
4.66±0.87 |
<0.01 |
4.48±0.85 |
4.38±0.81 |
4.42±0.82 |
4.58±0.87 |
4.71±0.93 |
<0.01 |
|
Cr (μmol/L) |
93.04±14.60 |
91.42±11.34 |
92.38±12.74 |
92.76±15.46 |
94.58±16.34 |
<0.01 |
67.11±14.18 |
66.76±8.47 |
66.76±8.48 |
67.30±8.98 |
68.78±33.37 |
<0.01 |
|
UA (μmol/L) |
340.39±73.78 |
327.43±68.63 |
335.21±70.50 |
341.21±75.75 |
349.70±75.74 |
<0.01 |
225.31±53.37 |
220.49±53.32 |
222.65±52.59 |
230.01±52.89 |
236.04±55.63 |
<0.01 |
|
FPG (mmol/L) |
5.24±0.83 |
5.16±0.63 |
5.16±0.65 |
5.24±0.86 |
5.33±1.00 |
<0.01 |
5.01±0.47 |
4.97±0.43 |
4.98±0.45 |
5.07±0.51 |
5.06±0.52 |
<0.01 |
|
BUN (mmol/L) |
4.63±1.24 |
4.55±1.20 |
4.54±1.14 |
4.64±1.17 |
4.75±1.39 |
<0.01 |
4.03±1.09 |
3.93±1.03 |
3.99±1.04 |
4.11±1.06 |
4.20±1.35 |
<0.01 |
|
HB (g/L) |
147.79±10.00 |
148.79±9.42 |
148.09±9.30 |
147.81±10.17 |
147.08±10.65 |
<0.01 |
126.38±9.80 |
125.88±9.65 |
126.29±9.83 |
126.49±9.81 |
127.31±9.86 |
<0.01 |
|
BMI = body mass index, BUN = blood urea nitrogen, Cr = creatinine, DBP = diastolic blood pressure, FPG = fasting plasma glucose, HB = hemoglobin, HDL-C = high-density lipoprotein cholesterol, LDL-C= low-density lipoprotein cholesterol, SBP = systolic blood pressure, TC = total cholesterol, TG = triglyceride, UA = uric acid. * In Table 1, the information of male was written in black and the information of female was written in red.
A parabolic relationship between hsCRP level and prevalence of NAFLD is clearly displayed in Tables 2–4. Table 2 shows that 1051 males and 377 females have developed NAFLD. From Q1 to Q4, the incidence ratios were 21.1 (95% CI 17.5 24.7), 18.6 (95% CI 16.5 20.8), 24.8 (95% CI 22.4 27.2) and 31.1 (95% CI 28.5 33.6) in males and 6.2 (95% CI 4.4 8.0), 6.0 (95% CI 5.1 7.1), 11.4 (95% CI 9.2 13.7) and 19.5 (95% CI 16.1 22.9) in females. To obtain further insight into the relationship between hsCRP level and the prevalence of NAFLD, the HRs for NAFLD were calculated after adjusting for confounding variables (Table 3 and Table 4). In male subjects using model 1, compared with the subjects in Q2, the HRs for the subjects in Q1, Q3 and Q4 were 1.70 (95% CI 1.35 2.14), 1.30 (95% CI 1.10 1.54), and 1.54 (95% CI 1.31 1.81), respectively (all P values <0.001). In female subjects using model 1, compared with the subjects in Q2, the HRs for the subjects in Q1, Q3 and Q4 were 1.59 (95% CI 1.13 2.23), 1.87 (95% CI 1.44 2.44) and 3.05 (95% CI 2.37 3.94), respectively (all P values < 0.001). Adjustment for age, BMI, SBP and DBP, using model 2, substantially attenuated the magnitude of the HRs for NAFLD when comparing the first and the forth with the second quartile of hsCRP level. Furthermore, the HRs for NAFLD were 1.63, 1.11 and 1.14 for Q1, Q3, and Q4 in males, and 1.77, 1,22 and 1,36 for Q1, Q3 and Q4, respectively, in the fully adjusted model (model 3). These results suggest that the subjects with extremely high or low hsCRP levels are more likely to develop NAFLD than individuals with moderate hsCRP levels.
Table 2: Adjusted hazard ratio (95% CI)* for non-alcoholic fatty liver disease according to sex specific quartiles of hsCRP
HsCRP quartiles |
Number of subjects |
Person-years |
Number of outcomes |
Incidence ratio (95%CI)* |
Male |
||||
Q1 |
502 |
1324.4 |
106 |
21.1 (17.5-24.7) |
Q2 |
1263 |
3811.8 |
235 |
18.6 (16.5-20.8) |
Q3 |
1254 |
3835.1 |
311 |
24.8 (22.4-27.2) |
Q4 |
1285 |
4069.4 |
399 |
31.1 (28.5-33.6) |
Female |
||||
Q1 |
708 |
1985.1 |
44 |
6.2 (4.4-8.0) |
Q2 |
2273 |
7416.2 |
138 |
6.0 (5.1-7.1) |
Q3 |
804 |
2670.9 |
92 |
11.4 (9.2-13.7) |
Q4 |
528 |
1767.5 |
103 |
19.5 (16.1-22.9) |
CI: confidence incidence. *Incidence rate of outcomes per 1,00 person-years.
Table 3: Association between serum hsCRP concentration and non-alcoholic fatty liver disease development in female population
hsCRP concentration quartiles |
||||
Q1 |
Q2 |
Q3 |
Q4 |
|
708 |
2273 |
804 |
528 |
|
Interquartile range of hsCRP (nmol/L) |
0-0.1 |
0.2-0.6 |
0.7-1.2 |
1.3-28.4 |
Median of hsCRP (nmol/L) |
0.1 |
0.4 |
0.8 |
2.0 |
HR for NAFLD development (95% CI) |
||||
Model 1 |
1.59 (1.13-2.23) |
Ref |
1.87 (1.44-2.44) |
3.05 (2.37-3.94) |
Model 2 |
1.73 (1.23-2.43) |
Ref |
1.31 (1.00-1.71) |
1.56 (1.18-2.05) |
Model 3 |
1.77 (1.25-2.49) |
Ref |
1.22 (0.93-1.59) |
1.36 (1.03-1.80) |
Model 1 is a univariate analysis for hsCRP. Model 2 is adjusted for age, body mass index, systolic blood pressure and diastolic blood pressure. Model 3 is adjusted for age, body mass index, systolic blood pressure, diastolic blood pressure, high-density lipoprotein cholesterol, low-density lipoprotein cholesterol, triglyceride, total cholesterol, creatinine, uric acid, fasting plasma glucose, blood urea nitrogen, hemoglobin, height and weight. CI: confidence incidence.
Table 4: Association between serum hsCRP concentration and non-alcoholic fatty liver disease development in male population
hsCRP concentration quartiles |
||||
Q1 |
Q2 |
Q3 |
Q4 |
|
502 |
1263 |
1254 |
1285 |
|
Interquartile range of hsCRP (nmol/L) |
0-0.1 |
0.2-0.4 |
0.5-0.8 |
0.9-25.9 |
Median of hsCRP (nmol/L) |
0.1 |
0.3 |
0.6 |
1.4 |
HR for NAFLD development (95% CI) |
||||
Model 1 |
1.70 (1.35-2.14) |
Ref |
1.30 (1.10-1.54) |
1.54 (1.31-1.81) |
Model 2 |
1.68 (1.33-2.12) |
Ref |
1.14 (0.96-1.35) |
1.25 (1.06-1.48) |
Model 3 |
1.63 (1.29-2.05) |
Ref |
1.11 (0.93-1.31) |
1.14 (0.97-1.35) |
Model 1 is a univariate analysis for hsCRP. Model 2 is adjusted for age, body mass index, systolic blood pressure and diastolic blood pressure. Model 3 is adjusted for age, body mass index, systolic blood pressure, diastolic blood pressure, high-density lipoprotein cholesterol, low-density lipoprotein cholesterol, triglyceride, total cholesterol, creatinine, uric acid, fasting plasma glucose, blood urea nitrogen, hemoglobin, height and weight. CI: confidence incidence.
Figure 2 shows the HRs for NAFLD of Q1, Q3, and Q4 using the Q2 as the reference. A stratified analysis for risk factors showed a successive increase in HRs for both males and females. Subjects had a significantly higher HRQ1 vs Q2 in males and HRQ4 vs Q2 in females in subgroups wherein BMI <25kg/m2, HDL-C≥1.03mmol/L or ≥1.3mmol/L (female), BP <130/85mmHg, TG<1.7mmol/L, UA<416μmol/L and FPG < 5.6mmol/L, after adjusting for all confounding variables, indicating a stronger association between hsCRP, gender and NAFLD.
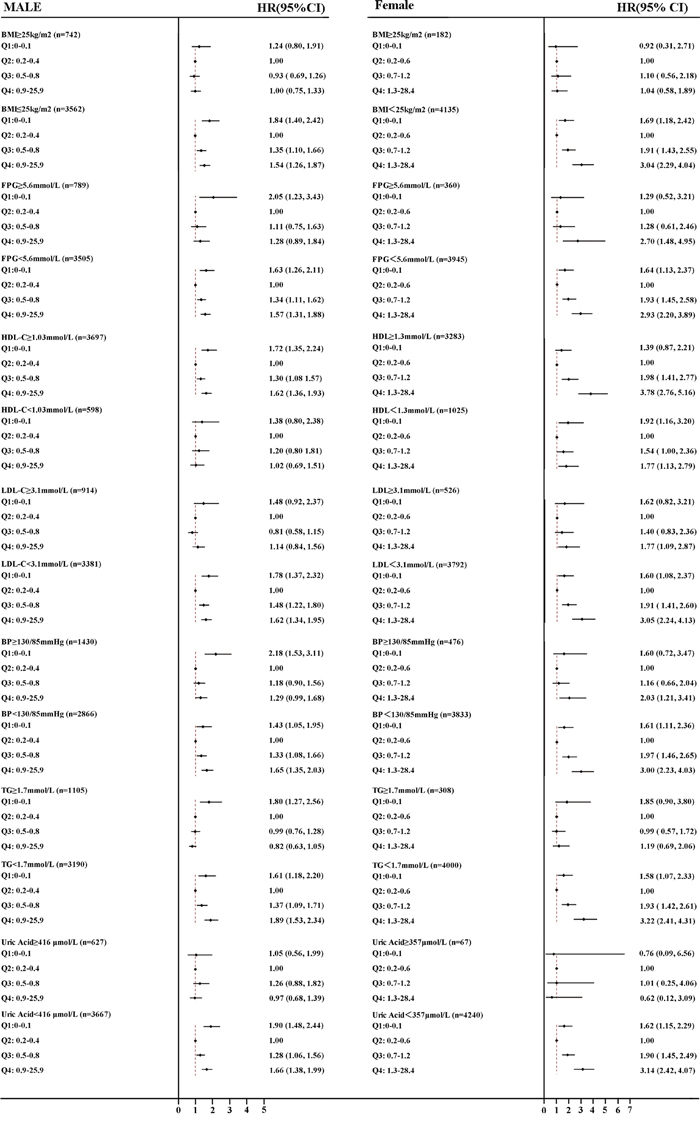
Figure 2: Forest plots of HRs (95% CI) for quartiles of serum high sensitive C reactive protein in the longitudinal population, stratified by sex. A. male B. female. The cut-off points of BMI, FPG, HDL-C, LDL-C, BP, TG and UA were 25 kg/m2, 5.6mmol/L, 1.03/1.3mmol/L, 3.1mmol/L, 130/85mmHg, and 416/357μmol/L, respectively. BMI, body mass index; TG, triglyceride BP, blood pressure; HDL-C, high-density lipoprotein cholesterol; LDL-C, low-density lipoprotein cholesterol, UA, uric acid, FPG, fasting plasma glucose; HR, hazards ratio; CI, confidence interval.
Figure 3 shows the cumulative hazard rate of NAFLD, categorized by sex-specific quartiles of hsCRP. The median follow-up time was 1100 days in male and 1169 days in female. Details on the correlation of quartiles of hsCRP with incident of NAFLD are shown in Figure 3. At the time of the last follow-up, the actuarial incidence of NAFLD from Q1 to Q4 were 21.1%, 18.6%,24.8%, and 31.1% in males and 6.2%, 6.0%, 11.4%, and 19.5% in females, respectively. In Figure 3A, both extremely low (Q1) or extremely high (Q4) levels showed a difference compared with Q2, however in Figure 3B, a high level of hsCRP (Q4) was determined to be a greater risk factor for development of NAFLD. Males have a higher incidence of NAFLD, however, the hsCRP level appeared to increase the development of NAFLD in females by a factor of 3.3-fold actuarial incidence increase (Q4 vs Q2), when compared with a 1.7-fold increase (Q4 vs Q2) in males.
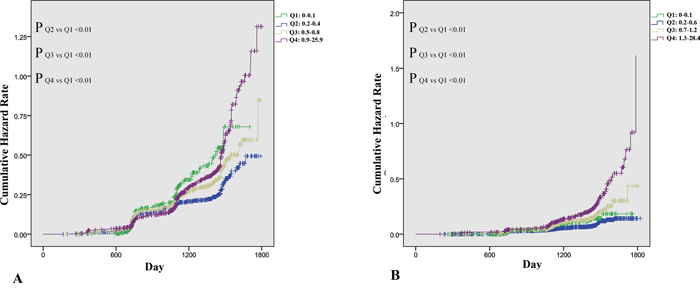
Figure 3: Incidence of nonalcoholic fatty liver disease (NAFLD), stratified by sex-specific quartiles of serum high sensitive C reactive protein. A. Incidence of NAFLD in 4,304 male subjects stratified by quartiles of serum high sensitive C reactive protein. B. Incidence of NAFLD in 4314 female subjects stratified by quartiles of serum high sensitive C reactive protein.
DISCUSSION
This is the first and largest study specifically aimed at evaluating the association between sex-specific hsCRP level and NAFLD in representative sample of Chinese adults. In this study, we performed a prospective longitudinal population analysis that included 8618 initially NAFLD-free subjects. We present stratified data according to sex-specific quartiles and we display significant sex difference in the distribution of hsCRP.
HsCRP is an acute phase protein and it is usually used as a biomarker of inflammation. Recent studies have confirmed that the change of hsCRP level can predict the development of chronic disease. Yasuaki Hayashino demonstrated that the elevation of hsCRP appeared to make a significant contribution to an increased risk of developing type 2 diabetes or atherosclerosis while we observe a parabolic relationship between hsCRP level and the prevalence of NAFLD [10–12]. However, more than half of the hsCRP level of subjects in Yasuaki ’s research was abnormal (hsCRP>3mol/L), while only 4.4 % subjects in our study had abnormal levels of hsCRP [10]. The rare incidence of abnormal hsCRP level in the general population makes it challenging to investigate the regulation of elevated hsCRP. Besides, in those studies, sex difference was not fully considered. According to previous studies and the principle of statistics, we have grouped subjects by gender [16, 17]. Our study demonstrates that associations between hsCRP levels and NAFLD may be applied to both males and females through sex-specific multivariate regression analysis. Though extremely low or high level of hsCRP all contribute to the development of NAFLD. So in addition to common concept that hsCRP lower than 3mg/L is normal, we demonstrate that extremely low hsCRP level for males and extremely low hsCRP level for females, may be associated with a higher additional risk for development of NAFLD.
One potential explanation for this association may be that the results are simply confounded by a shared background of metabolic syndrome [18, 19]. Previous research has suggested that elevation of hsCRP had strong association with development of metabolic syndrome and that in the development of NAFLD, a condition resembles metabolic syndrome, hsCRP can also be elevated for the same reason [20–22]. After adjusting for some features of metabolic syndrome and other known confounding variables, a significantly strong association between hsCRP levels and NAFLD can still be detected. The strong relationship between elevated hsCRP levels and NAFLD indicates that hsCRP overload might play some pathogenic role in the development of NAFLD. Studies have confirmed that hsCRP has a profound pro-inflammatory property [23]. In cultured human umbilical vein endothelial cells, CRP has been shown to induce the expression of ICAM-1 in a manner similar to that observed on stimulation with IL-1β [24]. The finding has been confirmed in a recent clinical research study, which included 1128 subjects from China [11].
However, previous studies have focused on the typical pathological elevated levels of hsCRP and ignored an extremely low hsCRP level. In our study, we discovered the hazard ratio in Q1 is much increased compared with Q2 in both males and females. To date, little attention has been given to discover the association between low level of hsCRP and NAFLD, we can only hypothesize that a certain hsCRP level may protect the organism from NAFLD. Previous studies have shown that CRP could activate complement through the classical activation pathway [25–27]. As the activation of the classical complement pathway by CRP is restricted to its primary stage, it is possible perhaps that CRP may function as a cyto-protective agent in the physiological stage [28]. These previous studies may, at least partially explain why the absence of hsCRP results in high prevalence of NFALD. Though previously noted, the difference in hsCRP levels between the sexes has not been widely clinically acknowledged [13]. However, in our study the difference between the incidence of NAFLD in females and elevated hsCRP was significantly greater than in males (Figure 2), after adjusting for known confounding variables. A further previous study has shown a significantly greater association between baseline CRP and cardiovascular events in females than in males [14]. Besides, in male group, not all hsCRP in Q4 is elevated, while in female group we can observe significant increase. Hormonal differences, such as estrogen functioning as an anti-inflammatory agent, may underlie the potential biochemical mechanism, however, understanding the detailed biochemistry requires further investigation in animal and cell culture models [29, 30].
Some limitations were observed in our study. The main limitation is the lack of anthropometric parameters including lifestyle, central obesity (ie, waist/hip ratio), and dietary factors, which may be helpful to better investigate the relationship between NAFLD and hsCRP levels. Further studies including more detailed personal information are required to advance our findings in this field. Secondly, the diagnosis of NAFLD in our study was based on ultrasonography, which has lower sensitivity and specificity versus liver biopsy. However, as a widely used technique in epidemiological surveys of NAFLD, liver ultrasonography has several strengths, including safety, economical, and practical utility. Thirdly, our subject health details were collected from annual health examination, thus most of our subjects hsCRP levels are normal. How typical pathologic levels of hsCRP stimulate the development of NALFD is a subject for future investigative studies. Fourthly, the accuracy of our hsCRP is 0.1mg/L. Though some articles have used other cut-off values, 0,1mg/L is currently the mostly reliable value used.
In conclusion, we have clearly demonstrated that hsCRP is a vital factor associated with the prevalence and development of NAFLD. Elevated and extremely low hsCRP levels appear to increase the prevalence and incidence of NAFLD in females rather than in males. Ultimately, the change of hsCRP may be indicative of elevated risk of NAFLD in the general population and especially in females.
MATERIALS AND METHODS
Study design
This study is a cohort study aimed at evaluating the prospective association between hsCRP and NAFLD. The population was conducted from 23754 initially fatty liver disease-free individuals who underwent annual health screen in Wenzhou Medical Center of Wenzhou People’s Hospital. The study period was initiated in January 2010 and concluded in September 2014. Before the study was conducted, verbal informed consent was acquired from each subject and the protocol of this study was approved by the ethics committee of Wenzhou People’s Hospital.
Ultrasonography test
The diagnosis of NAFLD was made according to Guidelines for the assessment and management of nonalcoholic fatty liver disease in the Asia-Pacific region [31]. In general, NAFLD can be diagnosed when imaging tests forecast hepatic steatosis, excluding alcohol abuse, viral hepatitis, drug-induced liver disease, and autoimmune liver disease. Hepatic steatosis was defined by the presence of at least 2 of 3 abnormal detections on abdominal ultrasonography: diffusely increased echogenicity (“bright”) liver with liver echogenicity greater than kidney or spleen, vascular blurring, or deep attenuation. Two experienced imaging specialists, blind to study design, were invited to assess abdominal ultrasonography during the ultrasonic examination. If the diagnoses made by the two specialists were in disagreement or indeterminacy, a third specialist was invited.
Data collection
All subjects were instructed to fast overnight and refrain from exercise the previous day before clinical examination and data recording was conducted in the following morning. Medical history and a health habit inventory were recorded by trained medical staff. Blood pressure (BP: SBP and DBP) were measured through noninvasive automated sphygmomanometer (OMRON, Japan) while the subjects sat in a quite environment. Normal BP range was defined less than 130/85 mmHg [3]. Height and weight were measured without shoes or outerwear. The result of weight in kilograms divided by height in meters squared was defined as body mass index (BMI), an index of body fat. Fasting blood samples were collected from antecubital vein and were later used for biochemical measurement analysis without being frozen. The experimental procedures were consistent and the laboratories were certified according to International Organization Standardization. The biochemical measurements included hsCRP, albumin, blood urea nitrogen (BUN), creatinine (Cr), fasting plasma glucose (FPG), HB (hemoglobin), uric acid (UA), total cholesterol (TC), triglyceride (TG), high-density lipoprotein cholesterol (HDL-C), and low-density lipoprotein cholesterol (LDL-C). An automated analyzer (Abbott AxSYM) was used to for all measurements employing standardized methodology. Antinuclear antibody (ANA) was assessed using indirect immunofluorescence. ELISA assays (IEGAN, Freedom evolyzer/150) were used to detect Hepatitis C and human immunodeficiency virus antibodies. Hepatitis B virus serologic markers were detected in each subject (Abbott AxSYM). Anti-liver cytosol antibody Type 1 (anti-LC-1), anti-liver/kidney microsomal antibody Type 1 (anti-LKM-1) and soluble liver antigen/liver pancreas antigen (SLA/LP) were evaluated using immunoblot analysis (Euroimmun, Lubeck, Germany). Clinical, laboratory and ultrasonography tests at follow-up were identical to those used at the start of the study.
Exclusion criteria
Subjects meeting the following criteria were excluded: without hsCRP examination; one or more important examination detail(s) missing; any other known potential causes of chronic liver disease such as viral or autoimmune hepatitis and subjects using hepatotoxic medications, subjects who were lost to follow-up.
Statistical analysis
In a previous study data presented in sex-specific quartiles showed a statistically significant difference in hsCRP between males and females [32]. Quartiles were classified as follows: Q1: 0-0.1, Q2: 0.2-0.4, Q3: 0.5-0.8 and Q4: 0.9-25.9 for male; Q1: 0-0.1, Q2: 0.2-0.6, Q3: 0.7-1.2 and Q4: 1.3-28.4 for female.
In this longitudinal study, hazard ratios (HRs) and 95% confidence intervals (CIs) for NAFLD were calculated based on Cox’s proportional hazards regression. Kaplan-Meier analysis was used to calculate the cumulative hazard of NAFLD during the follow-up, categorized by sex-specific quartiles of hsCRP. Multivariable models were applied to adjust for confounding variables. Model 1 is a univariate analysis for hsCRP. Model 2 is adjusted for age, body mass index, systolic blood pressure and diastolic blood pressure. Model 3 is adjusted for age, body mass index, systolic blood pressure, diastolic blood pressure, high-density lipoprotein cholesterol, low-density lipoprotein cholesterol, triglyceride, total cholesterol, creatinine, uric acid, fasting plasma glucose, blood urea nitrogen, hemoglobin, height and weight.
Continuous variables were summarized as mean ± standard deviation (SD), and categorical variable are presented as counts or percentages (%). The characteristics of the study population stratified by hsCRP quartiles were compared using a 1-way analysis of variance (ANOVA) or Kruskal-Wallis test for continuous variables while χ2 test was used for assessment of categorical variables. All P values are 2-sided, a P value of <0.05 was considered statistically significant and analyses were performed in SPSS version 20.0 (SPSS, Chicago, IL)
ACKNOWLEDGMENTS
Author contributions: Li-Ren Wang: study design, data collection and analysis, interpreted data, drafted the manuscript. Wen-Yue Liu, data analysis and helped to draft the manuscript. Sheng-Jie Wu: data collection and analysis, interpreted data, prepared figures. Gui-Qi Zhu: data collection and analysis. Yi-Qian Lin: data collection. Martin Braddock: helped to draft the manuscript. Dong-Chu Zhang: data collection. Ming-Hua Zheng: study design, study supervision, obtained funding and helped to draft the manuscript. All authors saw and approved the final version of the paper.
FUNDING INFORMATION
This work was supported by grants from the National Natural Science Foundation of China (81500665), Health Bureau of Zhejiang Province (2010KYB070), Research Foundation of Education Bureau of Zhejiang Province (Y201009942) and Project of New Century 551 Talent Nurturing in Wenzhou.
CONFLICTS OF INTEREST
The authors declare no conflicts of interest
Abbreviations
BMI = body mass index, BUN = blood urea nitrogen, CIs = confidence intervals, Cr = creatinine, DBP = diastolic blood pressure, FPG = fasting plasma glucose, hemoglobin = HB, HDL-C = high-density lipoprotein cholesterol, HRs = hazard ratios, hsCRP = high sensitive C reactive protein, LDL-C = low-density lipoprotein cholesterol, NAFLD = non-alcoholic fatty liver disease, UA = uric acid, SBP = systolic blood pressure, TC = total cholesterol, TG = triglyceride.
REFERENCES
1. Amarapurkar DN, Hashimoto E, Lesmana LA, Sollano JD, Chen PJ, Goh KL, Asia-Pacific Working Party on N. How common is non-alcoholic fatty liver disease in the Asia-Pacific region and are there local differences? J Gastroenterol Hepatol. 2007; 22:788-793.
2. Bedogni G, Miglioli L, Masutti F, Tiribelli C, Marchesini G, Bellentani S. Prevalence of and risk factors for nonalcoholic fatty liver disease: the Dionysos nutrition and liver study. Hepatology. 2005; 42:44-52.
3. Fan JG, Saibara T, Chitturi S, Kim BI, Sung JJ, Chutaputti A, Asia-Pacific Working Party for N. What are the risk factors and settings for non-alcoholic fatty liver disease in Asia-Pacific? J Gastroenterol Hepatol. 2007; 22:794-800.
4. Day CP, Saksena S. Non-alcoholic steatohepatitis: definitions and pathogenesis. J Gastroenterol Hepatol. 2002; 17:S377-384.
5. Jian-gao F, Chinese Liver Disease A. Guidelines for management of nonalcoholic fatty liver disease: an updated and revised edition. Zhonghua Gan Zang Bing Za Zhi. 2010; 18:163-166.
6. Ekstedt M, Hagstrom H, Nasr P, Fredrikson M, Stal P, Kechagias S, Hultcrantz R. Fibrosis stage is the strongest predictor for disease-specific mortality in NAFLD after up to 33 years of follow-up. Hepatology. 2015; 61:1547-1554.
7. Zoppini G, Fedeli U, Gennaro N, Saugo M, Targher G, Bonora E. Mortality from chronic liver diseases in diabetes. Am J Gastroenterol. 2014; 109:1020-1025.
8. Sun DQ, Wu SJ, Liu WY, Lu QD, Zhu GQ, Shi KQ, Braddock M, Song D, Zheng MH. Serum uric acid: a new therapeutic target for nonalcoholic fatty liver disease. Expert Opin Ther Targets. 2015:1-13.
9. Wu SJ, Zhu GQ, Ye BZ, Kong FQ, Zheng ZX, Zou H, Shi KQ, Lin L, Braddock M, Huang WJ, Chen YP, Zheng MH. Association between sex-specific serum uric acid and non-alcoholic fatty liver disease in Chinese adults: a large population-based study. Medicine (Baltimore). 2015; 94:e802.
10. Hayashino Y, Mashitani T, Tsujii S, Ishii H. Serum high-sensitivity C-reactive protein levels are associated with high risk of development, not progression, of diabetic nephropathy among Japanese type 2 diabetic patients: a prospective cohort study (Diabetes Distress and Care Registry at Tenri [DDCRT7]). Diabetes Care. 2014; 37:2947-2952.
11. Bi Y, Min M, Shen W, Deng P, Du Q, Dong M, Liu Y. Prognostic value of high sensitivity C-reaction protein in non-insulin dependent diabetes mellitus patients with non-alcoholic fatty liver disease. Int J Clin Exp Pathol. 2015; 8:8494-8499.
12. Al Rifai M, Silverman MG, Nasir K, Budoff MJ, Blankstein R, Szklo M, Katz R, Blumenthal RS, Blaha MJ. The association of nonalcoholic fatty liver disease, obesity, and metabolic syndrome, with systemic inflammation and subclinical atherosclerosis: the Multi-Ethnic Study of Atherosclerosis (MESA). Atherosclerosis. 2015; 239:629-633.
13. Delongui F, Kallaur AP, Oliveira SR, Bonametti AM, Grion CM, Morimoto HK, Simao AN, Magalhaes GG, Reiche EM. Serum levels of high sensitive C reactive protein in healthy adults from southern Brazil. J Clin Lab Anal. 2013; 27:207-210.
14. Thorand B, Baumert J, Doring A, Herder C, Kolb H, Rathmann W, Giani G, Koenig W, Group K. Sex differences in the relation of body composition to markers of inflammation. Atherosclerosis. 2006; 184:216-224.
15. Antony B, Venn A, Cicuttini F, March L, Blizzard L, Dwyer T, Cross M, Jones G, Ding C. Body composition, hormonal and inflammatory factors are associated with tibial cartilage volume in young adults and contribute to the sex difference in cartilage volume. Arthritis Care Res (Hoboken). 2015.
16. Hayashino Y, Mashitani T, Tsujii S, Ishii H, Diabetes D, Care Registry at Tenri Study G. Serum high-sensitivity C-reactive protein levels are associated with high risk of development, not progression, of diabetic nephropathy among Japanese type 2 diabetic patients: a prospective cohort study (Diabetes Distress and Care Registry at Tenri [DDCRT7]). Diabetes Care. 2014; 37:2947-2952.
17. Ridker PM. Cardiology Patient Page. C-reactive protein: a simple test to help predict risk of heart attack and stroke. Circulation. 2003; 108:e81-85.
18. Rasouli M, Kiasari AM. Interactions of serum hsCRP with apoB, apoB/AI ratio and some components of metabolic syndrome amplify the predictive values for coronary artery disease. Clin Biochem. 2006; 39:971-977.
19. Santaniemi M, Ukkola O, Malo E, Bloigu R, Kesaniemi YA. Metabolic syndrome in the prediction of cardiovascular events: the potential additive role of hsCRP and adiponectin. Eur J Prev Cardiol. 2014; 21:1242-1248.
20. Abu-Farha M, Behbehani K, Elkum N. Comprehensive analysis of circulating adipokines and hsCRP association with cardiovascular disease risk factors and metabolic syndrome in Arabs. Cardiovascular diabetology. 2014; 13:76.
21. Kwasniewska M, Kozinska J, Dziankowska-Zaborszczyk E, Kostka T, Jegier A, Rebowska E, Orczykowska M, Leszczynska J, Drygas W. The impact of long-term changes in metabolic status on cardiovascular biomarkers and microvascular endothelial function in middle-aged men: a 25-year prospective study. Diabetol Metab Syndr. 2015; 7:81.
22. Yan YZ, Ma RL, Ding YS, Guo H, Zhang JY, Mu LT, Zhang M, Liu JM, Rui DS, He J, Sun F, Wang K, Guo SX. Association of Inflammation with Metabolic Syndrome among Low-Income Rural Kazakh and Uyghur Adults in Far Western China. Mediators of inflammation. 2015; 2015:706768.
23. Yeh ET. CRP as a mediator of disease. Circulation. 2004; 109:Ii11-14.
24. Pasceri V, Willerson JT, Yeh ET. Direct proinflammatory effect of C-reactive protein on human endothelial cells. Circulation. 2000; 102:2165-2168.
25. de Carvalho JF, Hanaoka B, Szyper-Kravitz M, Shoenfeld Y. C-Reactive protein and its implications in systemic lupus erythematosus. Acta Reumatol Port. 2007; 32:317-322.
26. Eisenhardt SU, Thiele JR, Bannasch H, Stark GB, Peter K. C-reactive protein: how conformational changes influence inflammatory properties. Cell Cycle. 2009; 8:3885-3892.
27. Mold C, Gewurz H, Du Clos TW. Regulation of complement activation by C-reactive protein. Immunopharmacology. 1999; 42:23-30.
28. Volanakis JE. Complement activation by C-reactive protein complexes. Ann N Y Acad Sci. 1982; 389:235-250.
29. Zolin SJ, Vodovotz Y, Forsythe RM, Rosengart MR, Namas R, Brown JB, Peitzman AP, Billiar TR, Sperry JL. The early evolving sex hormone environment is associated with significant outcome and inflammatory response differences after injury. J Trauma Acute Care Surg. 2015; 78:451-457; discussion 457-458.
30. Baldani DP, Skrgatic L, Cerne JZ, Oguic SK, Gersak BM, Gersak K. Association between serum levels and pentanucleotide polymorphism in the sex hormone binding globulin gene and cardiovascular risk factors in females with polycystic ovary syndrome. Mol Med Rep. 2015; 11:3941-3947.
31. Farrell GC, Chitturi S, Lau GK, Sollano JD and Asia-Pacific Working Party on N. Guidelines for the assessment and management of non-alcoholic fatty liver disease in the Asia-Pacific region: executive summary. J Gastroenterol Hepatol. 2007; 22:775-777.
32. Wu S, Li Y, Jin C, Yang P, Li D, Li H, Shen C. Intra-individual variability of high-sensitivity C-reactive protein in Chinese general population. Int J Cardiol. 2012; 157:75-79.