
INTRODUCTION
Anemia is a common clinical condition in malignancy [1], which may result from blood loss [1], impaired erythropoiesis due to inadequate production or efficacy of erythropoietin [2, 3], decreased availability of iron [1, 4, 5] or from decreased life span of circulating erythrocytes [6]. The anemia is further confounded by the effects of cytostatic treatment [7, 8].
In theory, anemia of malignancy could result from accelerated suicidal cell death or eryptosis [6], which is characterized by cell shrinkage [9] and cell membrane scrambling with exposure of phosphatidylserine at the cell surface [10]. Phosphatidylserine exposing erythrocytes are recognized by phagocytosing cells, engulfed and thus cleared from circulating blood [9, 10].
Signaling eventually leading to eryptosis includes oxidative stress [9, 11–13], increase of cytosolic Ca2+ activity ([Ca2+]i) [14], ceramide formation [9], energy depletion [15] and caspase activation [9]. Eryptosis may be triggered by activation of casein kinase 1α, CDK4, or p38 kinase and by pharmacological or genetic knockout of AMP-activated kinase AMPK, cGMP-dependent protein kinase as well as sorafenib- and sunitinib-sensitive kinases [9].
Eryptosis is enhanced in several clinical conditions, such as sepsis, malaria, sickle cell disease, Wilson’s disease, iron deficiency, metabolic syndrome, diabetes, hepatic, cardiac and renal failure, Hemolytic Uremic Syndrome, as well as dehydration [9, 10, 16–18]. According to animal experiments, eryptosis is similarly upregulated in malignancy [6].
The present study explored, whether and how eryptosis is enhanced in lung cancer (LC). To this end, blood was drawn from patients with LC with and without cytostatic treatment and from healthy volunteers and phosphatidylserine surface abundance, cell volume, reactive oxygen species (ROS), [Ca2+]i, and ceramide abundance determined.
RESULTS
The present study explored whether patients with lung cancer suffer from anemia and, if so, whether the anemia could be partially due to enhanced eryptosis. Table 1 lists the clinical characteristics including the age, sex and diagnosis for each patient. Table 2 provides various blood chemistry parameters from patients without (Group I) and with (Group II) cytostatic treatment as well as healthy volunteers.
Table 1: Clinical diagnosis of patients studied, with and without cytostatic treatment
Number |
Age |
Sex |
Clinical diagnosis |
Treatment |
|---|---|---|---|---|
1 |
63 |
m |
Small cell lung cancer, |
Carboplatin/Etoposide |
2 |
66 |
m |
Non small cell lung cancer, |
Cisplatin/Gemcitabine |
3 |
52 |
m |
Non small cell lung cancer, |
Cisplatin/Vinorelbine |
4 |
52 |
f |
Non small cell lung cancer, |
Cisplatin/Gemcitabine |
5 |
62 |
m |
Non small cell lung cancer, |
Cisplatin/Vinorelbine |
6 |
56 |
m |
Non small cell lung cancer, |
Docetaxel |
7 |
64 |
m |
Small cell lung cancer |
Carboplatin/Etoposide |
8 |
66 |
f |
Non small cell lung cancer |
Carboplatin/Gemcitabine |
9 |
53 |
f |
Non small cell lung cancer, |
Carboplatin/Vinorelbine |
10 |
77 |
m |
Non small cell lung cancer, |
Carboplatin/Gemcitabine |
11 |
81 |
f |
Small cell lung cancer, |
Carboplatin/Etoposide |
12 |
60 |
m |
Small cell lung cancer, |
No cytostatic treatment |
13 |
71 |
f |
Non small cell lung cancer, |
No cytostatic treatment |
14 |
74 |
m |
Non small cell lung cancer, |
No cytostatic treatment |
15 |
59 |
m |
Non small cell lung cancer, |
No cytostatic treatment |
16 |
63 |
f |
Non small cell lung cancer, |
No cytostatic treatment |
17 |
85 |
m |
Non small cell lung cancer, |
No cytostatic treatment |
Table 2: Characteristics of patients and healthy volunteers
|
Healthy volunteers |
Patients without |
Patients with cytostatic treatment |
P-value |
|---|---|---|---|---|
Mean age (years) |
57.1 ± 1.8 |
68.7 ± 4.1 |
63.0 ± 2.9 |
0.0073** (A vs. B) |
Sex |
11 males |
4 males |
7 males |
|
Plasma creatinine concentration |
0.5-0.8 (female) |
0.6 ± 0.04 |
0.8 ± 0.07 |
0.1159 (B vs. C) |
Plasma uric acid |
2.4-5.7 (female) |
5.4 ± 0.7 |
5.7 ± 0.5 |
0.7789 (B vs. C) |
Plasma ferritin concentration |
1.0-20 (female) |
n.a. |
44 ± 26.4 |
n.a. |
Red blood cell distribution width |
< 14 |
14.0 ± 1.2 |
16.8 ± 0.7 |
0.059 (B vs. C) |
Erythrocytes |
5.2 ± 0.1 |
4.2 ± 0.2 |
3.1 ± 0.1 |
<0.001*** (A vs. B) |
Hematocrit (%) |
43.6 ± 0.9 |
37.0 ± 2.0 |
28.7 ± 1.4 |
0.0018** (A vs. B) |
Hemoglobin (g/dl) |
14.5 ± 0.4 |
12.4 ± 0.7 |
9.6 ± 0.4 |
0.0103* (A vs. B) |
Reticulocytes (%) |
1.4 ± 0.1 |
1.8 ± 0.3 |
3.0 ± 0.6 |
0.381 (A vs .B) |
Mean Corpuscular Volume (fl) |
84.7 ± 1.4 |
88.8 ± 1.2 |
91.5 ± 1.0 |
0.0929 (A vs. B) |
MCH |
27.0-34.0 |
29.7 ± 0.6 |
30.6 ± 0.3 |
0.175 (B vs. C) |
MCHC |
32.0-36.0 |
33.4 ± 0.4 |
33.4 ± 0.3 |
0.9094 (B vs. C) |
Plasma total protein |
6.5-8.5 |
7.4 ± 0.2 |
7.0 ± 0.1 |
0.2007 (B vs. C) |
C-reactive protein |
< 0.5 |
4.4 ± 2.4 |
3.0 ± 1.1 |
0.5253 (B vs. C) |
Leucocytes |
3800-10300 |
7607 ± 776.8 |
8839 ± 3285 |
0.7901 (B vs. C) |
Lymphocytes |
20-45 |
19.2 ± 2.1 |
23.9 ± 5.4 |
0.5825 (B vs. C) |
Monocytes |
2-8 |
8.2 ± 0.8 |
7.0 ± 1.1 |
0.4664 (B vs. C) |
Thrombocytes |
150-450 |
317 ± 52.9 |
277.9 ± 43.2 |
0.5878 (B vs. C) |
Values of healthy individuals and patients are given as arithmetic mean ± SEM. Values without SEM in Table 2 reflect standard clinical reference values and do not represent data from healthy controls. * (P<0.05), ** (P<0.01), *** (P<0.001) indicates significant difference from the healthy control group; ## (P<0.01) indicates significant difference from Pat. Group I.
As illustrated in Figure 1, all LC patients in Group II had a hemoglobin level lower than 11 g/dl, an erythrocyte count of less than 3.5x10³/μl, and/or a packed cell volume lower than 34%, and were, thus, anemic. Group I had a significantly higher hemoglobin level (Figure 1A, 29.2%), a higher erythrocyte count (Figure 1B, 35.5%) and a higher packed cell volume (Figure 1C, 28.9%) as compared to Group II. However, all three parameters were still significantly lower in Group I as compared to the healthy volunteers. None of the healthy individuals was anemic. Mean corpuscular volume was slightly but significantly enhanced in LC patients receiving cytostatic treatment (Figure 1D, 8.0% versus controls). As shown in Figure 1E, the anemia of the patients was paralleled by significantly enhanced reticulocytosis in Group II (114.3% versus controls), an observation pointing to enhanced erythrocyte turnover. Furthermore, a negative correlation was observed between the percentage of reticulocytes in LC patients and hemoglobin level, erythrocyte count, as well as packed cell volume (Figure 1F, 1G and 1H).
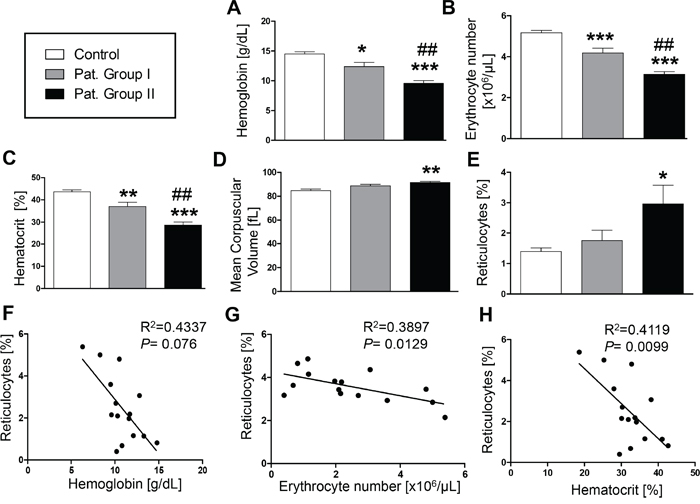
Figure 1: Effect of lung cancer on erythrocyte blood parameters. A–E. Arithmetic means ± SEM of (A) hemoglobin concentration, (B) erythrocyte count, (C) hematocrit, (D) mean corpuscular volume and (E) percentage of reticulocytes in blood drawn from healthy volunteers (n=15, white bars) and patients without (n=6, gray bars) and with (n=11, black bars) cytostatic treatment. * (P<0.05), ** (P<0.01) and *** (P<0.001) significant difference from healthy volunteers (unpaired t test), ## (P<0.01) significant difference from patients without cytostatic treatment (unpaired t test). F-H. Reticulocyte number as a function of (F) hemoglobin concentration (g/dL) (P=0.076, R2=0.4337), (G) erythrocyte number (P=0.0129, R2=0.3897), and (H) hematocrit (P= 0.0099, R2= 0.4119) in lung cancer patients.
Further analysis addressed the possibility that the anemia was paralleled by and possibly due to accelerated eryptosis. In order to identify PS exposing erythrocytes, confocal microscopy was employed to detect annexin V positive erythrocytes. As depicted in Figure 2A, the number of annexin V positive erythrocytes was higher in freshly drawn blood from LC patients of Group I as compared to blood drawn from healthy volunteers. PS exposure was subsequently quantified in FACS analysis utilizing binding of FITC-labeled Annexin V. As shown in Figure 2B and 2C, the percentage of erythrocytes binding annexin V was significantly higher in freshly drawn blood from Group I (by 95.9%) and Group II (by 135.7%) as compared to blood drawn from healthy volunteers. As illustrated in Figure 2D, the percentage of annexin V binding cells was higher in lung cancer patients than in healthy volunteers irrespective of age.
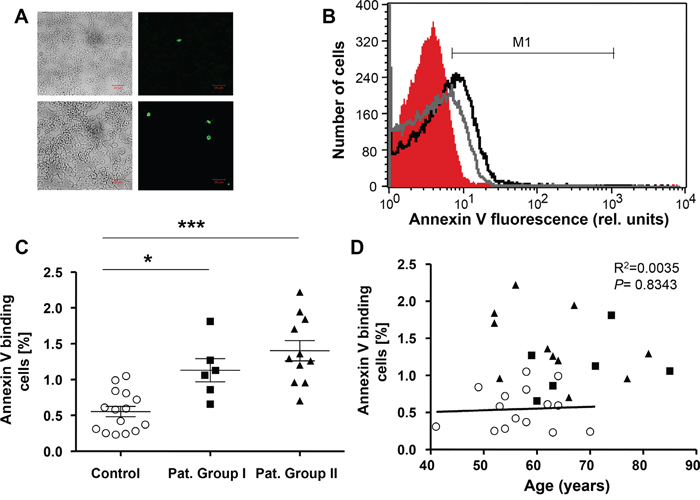
Figure 2: Phosphatidylserine exposure of erythrocytes drawn from patients without and with cytostatic treatment and healthy volunteers. A. Confocal images of FLUOS-dependent fluorescence and light microscopy of human erythrocytes stained with FLUOS-conjugated annexin V. The specimens were obtained from healthy volunteers (Control; upper panels) and from lung cancer patients without cytostatic treatment (group I; lower panels). B. Original representative histogram of annexin V binding of erythrocytes in freshly drawn blood from healthy volunteers (red shadow) and from patients without (gray line) and with (black line) cytostatic treatment. M1 indicates the annexin V fluorescence defining the percentage of annexin V binding erythrocytes. C. Arithmetic means ± SEM of the percentage of annexin V-binding erythrocytes in freshly drawn blood from healthy volunteers (n=15, Control, open circles) and patients without (n=6, closed squares) and with (n=11, closed triangles) cytostatic treatment. * (P<0.05) and *** (P<0.001) significant difference from healthy volunteers (Mann Whitney test). D. Percentage of Annexin V binding erythrocytes in healthy individuals (open circles) and lung cancer patients of group I (n=6, closed squares) and group II (n=11, closed triangles) as a function of age. The regression line shown is calculated for healthy individuals (P=0.8343, R2=0.0035).
In order to test whether eryptosis was stimulated by a blood-borne component, erythrocytes from healthy volunteers were incubated in plasma drawn from either patients or healthy volunteers. As a result, the percentage of PS exposing erythrocytes drawn from healthy individuals tended to be higher following incubation in plasma from Group I and was significantly increased (by 59.6%) following incubation in plasma from Group II (Figure 3A and 3B).
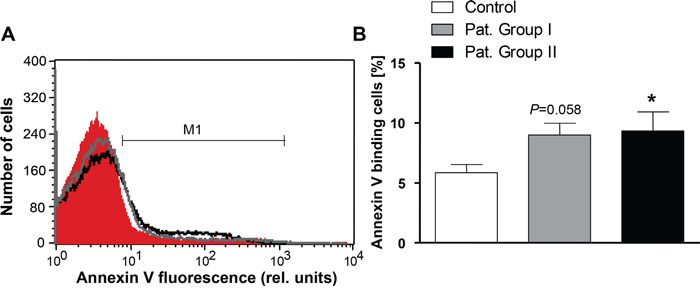
Figure 3: Effect of patient plasma on phosphatidylserine exposure in erythrocytes from healthy volunteers. A. Original representative histogram of annexin V binding of erythrocytes from healthy volunteers following a 24 h exposure to plasma from healthy volunteers (red shadow) and to plasma from patients without (gray line) and with (black line) cytostatic treatment. M1 indicates the annexin V fluorescence defining the percentage of annexin V binding erythrocytes. B. Arithmetic means ± SEM of the percentage of annexin V-binding erythrocytes from healthy volunteers following a 24 h exposure to plasma from healthy volunteers (n=15, white bar) and to plasma from patients without (n=6, gray bar) and with (n=11, black bar) cytostatic treatment. * (P<0.05) significant difference from healthy volunteers (unpaired t test).
In order to estimate cell volume, forward scatter was determined by flow cytometry. As illustrated in Figure 4, the average forward scatter of freshly drawn erythrocytes from Group I as well as the forward scatter of healthy erythrocytes exposed for 24 h to plasma from Group I tended to be lower as compared to the average forward scatter of erythrocytes freshly drawn from healthy volunteers or erythrocytes exposed for 24 h to plasma from healthy volunteers. The average forward scatter of freshly drawn erythrocytes from Group II or exposed for 24 h to plasma from Group II, however, was slightly but significantly larger (by 3.5% in freshly drawn erythrocytes and by 14.2% in plasma) as compared to erythrocytes from healthy volunteers and those which were exposed for 24 h to plasma from healthy volunteers (Figure 4).
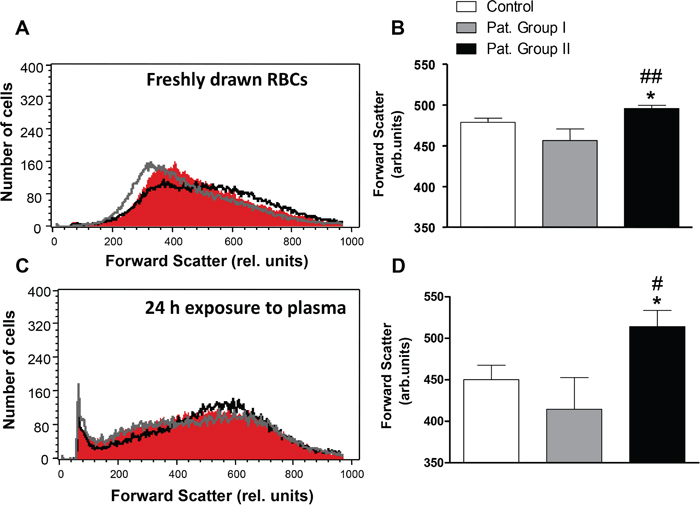
Figure 4: Effect of lung cancer on erythrocyte forward scatter. A. Original representative histogram of forward scatter of erythrocytes in freshly drawn blood from healthy volunteers (red shadow) and from patients without (gray line) and with (black line) cytostatic treatment. B. Arithmetic means ± SEM of forward scatter geometric mean of erythrocytes in freshly drawn blood from healthy volunteers (n=15, white bar) and from patients without (n=6, gray bar) and with (n=11, black bar) cytostatic treatment. * (P<0.05) significant difference from healthy volunteers. ## (P<0.01) significant difference from patients without cytostatic treatment. C. Original representative histogram of forward scatter of erythrocytes from healthy volunteers following a 24 h exposure to plasma from healthy volunteers (n=15, red shadow) and to plasma from patients without (gray line) and with (black line) cytostatic treatment. D. Arithmetic means ± SEM of forward scatter geometric mean of erythrocytes from healthy volunteers following a 24 h exposure to plasma from healthy volunteers (n=15, white bar) and to plasma from patients without (n=6, gray bar) and with (n=11, black bar) cytostatic treatment. * (P<0.05) significant difference from healthy volunteers. # (P<0.05) significant difference from patients without cytostatic treatment (unpaired t test).
Triggers of eryptosis include increase in erythrocyte Ca2+ concentration ([Ca2+]i). Accordingly, Fluo3 fluorescence was employed to quantify [Ca2+]i in freshly drawn blood from patients and healthy volunteers. As illustrated in Figure 5A and 5B, the Fluo3 fluorescence in erythrocytes freshly drawn was not significantly different between healthy volunteers and patients from Group I and Group II. Moreover, Fluo3 fluorescence in erythrocytes exposed for 24 h to plasma from Group I or Group II was not significantly different to Fluo3 fluorescence in erythrocytes exposed for 24 h to plasma from healthy volunteers (Figure 5C and 5D).
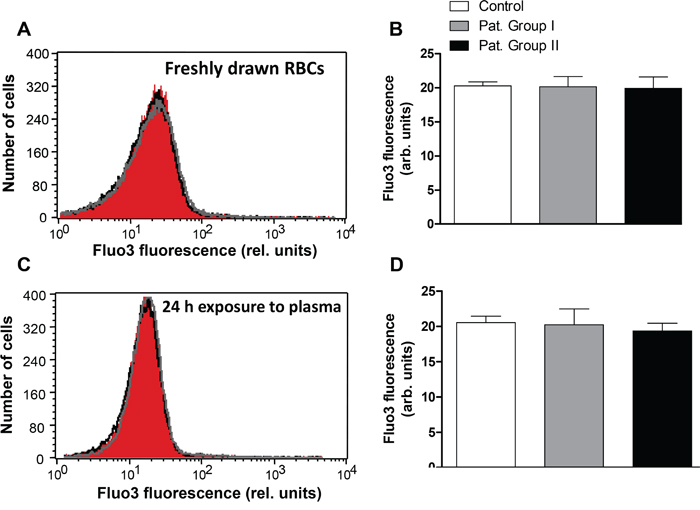
Figure 5: Effect of lung cancer on intracellular Ca2+ activity of erythrocytes. A. Original representative histogram of Fluo3 fluorescence of erythrocytes in freshly drawn blood from healthy volunteers (red shadow) and from patients without (gray line) and with (black line) cytostatic treatment. B. Arithmetic means ± SEM of Fluo3 fluorescence of erythrocytes in freshly drawn blood from healthy volunteers (n=15, white bar) and from patients without (n=6, gray bar) and with (n=11, black bar) cytostatic treatment. C. Original representative histogram of Fluo3 fluorescence of erythrocytes from healthy volunteers following a 24 h exposure to plasma from healthy volunteers (red shadow) and to plasma from patients without (gray line) and with (black line) cytostatic treatment. D. Arithmetic means ± SEM of Fluo3 fluorescence of erythrocytes from healthy volunteers following a 24 h exposure to plasma from healthy volunteers (n=15, white bar) and to plasma from patients without (n=6, gray bar) and with (n=11, black bar) cytostatic treatment (unpaired t test).
Stimulators of cell membrane scrambling without increase of [Ca2+]i include ceramide. Thus, an additional series of experiments explored, whether ceramide abundance at the erythrocyte surface is different in patients and in healthy volunteers. Ceramide abundance was visualized utilizing FITC-labeled antibodies. As illustrated in Figure 6A and 6B, the ceramide abundance tended to be higher in erythrocytes drawn from Group I and was significantly higher (by 39.9 %) in erythrocytes drawn from Group II in comparison to erythrocytes drawn from healthy volunteers. In order to test whether ceramide abundance is induced by a blood-borne component, erythrocytes from healthy volunteers were incubated in plasma drawn from either, patients or healthy volunteers. As a result, the ceramide abundance in erythrocytes following 24 h exposure to plasma from Group I tended to be higher and was significantly increased (by 31.7%) following exposure to plasma from Group II in comparison to erythrocytes exposed to plasma from healthy volunteers (Figure 6C and 6D).
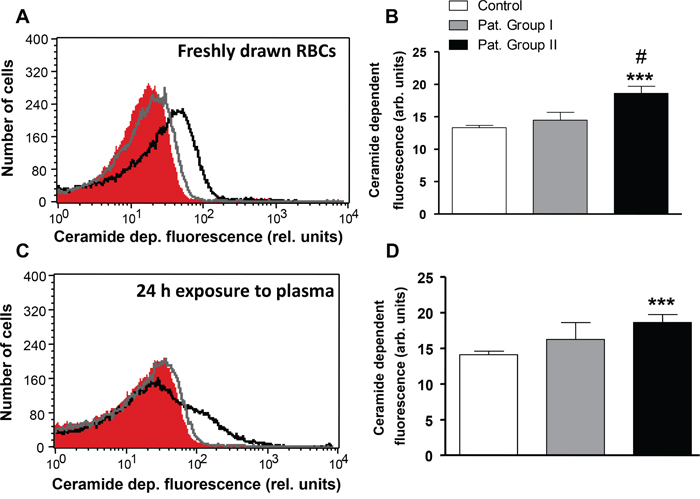
Figure 6: Effect of lung cancer on erythrocyte ceramide abundance. A. Original representative histogram of ceramide-dependent FITC fluorescence of erythrocytes in freshly drawn blood from healthy volunteers (red shadow) and from patients without (gray line) and with (black line) cytostatic treatment. B. Arithmetic means ± SEM of ceramide-dependent FITC fluorescence of erythrocytes in freshly drawn blood from healthy volunteers (n=15, white bar) and from patients without (n=6, gray bar) and with (n=11, black bar) cytostatic treatment. *** (P<0.001) significant difference from healthy volunteers. # (P<0.05) significant difference from patients without cytostatic treatment. C. Original representative histogram of ceramide-dependent FITC fluorescence of erythrocytes from healthy volunteers following a 24 h exposure to plasma from healthy volunteers (red shadow) and to plasma from patients without (gray line) and with (black line) cytostatic treatment. D. Arithmetic means ± SEM of ceramide-dependent FITC of erythrocytes from healthy volunteers following a 24 h exposure to plasma from healthy volunteers (n=15, white bar) and to plasma from patients without (n=6, gray bar) and with (n=11, black bar) cytostatic treatment. *** (P<0.001) significant difference from healthy volunteers (unpaired t test).
Eryptosis is further induced by oxidative stress. Accordingly, reactive oxygen species (ROS) abundance was determined utilizing 2’,7’-dichlorodihydrofluorescein diacetate (DCFDA) fluorescence. As shown in Figure 7A and 7B, the DCFDA-fluorescence was significantly higher (by 20.9%) in erythrocytes freshly drawn from Group II, but not Group I, as compared to erythrocytes drawn from healthy volunteers. In order to test whether oxidative stress is induced by a blood-borne component, erythrocytes from healthy volunteers were incubated in plasma drawn from either, patients or healthy volunteers. As a result, the DCFDA fluorescence in erythrocytes exposed to plasma from Group II, but not Group I, was significantly higher (by 52.9 %) as compared to erythrocytes exposed to plasma from healthy volunteers (Figure 7C and 7D).
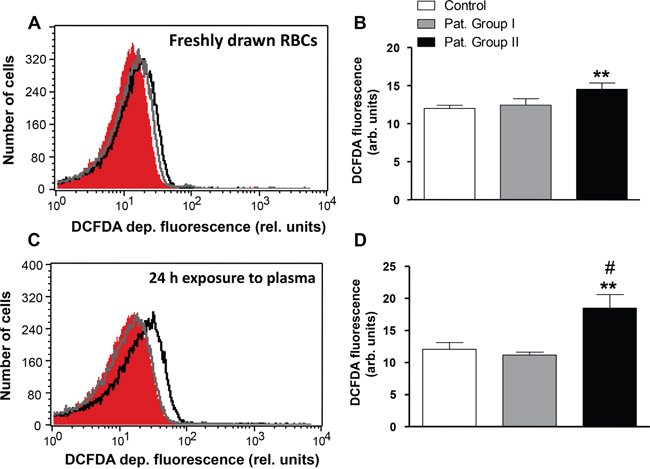
Figure 7: Effect of lung cancer on generation of reactive oxygen species in erythrocytes. A. Original representative histogram of DCFDA fluorescence of erythrocytes in freshly drawn blood from healthy volunteers (red shadow) and from patients without (gray line) and with (black line) cytostatic treatment. B. Arithmetic means ± SEM of DCFDA fluorescence of erythrocytes in freshly drawn blood from healthy volunteers (n=15, white bar) and from patients without (n=6, gray bar) and with (n=11, black bar) cytostatic treatment. ** (P<0.01) significant difference from healthy volunteers. C. Original representative histogram of DCFDA fluorescence of erythrocytes from healthy volunteers following a 24 h exposure to plasma from healthy volunteers (red shadow) and to plasma from patients without (gray line) and with (black line) cytostatic treatment. D. Arithmetic means ± SEM of DCFDA fluorescence of erythrocytes from healthy volunteers following a 24 h exposure to plasma from healthy volunteers (n=15, white bar) and to plasma from patients without (n=6, gray bar) and with (n=11, black bar) cytostatic treatment. ** (P<0.01) significant difference from healthy volunteers. # (P<0.05) significant difference from patients without cytostatic treatment (unpaired t test).
DISCUSSION
The present study confirms that LC is paralleled by anemia. The anemia prevails despite enhanced reticulocyte numbers, indicating that the anemia is not primarily due to reduced formation of new erythrocytes. Instead, the anemia prevails obviously despite enhanced erythropoiesis. Presumably, the anemia leads to upregulation of erythropoietin, which in turn stimulates erythropoiesis [19]. Erythropoietin has previously been shown to inhibit eryptosis [20] but under the influence of high erythropoietin levels erythrocytes are apparently generated with relative high susceptibility to triggers of eryptosis [21]. In any case, the anemia thus appears to result from enhanced erythrocyte turnover. Anemia was previously shown to be an independent prognostic factor for the survival rate of cancer patients [22] and its presence is associated with decreased survival in almost all cancer types studied [23]. In severe cases, anemia may lead to hypoxia in specific organs, which might influence tumor behavior [24]. Tumor hypoxia is, in turn, associated with resistance to both chemotherapy and radiation therapy [25] and as well with increased angiogenesis, a marker of enhanced tumor aggressiveness [26].
The present observations point to a possible cause contributing to accelerated erythrocyte loss with development of anemia. The percentage of PS exposing erythrocytes was enhanced in blood from LC patients. PS at the erythrocyte surface fosters the phagocytosis of the affected erythrocytes, which are thus rapidly cleared from circulating blood [9]. Accordingly, the enhanced PS abundance at the erythrocyte surface could well contribute to the anemia of the LC patients with and without cytostatic treatment.
The enhanced PS exposure at the erythrocyte surface of LC patients under cytostatic treatment was paralleled by a slight, but significant increase of cell volume contrasting the typical decrease of cell volume during eryptosis. Cell shrinkage is usually triggered by increase of erythrocyte [Ca2+]i resulting in activation of Ca2+ sensitive K+ channels, K+ exit, hyperpolarization of the cell membrane, Cl- exit and thus cellular loss of KCl with osmotically obliged water [14]. [Ca2+]i was not significantly different between erythrocytes isolated from LC patients and erythrocytes isolated from healthy volunteers. The lack of increased [Ca2+]i provides an explanation for the absence of cell shrinkage.
The stimulation of cell membrane scrambling in LC patients may in part have been due to oxidative stress, a well known trigger of eryptosis [13]. An oxidant/antioxidant imbalance has been described in the blood of cancer patients [27]. Moreover, the increased cell membrane scrambling of erythrocytes from LC patients under cytostatic treatment is paralleled by increased abundance of ceramide at the erythrocyte surface. Ceramide is a well known stimulator of eryptosis [9]. It is noteworthy that enhanced ceramide formation predisposes to lung cancer [28]. The susceptibility to eryptosis is further enhanced by iron deficiency [9], which may play a key role in anemia of patients with malignancy [3]. In the present study, transferrin levels have not been measured and the contribution of iron deficiency to the observed stimulation of eryptosis thus remains uncertain.
Our data show that eryptosis in LC patients is further compounded by cytostatic treatment. Eryptosis could be triggered by a myriad of xenobiotics including several cytostatic drugs [29–43]. Interestingly, both topotecan and cisplatin used for cytostatic treatment of some patients included in this study, have been shown to trigger eryptosis in vitro [44, 45]. Notably, patients under platinum-based chemotherapy were shown to have higher risk for anemia as compared to patients with non-platinum based chemotherapy [46].
Besides inducing anemia, enhanced eryptosis could interfere with microcirculation, as PS-exposing erythrocytes bind to endothelial CXCL16/SR-PSO and thus adhere to the vascular wall [47]. Moreover, PS exposing erythrocytes trigger blood clotting and thrombosis [48]. As a matter of fact, cancer patients are at a higher risk for developing thrombosis [49], which, at least in theory, could be fostered by enhanced eryptosis associated with malignancy. Enhanced incidence of thrombosis has indeed been reported in LC patients [50].
In view of the present observations, inhibitors of eryptosis may ameliorate anemia in LC patients. The possibility must be kept in mind, however, that, at least in theory, inhibitors of suicidal erythrocyte death may similarly counteract apoptosis of tumor cells and thus interfere with cytostatic treatment. Correction of anemia would, on the other hand, be expected to lower release of erythropoietin, which has previously been shown to foster tumor cell proliferation, tumor angiogenesis and lymphangiogenesis [51].
In conclusion, lung cancer and its treatment using cytostatic drugs is paralleled by enhanced erythrocyte cell membrane scrambling with PS translocation to the erythrocyte surface, an effect presumably contributing to anemia in those patients.
MATERIALS AND METHODS
Patients, erythrocytes and treatments
Blood was drawn from patients suffering from LC (6 ♀, 11 ♂, age 52-85 years) and healthy volunteers (4 ♀, 11 ♂, age 41 - 70 years). The patients were recruited from the Department of Internal Medicine, University of Tübingen. The clinical characteristics of the patients are shown in Table 1. Six patients did not receive cytostatic therapy (Pat. Group I), whereas 11 patients received cytostatic treatment (Pat. Group II). Patients suffering from renal insufficiency or severe heart failure were excluded from the study. The study was approved by the ethics committee of the University of Tübingen (184/2003V) and has been performed in accordance with the Declaration of Helsinki. Both, patients and healthy volunteers provided written informed consent. In order to isolate the erythrocytes, whole blood was centrifuged at 120 x g for 20 min at 23 °C and the platelets and leukocytes-containing supernatant was disposed. Measurements were made in freshly isolated erythrocytes or in erythrocytes (O- blood group) from healthy young individuals incubated in vitro with 500 μl plasma from patients or healthy volunteers at a hematocrit of 0.4% for 24 hours. For all measurements 50,000 cells were counted.
Annexin-V-binding and forward scatter
In order to determine annexin-V-binding, 2 μl of freshly drawn blood were mixed in 500 μl Ringer solution containing 5 mM CaCl2, subsequently stained with Annexin-V-FITC (1:200 dilution; ImmunoTools, Friesoythe, Germany) in Ringer solution containing 5 mM CaCl2 at 37°C for 15 min under protection from light. The annexin V abundance at the erythrocyte surface was subsequently determined on a FACS Calibur (BD, Heidelberg, Germany). Annexin-V-binding was measured with an excitation wavelength of 488 nm and an emission wavelength of 530 nm. A marker (M1) was placed to set an arbitrary threshold between annexin-V-binding cells and control cells. The same threshold was used for healthy erythrocytes and erythrocytes from lung cancer patients. A dot plot of forward scatter (FSC) vs. side scatter (SSC) was set to linear scale for both parameters.
Reticulocyte count
For determination of the reticulocyte count, Lithium-Heparin-whole blood (2 μl) was added to 500 μl Retic-COUNT® (thiazole orange) reagent from Becton Dickinson. Samples were stained for 30 min at room temperature in the dark and flow cytometry was performed according to the manufacturer’s instructions. Forward scatter (FSC), side scatter (SSC) and thiazole orange-fluorescence intensity (in FL-1) of the blood cells were determined. The number of Retic-COUNT positive reticulocytes was expressed as the percentage of the total gated erythrocyte population. Gating of erythrocytes was achieved by analysis of FSC vs. SSC dot plots using CellQuest software.
Confocal microscopy
For the visualization of eryptotic erythrocytes, 20 μl erythrocytes (1 × 10⁶ cells) were stained with Annexin V–FLUOS (1:100 dilution; Roche Diagnostics, Mannheim, Germany) in 200 μl Ringer solution containing 5 mM CaCl2. The erythrocytes were washed twice and finally resuspended in 200 μl Ringer solution containing 5 mM CaCl2. Forty μl were spread onto a glass slide and dried for 15 min on RT. The slides were covered with PROlong Gold antifade reagent (Invitrogen, Darmstadt Germany). Images were taken on a Zeiss LSM 5 EXCITER confocal laser-scanning microscope or with the phase light (Carl Zeiss MicroImaging, Germany) with a water immersion Plan-Neofluar 40/1.3 NA DIC. Scale bar 5 μm.
Reactive oxygen species (ROS)
Oxidative stress was determined utilizing 2’,7’-dichlorodihydrofluorescein diacetate (DCFDA). 4 μl erythrocytes were mixed in 1 ml Ringer. From the resulting cell suspension, 150 μl were centrifuged (1600 rpm for 3 min at RT). Cells were stained with DCFDA (10 μM; Sigma, Schnelldorf, Germany) in Ringer solution at 37°C for 30 min and then washed three times in 150 μl Ringer solution. The DCFDA-loaded erythrocytes were resuspended in 200 μl Ringer solution and ROS-dependent fluorescence intensity was measured in FL-1 at an excitation wavelength of 488 nm and an emission wavelength of 530 nm on a FACS Calibur. Afterwards, the geomean of the ROS-dependent fluorescence was determined.
Intracellular Ca2+
In order to quantify intracellular Ca2+, 2 μl of freshly drawn blood were mixed in 500 μl Ringer solution containing 5 mM CaCl2, stained with Fluo-3/AM (5 μM; Biotium, Hayward, USA) and incubated at 37°C for 30 min. Then Ca2+-dependent fluorescence intensity was measured in FL-1 with an excitation wavelength of 488 nm and an emission wavelength of 530 nm on a FACS Calibur. Subsequently, the geomean of the Ca2+ dependent fluorescence was determined.
Ceramide formation
To determine ceramide abundance, a monoclonal antibody-based assay was used. 4 μl erythrocytes were mixed in 1 ml Ringer. From the resulting cell suspension, 100 μl were centrifuged (1600 rpm for 3 min at RT) and the erythrocytes were pelleted. Subsequently, cells were stained for 1 h at 37°C with 1 μg/ml anti-ceramide antibody (1:10 dilution; clone MID 15B4; Alexis, Grünberg, Germany) in phosphate-buffered saline (PBS) containing 0.1% bovine serum albumin (BSA). After two washing steps with 100 μl PBS-BSA, cells were stained for 30 min with polyclonal fluorescein-isothiocyanate (FITC)-conjugated goat anti-mouse IgG and IgM specific antibody (1:50 dilution; BD Pharmingen, Hamburg, Germany) in PBS-BSA. Unbound secondary antibody was removed by repeated washing with 50 μl PBS-BSA. The samples were resuspended in 200 μl PBS-BSA and then analyzed in FL-1 by flow cytometry at an excitation wavelength of 488 nm and an emission wavelength of 530 nm on a FACS Calibur. Finally, the geomean of the ceramide dependent fluorescence was determined.
Statistics
Data are expressed as arithmetic means ± SEM. Mann-Whitney test or unpaired t-test was performed as appropriate to determine statistical significance between the two groups using GraphPad Prism version 6.00 for Windows, GraphPad Software, La Jolla California USA. For all correlations, Spearman nonparametric analysis was used. n denotes the number of individuals. P< 0.05 was considered significant.
ACKNOWLEDGMENTS
The authors acknowledge the meticulous preparation of the manuscript by Tanja Loch.
CONFLICTS OF INTEREST
The authors have no conflicts of interest.
GRANT SUPPORT
The study was supported by the Deutsche Forschungsgemeinschaft (to F.L.).
REFERENCES
1. Adamson JW. The anemia of inflammation/malignancy: mechanisms and management. Hematology Am Soc Hematol Educ Program. 2008:159–165.
2. Miller CB, Jones RJ, Piantadosi S, Abeloff MD, Spivak JL. Decreased erythropoietin response in patients with the anemia of cancer. N Engl J Med. 1990; 322:1689–1692.
3. Park S, Jung CW, Kim K, Kim SJ, Kim WS, Jang JH. Iron deficient erythropoiesis might play key role in development of anemia in cancer patients. Oncotarget. 2015; 6:42803–42812. doi: 10.18632/oncotarget.5658.
4. Eschbach JW, Egrie JC, Downing MR, Browne JK, Adamson JW. Correction of the anemia of end-stage renal disease with recombinant human erythropoietin. Results of a combined phase I and II clinical trial. N Engl J Med. 1987; 316:73–78.
5. Roy CN, Mak HH, Akpan I, Losyev G, Zurakowski D, Andrews NC. Hepcidin antimicrobial peptide transgenic mice exhibit features of the anemia of inflammation. Blood. 2007; 109:4038–4044.
6. Qadri SM, Mahmud H, Lang E, Gu S, Bobbala D, Zelenak C, Jilani K, Siegfried A, Foller M, Lang F. Enhanced suicidal erythrocyte death in mice carrying a loss-of-function mutation of the adenomatous polyposis coli gene. J Cell Mol Med. 2012; 16:1085–1093.
7. Hirsh V. nab-paclitaxel for the management of patients with advanced non-small-cell lung cancer. Expert Rev Anticancer Ther. 2014; 14:129–141.
8. Yang X, Yang K, Kuang K. The efficacy and safety of EGFR inhibitor monotherapy in non-small cell lung cancer: a systematic review. Curr Oncol Rep. 2014; 16:390.
9. Lang E, Qadri SM, Lang F. Killing me softly - suicidal erythrocyte death. Int J Biochem Cell Biol. 2012; 44:1236–1243.
10. Lang F, Qadri SM. Mechanisms and significance of eryptosis, the suicidal death of erythrocytes. Blood Purif. 2012; 33:125–130.
11. Kriebardis AG, Antonelou MH, Stamoulis KE, Economou-Petersen E, Margaritis LH, Papassideri IS. Progressive oxidation of cytoskeletal proteins and accumulation of denatured hemoglobin in stored red cells. J Cell Mol Med. 2007; 11:148–155.
12. Tesoriere L, Attanzio A, Allegra M, Cilla A, Gentile C, Livrea MA. Oxysterol mixture in hypercholesterolemia-relevant proportion causes oxidative stress-dependent eryptosis. Cell Physiol Biochem. 2014; 34:1075–1089.
13. Zidova Z, Kapralova K, Koralkova P, Mojzikova R, Dolezal D, Divoky V, Horvathova M. DMT1-mutant erythrocytes have shortened life span, accelerated glycolysis and increased oxidative stress. Cell Physiol Biochem. 2014; 34:2221–2231.
14. Foller M, Mahmud H, Gu S, Kucherenko Y, Gehring EM, Shumilina E, Floride E, Sprengel R, Lang F. Modulation of suicidal erythrocyte cation channels by an AMPA antagonist. J Cell Mol Med. 2009; 13:3680–3686.
15. Klarl BA, Lang PA, Kempe DS, Niemoeller OM, Akel A, Sobiesiak M, Eisele K, Podolski M, Huber SM, Wieder T, Lang F. Protein kinase C mediates erythrocyte “programmed cell death” following glucose depletion. Am J Physiol Cell Physiol. 2006; 290:C244-C253.
16. Lang E, Gatidis S, Freise NF, Bock H, Kubitz R, Lauermann C, Orth HM, Klindt C, Schuier M, Keitel V, Reich M, Liu G, Schmidt S, et al. Conjugated bilirubin triggers anemia by inducing erythrocyte death. Hepatology. 2014.
17. Attanasio P, Bissinger R, Haverkamp W, Pieske B, Wutzler A, Lang F. Enhanced suicidal erythrocyte death in acute cardiac failure. Eur J Clin Invest. 2015; 45:1316–1324. doi: 10.1111/eci.12555.
18. Lupescu A, Bissinger R, Goebel T, Salker MS, Alzoubi K, Liu G, Chirigiu L, Mack AF, Qadri SM, Lang F. Enhanced suicidal erythrocyte death contributing to anemia in the elderly. Cell Physiol Biochem. 2015; 36:773–783.
19. Souma T, Suzuki N, Yamamoto M. Renal erythropoietin-producing cells in health and disease. Front Physiol. 2015; 6:167.
20. Myssina S, Huber SM, Birka C, Lang PA, Lang KS, Friedrich B, Risler T, Wieder T, Lang F. Inhibition of erythrocyte cation channels by erythropoietin. J Am Soc Nephrol. 2003; 14:2750–2757.
21. Foller M, Kasinathan RS, Koka S, Huber SM, Schuler B, Vogel J, Gassmann M, Lang F. Enhanced susceptibility to suicidal death of erythrocytes from transgenic mice overexpressing erythropoietin. Am J Physiol Regul Integr Comp Physiol. 2007; 293:R1127–1134.
22. Sheikh S, Littlewood TJ. Erythropoiesis-stimulating agents for anemic patients with cancer. Expert Rev Hematol. 2010; 3:697–704.
23. Caro JJ, Salas M, Ward A, Goss G. Anemia as an independent prognostic factor for survival in patients with cancer: a systemic, quantitative review. Cancer. 2001; 91:2214–2221.
24. Spivak JL, Gascon P, Ludwig H. Anemia management in oncology and hematology. Oncologist. 2009; 14:43–56.
25. Knight K, Wade S, Balducci L. Prevalence and outcomes of anemia in cancer: a systematic review of the literature. Am J Med. 2004; 116:11S-26S.
26. Thomas GM. Raising hemoglobin: an opportunity for increasing survival? Oncology. 2002; 63:19–28.
27. Milonski J, Zielinska-Blizniewska H, Olszewski J, Majsterek I, Mrowicka M. DNA damage and oxidant-antioxidant status in blood of patients with head and neck cancer. DNA Cell Biol. 2015; 34:213–219.
28. Goldkorn T, Chung S, Filosto S. Lung cancer and lung injury: the dual role of ceramide. Handb Exp Pharmacol. 2013:93–113.
29. Alzoubi K, Calabro S, Bissinger R, Abed M, Faggio C, Lang F. Stimulation of suicidal erythrocyte death by artesunate. Cell Physiol Biochem. 2014; 34:2232–2244.
30. Arnold M, Bissinger R, Lang F. Mitoxantrone-induced suicidal erythrocyte death. Cell Physiol Biochem. 2014; 34:1756–1767.
31. Bissinger R, Fischer S, Jilani K, Lang F. Stimulation of erythrocyte death by phloretin. Cell Physiol Biochem. 2014; 34:2256–2265.
32. Jacobi J, Lang E, Bissinger R, Frauenfeld L, Modicano P, Faggio C, Abed M, Lang F. Stimulation of erythrocyte cell membrane scrambling by mitotane. Cell Physiol Biochem. 2014; 33:1516–1526.
33. Lupescu A, Bissinger R, Herrmann T, Oswald G, Jilani K, Lang F. Induction of suicidal erythrocyte death by novobiocin. Cell Physiol Biochem. 2014; 33:670–680.
34. Lupescu A, Bissinger R, Warsi J, Jilani K, Lang F. Stimulation of erythrocyte cell membrane scrambling by gedunin. Cell Physiol Biochem. 2014; 33:1838–1848.
35. Zhang R, Xiang Y, Ran Q, Deng X, Xiao Y, Xiang L, Li Z. Involvement of calcium, reactive oxygen species, and ATP in hexavalent chromium-induced damage in red blood cells. Cell Physiol Biochem. 2014; 34:1780–1791.
36. Lang E, Jilani K, Bissinger R, Rexhepaj R, Zelenak C, Lupescu A, Lang F, Qadri SM. Vitamin D-Rich Diet in Mice Modulates Erythrocyte Survival. Kidney Blood Press Res. 2015; 40:403–412.
37. Risso A, Ciana A, Achilli C, Minetti G. Survival and senescence of human young red cells in vitro. Cell Physiol Biochem. 2014; 34:1038–1049.
38. Bouguerra G, Bissinger R, Abbes S, Lang F. Zopolrestat Induced Suicidal Death of Human Erythrocytes. Cell Physiol Biochem. 2015; 37:1537–1546.
39. Faggio C, Alzoubi K, Calabro S, Lang F. Stimulation of suicidal erythrocyte death by PRIMA-1. Cell Physiol Biochem. 2015; 35:529–540.
40. Peter T, Bissinger R, Enkel S, Alzoubi K, Oswald G, Lang F. Programmed erythrocyte death following in vitro Treosulfan treatment. Cell Physiol Biochem. 2015; 35:1372–1380.
41. Pagano M, Faggio C. The use of erythrocyte fragility to assess xenobiotic cytotoxicity. Cell Biochem Funct. 2015; 33:351–355.
42. Bissinger R, Modicano P, Alzoubi K, Honisch S, Faggio C, Abed M, Lang F. Effect of saponin on erythrocytes. Int J Hematol. 2014; 100:51–59.
43. Lang E, Modicano P, Arnold M, Bissinger R, Faggio C, Abed M, Lang F. Effect of thioridazine on erythrocytes. Toxins (Basel). 2013; 5:1918–1931.
44. Bissinger R, Bouguerra G, Stockinger K, Abbes S, Lang F. Triggering of Suicidal Erythrocyte Death by Topotecan. Cell Physiol Biochem. 2015; 37:1607–1618.
45. Mahmud H, Foller M, Lang F. Suicidal erythrocyte death triggered by cisplatin. Toxicology. 2008; 249:40–44.
46. Amarasena IU, Chatterjee S, Walters JA, Wood-Baker R, Fong KM. Platinum versus non-platinum chemotherapy regimens for small cell lung cancer. Cochrane Database Syst Rev. 2015; 8:CD006849.
47. Borst O, Abed M, Alesutan I, Towhid ST, Qadri SM, Foller M, Gawaz M, Lang F. Dynamic adhesion of eryptotic erythrocytes to endothelial cells via CXCL16/SR-PSOX. Am J Physiol Cell Physiol. 2012; 302:C644-C651.
48. Chung SM, Bae ON, Lim KM, Noh JY, Lee MY, Jung YS, Chung JH. Lysophosphatidic acid induces thrombogenic activity through phosphatidylserine exposure and procoagulant microvesicle generation in human erythrocytes. Arterioscler Thromb Vasc Biol. 2007; 27:414–421.
49. Franchini M, Mannucci PM. Low-molecular-weight heparins and cancer: focus on antitumoral effect. Ann Med. 2015; 47:116–121.
50. Vitale C, D’Amato M, Calabro P, Stanziola AA, Mormile M, Molino A. Venous thromboembolism and lung cancer: a review. Multidiscip Respir Med. 2015; 10:28.
51. Debeljak N, Solar P, Sytkowski AJ. Erythropoietin and cancer: the unintended consequences of anemia correction. Front Immunol. 2014; 5:563.