
INTRODUCTION
Borderline ovarian tumours (BOTs) are a heterogeneous group of tumours, comprising up to 10% of ovarian epithelial neoplasms [1]. Serous and mucinous varieties constitute the majority of BOTs and unlike ovarian carcinoma, they occur mostly in women of reproductive age [2]. The majority of BOTs behave in a benign fashion, yet there remain a percentage of tumours that may recur or progress in a manner similar to malignant tumours [3]. To date there are no definite clinical or molecular markers that can help identify high risk BOTs that may behave in an aggressive fashion. Identification of risk factors for tumour progression is a challenge that can only be addressed effectively if the pathogenesis of these tumours is revealed. Mutations in KRAS and BRAF genes have been extensively studied in BOTs, but it is not known whether these mutations alone are sufficient to induce BOTs in vivo [4]. Epidermal growth factor receptor (EGFR) is a trans-membrane receptor with tyrosine kinase activity that is important in cell growth and proliferation [5]. It is the main regulator of downstream molecules in a number of pathways including the RAS and RAF genes [6]. EGFR plays a role in cell survival signals as well as in epithelial to mesenchymal transition of tumour cells, angiogenesis and subsequent metastasis [7]. EGFR amplification, mutations and overexpression have been extensively and variably reported in ovarian carcinoma [8]. Increased EGFR expression has been correlated with poorer patient outcomes in some studies [8, 9]. As a consequence, EGFR has been a subject of investigation for targeted therapies, with monoclonal antibodies and small-molecule tyrosine kinase inhibitors, exploring it as a potential therapeutic agent in ovarian carcinoma. Very few reports included BOTs and mostly investigated a small number of tumours or studied a single aspect (protein expression or mutations only).
In this work, we studied EGFR protein expression, gene mutations and gene copy number in a large series of BOTs, to investigate whether EGFR plays a role in the pathogenesis of these tumours. We also aimed to explore any possible relation between EGFR protein expression and / or gene status and the presence of KRAS and BRAF mutations.
RESULTS
We studied formalin fixed paraffin embedded tissues (FFPE) from eighty five cases of ovarian tumours including: 61 BOTs (including 45 serous, 14 mucinous, 1 endometrioid and 1 seromucinous), 10 low-grade serous carcinomas (LGSCs), 9 high grade serous carcinomas (HGSCs) and 5 benign epithelial tumours (2 serous cystadenomas and 3 mucinous cystadenomas).
EGFR expression by immunohistochemistry
Two distinct patterns of protein expression; nuclear and cytoplasmic, were detected in all tumour categories, Figure 1. No membranous staining was detected in any of the tumours. Using two different scoring systems (discussed in Methods), we compared the degree of nuclear and cytoplasmic expression between different tumour groups. Using the first scoring system (the H score [10], Table 1), we found that the level of nuclear expression in BOTs was significantly higher compared to HGSCs (mean ranks: 38.88, 12.61 respectively, p< 0.001) and compared to benign tumours (mean ranks: 35.18, 13.00 respectively, p= 0.010). On the other hand, no statistically significant difference existed between the level of nuclear positivity of BOTs and LGSCs (mean ranks 36.48, 33.05, respectively, p= 0.625). Combining BOTs and LGSCs as one category, their nuclear expression level came again higher in comparison to HGSCs (mean ranks: 43.74, 14.94, p< 0.001) and benign tumours (mean ranks: 40.11, 15.70, p= 0.017). This pattern of nuclear expression similarity between BOTs and LGSCs did not apply to cytoplasmic expression, where positive cytoplasmic expression in LGSCs came higher compared to all other tumour categories; BOTs (mean ranks: 52.00, 33.38, p= 0.008), HGSCs (mean ranks: 13.6, 6.0, p= 0.003), and benign tumours (mean ranks: 10.50, 3.00, p= 0.002).
Table 1: Mean ranks and p values obtained from comparing H- score [10] and Lo et al [11] score of EGFR expression in cases from two tumour categories (Group1 vs Group2)
Group 1 |
Group 2 |
H- score |
Lo et al score |
||||
|---|---|---|---|---|---|---|---|
Mean rank (group 1) |
Mean rank (group 2) |
p value |
Mean rank (group 1) |
Mean rank (group 2) |
p value |
||
Nuclear scoring results: |
|||||||
BOTs |
LGSCs |
36.48 |
33.05 |
p= 0.625 |
36.57 |
32.55 |
p= 0.567 |
BOTs |
HGSCs |
38.88 |
12.61 |
p< 0.001 |
38.97 |
12.06 |
p< 0.001 |
BOTs |
Benign |
35.18 |
13.00 |
p= 0.010 |
35.17 |
13.10 |
p= 0.013 |
BOTs and LGSC |
HGSCs |
43.74 |
14.94 |
p< 0.001 |
43.85 |
14.11 |
p< 0.001 |
BOTs and LGSCs |
Benign |
40.11 |
15.70 |
p= 0.017 |
40.11 |
15.17 |
p= 0.016 |
Cytoplasmic scoring results: |
|||||||
BOTs |
LGSCs |
33.38 |
52.00 |
p= 0.008 |
34.20 |
47.00 |
p= 0.026 |
BOTs |
HGSCs |
36.21 |
30.67 |
p= 0.442 |
34.89 |
39.67 |
p= 0.437 |
BOTs |
Benign |
34.77 |
18.00 |
p= 0.059 |
34.52 |
21.10 |
p= 0.085 |
LGSCs |
HGSCs |
13.6 |
6.00 |
p= 0.003 |
11.00 |
8.89 |
p= 0.126 |
LGSCs |
Benign |
10.50 |
3.00 |
p= 0.002 |
9.50 |
5.00 |
p= 0.009 |
The Mann- Whitney’s test is used in comparing the means of nuclear and cytoplasmic staining percentages between different groups. Significant differences are highlighted (p ≤ 0.05).
BOTs: borderline ovarian tumours, HGSCs: high grade serous carcinomas, LGSCs: low grade serous carcinomas
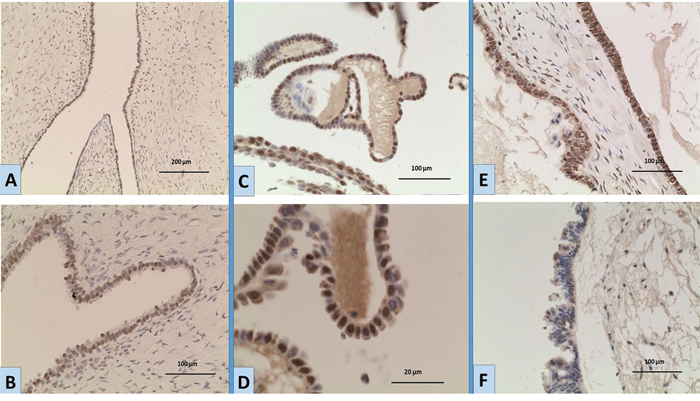
Figure 1: Expression of EGFR by immunohistochemistry in ovarian tumours A, B. a case of BOT showing moderate nuclear expression; [A: magnification x10; B: magnification; x20]. C, D. a BOT case showing nuclear expression of variable intensity [C: magnification x20; D: magnification x40]. E. a BOT case showing strong nuclear and moderate cytoplasmic expression [magnification x20]. F. a BOT case with negative nuclear staining and weak cytoplasmic expression [magnification x20].
To further validate these results we employed a second scoring system that was used by Lo et al [11] (table 1, detailed in Methods); where only the percentage of positive cells is considered, regardless of the intensity of expression. This scoring system similarly showed no statistically significant difference between BOTs and LGSCs (mean ranks: 36.57, 32.55, p=0.567), while the there was a significant difference between BOTs and HGSCs (mean ranks: 38.96, 12.06, p< 0.001) and benign tumours (mean ranks: 35.17, 13.10, p= 0.013).
EGFR, BRAF and KRAS gene mutation analysis
No functional mutations (i.e. mutations altering gene product) in EGFR were detected in any of the tumours, yet sequence analysis revealed the presence of rs1050171, c.2361 G>A single nucleotide polymorphism (SNP) in exon 20. The genotypes GG (wild), GA (heterozygous) and AA (homozygous) were detected at different frequencies in different tumour groups Table 2 and Figure 2, 2A. In exon 21, three different single nucleotide substitutions were detected. These were the rs2229066, c.2508 C>T (in heterozygosity), detected in a total of 6 samples, a heterozygous rs41420046, c.2487 G>A in a serous BOT and the COSM26129, c.2572 C>T, L858L was identified in a different sample of serous BOTs (Figure 2, 2B-2D). Exons 18 and 19 were free from any molecular variation.
Table 2: Gene mutations and polymorphisms
|
Borderline ovarian tumors |
Low grade serous carcinoma |
High grade serous carcinoma |
Benign epithelial tumors |
|
|---|---|---|---|---|---|
Gene Tumor |
|||||
EGFR(1) |
|||||
rs1050171 c.2361 G>A (exon 20) |
Wild (G) |
15 (24.6) |
1 (10) |
1 (11.1) |
0 (0) |
Homozygous (A) |
16 (26.2) |
2 (20) |
4 (44.4) |
4 (80) |
|
Heterozygous (R) |
30 (49.2) |
7 (70) |
4 (44.4) |
1 (20) |
|
rs2229066 c.2508 C>T (exon 21) |
5 (8.2) (4 serous, 1 mucinous) |
1 (10) |
0 (0) |
0 (0) |
|
rs41420046 c.2487 G>A (exon 21) |
1 (1.6) serous |
0 (0) |
0 (0) |
0 (0) |
|
COSM26129 c.2572 C>T, (exon 21) |
1 (1.6) serous |
0 (0) |
0 (0) |
0 (0) |
|
KRAS(1) |
|||||
c.34G>T |
3 (4.9) (2 serous, 1 mucinous) |
1 (10) |
0 (0) |
0 (0) |
|
c.35G>A |
12 (19.7) (8 serous, 4 mucinous) |
4 (40) |
0 (0) |
0 (0) |
|
c.35G>C |
1 (1.6) (0 serous, 1 mucinous) |
0 (0) |
0 (0) |
0 (0) |
|
c.35G>T |
6 (9.8) 3 serous, 2 mucinous, 1 seromucinous) |
1 (10) |
0 (0) |
0 (0) |
|
c.37G>A |
1 (1.6) (1 serous, 0 mucinous) |
0 (0) |
0 (0) |
0 (0) |
|
Total of KRAS mutations |
23 (37.7) |
6 (60) |
0 (0) |
0 (0) |
|
BRAF(1) |
|||||
T>A |
15 (24.6) 15 serous, 0 mucinous |
4 (40) |
0 (0) |
0 (0) |
|
(1): No concurrent mutations of both KRAS and BRAF existed in any case. (2): Percentages do not add up to 100 due to cases without mutation/SNP
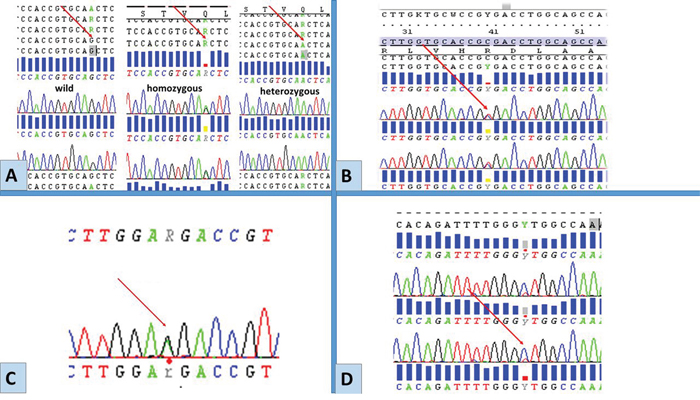
Figure 2: Representative chromatograms of mutations/SNPs revealed from sequences analysis of EGFR by Sanger sequencing. Red arrows point to the site of mutations/SNPs: A. rs1050171, c.2361 G> A, exon 20. B. rs17290559, c.2508 C>T, exon 21. C. rs41420046, c.2487 G>, exon 21. D. COSM26129 c.2572 C>T (p.L858L), exon 21. These molecular variations were detected only in exons 20 and 21 among BOTs and LGSC.
KRAS and BRAF mutations were detected exclusively in BOTs and LGSCs. For KRAS, five types of single substitutions in codons 12 and 13 were found, the most frequent was the G12D (19.7% in BOTs and 40% of LGSCs cases). The BRAF V600E mutation in exon 15 was detected in 24.6% of BOTs and 40% of LGSCs. No concurrent mutations of both KRAS and BRAF existed in any case. Table 2 shows the frequencies of all mutational analysis findings among the studied groups.
No significant association was found between the mean of nuclear expression of EGFR and the presence of mutation (p= 0.384), BRAF mutations (p= 0.553) or combined KRAS and BRAF (p= 0.598).
EGFR gene amplification analysis by CISH
To ascertain whether high EGFR expression was related to EGFR gene amplification, we assessed amplification status in a subset (18 cases) of tumours that showed the highest expression using H score), which included 16 BOTs and 2 LGSCs. None of the cases showed gene amplification or aneuploidy. The range of EGFR gene copy number (GCN) in all cases was (1.16-2.30), median= 1.65, (Figure 3).
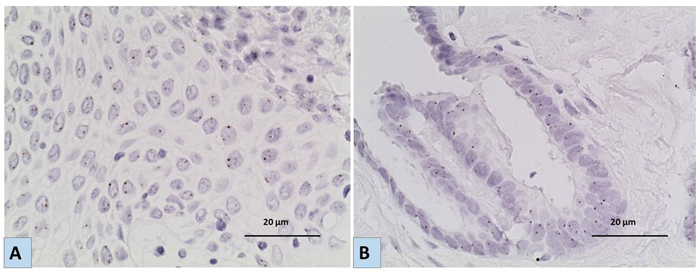
Figure 3: Representative images for the results of Chromogenic In situ hybridization (CISH) using EGFR specific probe A. a case of LGSC and B. a case of BOT showing no EGFR gene amplification/ aneuploidy [magnification x40]. Six or more brown dots in the nucleus in more than 50% of tumour cells indicate amplification of the EGFR gene, while 3-5 are considered aneuploidy.
DISCUSSION
The results of our study show the presence of nuclear localization of EGFR in ovarian tumours particularly in BOTs and LGSCs. The level of nuclear localization was higher in BOTs and LGSCs as compared to HGSCs or benign tumours. To our knowledge, this is the first report of nuclear expression of EGFR in BOTs, while it has been previously reported in some malignant tumour types including ovarian [12] and breast carcinoma [11, 13]. Xia et al conducted an immunohistochemical analysis for EGFR on 221 primary ovarian carcinomas of mixed grades, and he reported a 28.3% nuclear positivity among his cohort, and showed that nuclear expression correlated with low survival rates. Nuclear transport of EGFR family receptors has been previously reported, exerting several functions; mainly as a co- transcriptors and regulators of cyclin D1 promoter [14, 15].
In addition, different molecular and clinicopathologic studies suggest the evolution of LGSCs from BOTs, mostly through similarity in frequency of KRAS and BRAF mutations [4]. Our results showing significantly higher nuclear expression among these two categories compared to HGSCs and benign tumours, provide further support to this developmental relationship between serous BOTs and LGSCs, which is distinct from that of HGSCs [16, 17]. This also raises the possibility that EGFR may play a role in the pathogenesis of BOT-LGSC via nuclear localization, with no such role in the development of HGSCs.
Previous reports on the level of expression of membranous or cytoplasmic EGFR showed much variability, which may be due to differences in tissue preparation and fixation, different antibodies and staining protocols, but most importantly due to the great variability in scoring systems adopted. For our study we adopted the modified H- score method as it takes into consideration both percentages of cells showing expression as well as the intensity of the positive expression. We detected EGFR cytoplasmic expression in our cohort of tumours with variable distributions and intensity, where LGSCs showed the highest level of expression. In agreement with our results, Chen et al, showed that cytoplasmic EGFR positivity in both borderline and malignant ovarian tumours was significantly higher than in normal ovarian tissue and benign tumours [18]. Similarly, Nielsen et al reported that 67% of BOTs and 62% of ovarian carcinomas showed cytoplasmic positivity [19]. In contrast, Fujiwara et al, reported 0% positivity in his 10 studied BOTs, while 39.3% of the 152 serous carcinomas showed positive cytoplasmic staining [20]. Brustmann et al also reported no EGFR immune-reactivity in any of the serous cystadenomas or serous BOTs studied, compared to 64% of serous carcinomas [21]. In addition, van Haaften-Day compared the expression of EGFR in 16 invasive ovarian carcinomas and 11 serous borderline tumours and found that EGFR was expressed in a significantly greater fraction of malignant lesions (69%, n=16) than borderline lesions (18%, n=11) (p< 0.004) [22].
Our study shows that these patterns of EGFR expression are not related to underlying gene mutations or gene amplifications. In agreement with results of previous studies, our results confirm the rarity of EGFR mutations in BOTs [23, 24, 25]. However, we identified polymorphisms that have not been previously reported in ovarian tumours. Although being germline changes, some of these polymorphisms were previously reported to carry a potential relevance as prognostic markers. The identified rs1050171 polymorphism in exon 20 was previously reported to be associated with positive response to treatment with tyrosine kinase inhibitors (TKIs) in some cases of small cell carcinoma of the lung [26]. On the other hand, it was associated with worse survival rate in some oesophageal squamous cell carcinoma cases [27]. In addition, COSM26129 has only been described before in 3 cases of head and neck squamous cell carcinoma in 2007 [28]; our study is the second to report this variation and the first to report its presence in a case of serous BOT.
We detected KRAS and BRAF mutations exclusively in BOTs and LGSCs in our cohort and in frequencies comparable to previous reports for both KRAS (17-41%) and BRAF (30-71%) [6, 29–34]. Also in concordance with previous reports [32], KRAS and BRAF mutations were mutually exclusive in our study. We found no association between the level of expression of EGFR protein and KRAS and BRAF gene status. Szablewski et al [35] studied KRAS and BRAF mutations as well as EGFR expression in intestinal-type adenocarcinoma. Their results showed that KRAS mutations were frequent (42.9%) as was EGFR overexpression (63% of 43 samples), but similar to our findings, no statistically significant correlation between KRAS gene status and EGFR level of protein expression was detected.
Neither EGFR gene amplifications nor aneuploidy were detected in any of the BOTs or LGSCs we studied. Comparable results were reported by Dekanić et al, who reported a strong nuclear EGFR expression in colorectal carcinomas that was associated with cyclin-D1 but not with EGFR gene amplification [36]. But in contrast to these results, Lee et al found an increased copy number of the EGFR gene in 8.3% of BOTs and 37.8% of malignant tumours, but none in benign tumours [37].
The rarity of mutations and low frequency of EGFR polymorphisms detected and the lack of obvious amplification among our cohort suggests that these are not likely to be significant molecular events in the pathogenesis of BOTs or LGSCs. The high level of EGFR protein expression may be the result of other epigenetic or post transcriptional events rather than gene mutation or amplification.
MATERIALS AND METHODS
Selection of cases and ethical approvals
Tumour cases were retrieved from the Department of Histopathology, Hammersmith Hospital, London, UK. Slides from each case were reviewed and a representative block was selected with tumour content of at least 75%. The study was approved by The Hammersmith and Queen Charlotte’s & Chelsea Research Ethics Committee.
EGFR immunohistochemistry
Tissue sections of 5 μm thick were mounted on pre-coated slides, deparaffinised with xylene and rehydrated with graded ethanol. Endogenous peroxidase was blocked with Peroxidase Blocking Solution (DAKO, CA, USA) for 15 minutes. Sections were then incubated with primary antibody for EGFR (1:100, Clone: H11, Monoclonal Mouse Anti-Human, EGFR, Dako) [38] for overnight at 4°C. Positive controls were included for each run (Normal placental tissue) and a negative control slide was used for each case, as a duplicate section, where the antibody was replaced by antibody diluent. The reaction was visualised using Novolink™ Polymer Detection Systems (Leica Biosystems Newcastle Ltd, UK). Sections were counterstained with Haematoxylin. The stained slides were evaluated by two investigators (RS and ME) by light microscopy, using low (×10) and high (×20 or ×40) magnification. Discordant cases were jointly reviewed and a consensus was reached. The subcellular distribution of the staining between membrane, cytoplasm and nucleus was evaluated. For each case, reviewing the whole tumourous section, the percentage of positive cells and intensity of staining was estimated in each compartment. EGFR protein expression was scored in two different ways. First, using The H-score [10], which is the product of multiplication of the percentage of cells positive for membranous and cytoplasmic or positive for nuclear EGFR and the staining intensity, each producing a number (from 0 to 300), for both nuclear and cytoplasmic expression. Cytoplasmic or nuclear scoring was then graded as follows: grade 1 (score 0–100), grade 2 (101–200), and grade 3 (201–300). This was followed by calculating a combined score for cytoplasmic and nuclear together, ranging 2-6. The other scoring system considered only the percentage of positive cells regardless of the intensity, described by Lo et al [11], in which membranous or cytoplasmic EGFR staining was grouped into four groups: high (3, >50%), moderate (2, 26-50%), low (1, 1-25%), and negative (0, 0%), while nuclear EGFR was scored as high (3, >35%), moderate (2, 18-35%), low (1, 1-17%), and negative (0, 0%) as previously described.
Mutation analysis using sanger sequencing
DNA extraction
Sections of 5-10 μm thickness were cut from FFPE tissue samples. Tumour tissue was scraped from at least 5 slides per case and genomic DNA was subjected to overnight digestion with sodium dodecyl sulphate and proteinase K (Sigma-Aldrich, USA) at 37°C, followed by standard phenol-chloroform (1: 1) extraction and ethanol precipitation. The precipitant was suspended in 35 μl of 10 mM Tris-Cl, of pH equals to 8.0. The quality of the genomic DNA was checked (OD A260/A280 > 1.7) spectrophotometrically, using NanoDrop 1000 Spectrophotometer V3.7, Thermo SCIENTIFIC.
Polymerase chain reaction (PCR) for EGFR, KRAS and BRAF
Mutation analysis of exons 18-21 of tyrosine kinase domain of EGFR, exon 2 (codons 12 and 13) of KRAS and exon 15 of BRAF genes were performed by Polymerase chain reaction (PCR) amplification followed by direct sequencing of the PCR products. The primers used were provided from custom oligos, invitogen, life technologies TM and are listed in Table 3.
Table 3: Primers’ sequences used for amplification of EGFR (exons 18-21), KRAS (exon 2) and BRAF (exon 15)
Gene |
Forward primer (5’-3’) |
Reverse primer (5’-3’) |
|---|---|---|
EGFR, exon 18 |
TTGTCCTTCCAAATGAGCTG |
ACAGCTTGCAAGGACTCTGG) |
EGFR, exon 19 |
AGATCACTGGGCAGCATGT |
CAGCTGCCAGACATGAGAAA |
EGFR, exon 20 |
CATTCATGCGTCTTCACCTG |
CATATCCCCATGGCAAACTC |
EGFR, exon 21 |
ATCCTCCCCTGCATGTGTTA |
CTCAGAGCCTGGCATGAAC |
KRAS, exon 2 (codon 12 and 13 |
GTGTGACATGTTCTAATATAGTCA |
CTGTATCAAAGAATGGTCCTGCAC |
BRAF, exon 15 |
TCATAATGCTTGCTCTGATAGG |
GGCCAAAAATTTAATCAGTGG |
For EGFR, DNA was amplified in a total volume of 30 μl containing 1.5 mM MgCl2, 1.25 U of Ampli Taq Gold ® DNA, 3 μl of GeneAmp 10x PCR buffer II (ABI Cat N808-0241), 200 μM of each dNTP (dATP, dCTP, dGTP and dTTP; Promega, Cat U1410), 300 nM of each primer and 250 ng of DNA. DNA was first denatured at 95°C for 5 minutes, followed by 38 cycles of PCR including denaturation at 95°C for 45 s, annealing for 45 s at 60°C and extension for 45 s at 72°C. At the end of the last cycle, the mixture was incubated at 72°C for 10 minutes. As for KRAS and BRAF, each PCR reaction was performed in a 25 μl volume mixture containing 250 ng of genomic DNA, 2.5 μl of both forward and reverse primers (0.1 μmol each) and 12.5 μl of GoTaq®Hot Start Green Master Mix (Promega). PCR amplification was carried out using the following conditions: 1 cycle at 95°C (15 minutes); 35 cycles at 94°C (30 seconds), at 52°C for KRAS and 50 °C for BRAF(30 seconds), and at 72°C (30 seconds), and a final extension step at 72°C (7 minutes). All PCR reactions were performed in G- storm thermal cycler (Somerton Biotechnology Centre, UK). PCR amplicons were then checked using Qiaxcel capillary electrophoresis, where negative controls (non-template sample) were used and blood lymphocyte DNA from a healthy individual was used as a positive control of the amplification.
Sanger sequencing for EGFR, KRAS and BRAF
PCR products were then purified using the QIAquick PCR Purification Kit (Qiagen, Crawley UK) according to manufacturer’s instructions. All purified PCR products were then sequenced in both orientations by Sanger sequencing using the manufacturers’ recommendations. Sequencing reactions were run on 3500Xl Genetic analyser (life technologies), and then purified using Big DyeSAM Solution and Big DyeXterminator solution (life technologies), to eliminate the excess of labelled ddNTPs. The sequence alignments were done with the BioEdit Sequence Alignment Editor and analysed using SeqScape software 2.5 (Applied Biosystems). The DNA sequence of EGFR gene was obtained from GenBank (EGFR-001, transcript ID: ENST00000275493). We compared the KRAS sequence against (KRAS-001, transcript ID: ENST00000311936), and BRAF sequence against (BRAF-001, transcript ID: ENST00000288602) as in Gene Bank. Detected mutations/polymorphisms were confirmed by at least two independent PCR amplifications and repeated sequencing reactions.
Chromogenic in-situ hybridization (CISH) for EGFR
EGFR gene amplification was investigated by CISH in a subset of 18 cases which showed the highest combined H score expression. We aimed to investigate cases with scores of 6, 5 and 4 with at least a score of 2 in each of cytoplasmic and nuclear compartments. Score 6 was not detected in any of the studied cases. Cases studied with CISH included the 2 cases of BOTs which showed a score of 5 and 16 cases with score 4 (14 BOTs and 2 LGSCs). CISH was performed as previously described [39]. CISH was performed on 3 μm- thick FFPE tumour sections using ZytoDot CISH Implementation Kit, ZytoVision GmbH, Germany. Briefly, Slides were deparaffinised in xylene and immersed in 100% ethanol followed by water. Slides were then immersed in pre-treatment solution at 98 °C for 17 minutes, then immediately washed with distilled water for 3 washes, 2 minutes each. Enzymatic digestion was done by incubating the slides with pepsin (2-3 drops) for 6 minutes at room temperature. The slides were then washed, dehydrated and air dried. Application of 15μl of the ready to use probe, (ZytoDot SPEC EGFR Probe, ZytoVision GmbH, Germany) was followed by application of coverslips, sealing of the edges and denaturing at 95 °C for 5 minutes and hybridization at 37 °C overnight in SPOT-Light®CISH™ Hybridizer (Invitrogen, life technologies). On the next day, a stringent wash was performed using 5× standard saline citrate (SCC) at 75° C for 7 minutes, followed by washing twice for 2 minutes. Sections were blocked with 3% H2O2, diluted with methanol for 10 minutes and PBS wash was performed twice for 2 minutes. Non-specific binding was blocked by applying the blocking solution and by incubating for 10 minutes. After incubation with a Mouse anti-Dig antibody for 30 minutes at room temperature, the procedure was continued by incubation with Anti mouse HRP-polymer and substrate chromogenic solution (DAB) for 30 minutes and counterstained with haematoxylin for 5s. The tissues were dehydrated in ethanol and coverslipped in mounting solution.
Slides were examined by light microscopy. The CISH signals were seen as dark brown dots. We counted 60 nuclei with a high power (x40) objective. Also the average EGFR GCN per nucleus for each tissue section was calculated [40]. A GCN of six or more in the nucleus in more than 50% of tumour cells indicate the presence of amplification of the EGFR gene, while 3-5 gene copies in > 50% of studied cells were considered aneuploidy. CISH scoring was evaluated by three researchers (RS, ML and RN).
Statistical analysis
Statistical analysis was performed using SPSS 18. Mann-Whitney Test was used for 2 group comparison. Results were considered significant when p value < 0.05.
CONCLUSION
This is the first study to thoroughly investigate the gene status and protein expression of EGFR in BOTs. Our study showed that nuclear expression of EGFR in BOTs and LGSCs was significantly higher compared to HGSCs or benign tumours, which lends support to the molecular similarity between BOTs and LGSCs. While EGFR gene mutation and amplification was not detected, gene polymorphisms were identified, which may have potential clinical significance.
ACKNOWLEDGMENTS
The research was supported by the National Institute for Health Research (NIHR) Biomedical Research Centre based at Imperial College Healthcare NHS Trust and Imperial College London.
CONFLICTS OF INTEREST
The authors declare no conflicts of interest
GRANT SUPPORT
The research was funded by a grant from The Dorset Cancer Centre Medical Oncology Research Fund, grant number; P37464_WMEP.
REFERENCES
1. Lee KR. Tumours of the ovary and peritoneum. In Tavassoli FA, Devilee P, editors. World Health Organization classification of tumours. Pathology and genetics of tumours of the breast and female genital organs. Lyon: IARC Press; 2003. p. 114–133.
2. Daraï E, Fauvet R, Uzan C, Gouy S, Duvillard P, Morice P. Fertility and borderline ovarian tumor: a systematic review of conservative management, risk of recurrence and alternative options. Hum Reprod Update. 2013; 19: 151–166.
3. Shigematsu H, Lin L, Takahashi T, Nomura M, Suzuki M, Wistuba II, Fong KM, Lee H, Toyooka S, Shimizu N, Fujisawa T, Feng Z, Roth JA, et al. Clinical and biological features associated with epidermal growth factor receptor gene mutations in lung cancers. J Natl Cancer Inst. 2005; 97: 339–346.
4. Shih, IeM; Kurman, RJ. Molecular pathogenesis of ovarian borderline tumors: new insights and old challenges. Clin Cancer Res. 2005; 11: 7273–7279.
5. Yewale C, Baradia D, Vhora I, Patil S, Misra A. Epidermal growth factor receptor targeting in cancer: a review of trends and strategies. biomaterials. 2013; 34: 8690–8707.
6. Mayr D, Hirschmann A, Löhrs U, Diebold J. KRAS and BRAF mutations in ovarian tumors: a comprehensive study of invasive carcinomas, borderline tumors and extraovarian implants. Gynecol Oncol. 2006; 103: 883–387.
7. Casanova ML, Larcher F, Casanova B, Murillas R, Fernández-Aceñero MJ, Villanueva C, Martínez-Palacio J, Ullrich A, Conti CJ, Jorcano JL. A critical role for ras-mediated, epidermal growth factor receptor-dependent angiogenesis in mouse skin carcinogenesis. Cancer Res. 2002; 62: 3402–3407.
8. Siwak DR, Carey M, Hennessy BT, Nguyen CT, McGahren Murray MJ, Nolden L, Mills GB. Targeting the epidermal growth factor receptor in epithelial ovarian cancer: current knowledge and future challenges. J Oncol. 2010; 2010: 568938.
9. Coward JI, Middleton K, Murphy F. New perspectives on targeted therapy in ovarian cancer. Int J Womens Health. 2015; 7: 189–203.
10. Pirker R, Pereira JR, Szczesna A, von Pawel J, Krzakowski M, Ramlau R, Vynnychenko I, Park K, Yu CT, Ganul V, Roh JK, Bajetta E, O’Byrne K, de Marinis F, et al. Cetuximab plus chemotherapy in patients with advanced non-small-cell lung cancer (FLEX): an open-label randomised phase III trial. Lancet. 2009; 373: 1525–1531.
11. Lo HW, Xia W, Wei Y, Ali-Seyed M, Huang SF, Hung MC. Novel prognostic value of nuclear epidermal growth factor receptor in breast cancer. Cancer Res. 2005; 65: 338–348.
12. Xia W, Wei Y, Du Y, Liu J, Chang B, Yu YL, Huo LF, Miller S, Hung MC. Nuclear expression of epidermal growth factor receptor is a novel prognostic value in patients with ovarian cancer. Mol Carcinog. 2009; 48: 610–617.
13. Hadzisejdić I, Mustać E, Jonjić N, Petković M, Grahovac B. Nuclear EGFR in ductal invasive breast cancer: correlation with cyclin-D1 and prognosis. Mod Pathol. 2010; 23: 392–403.
14. Wang YN, Hung MC. Nuclear functions and subcellular trafficking mechanisms of the epidermal growth factor receptor family. Cell Biosci. 2012; 2: 13.
15. Lin SY, Makino K, Xia W, Matin A, Wen Y, Kwong KY, Bourguignon L, Hung MC. Nuclear localization of EGF receptor and its potential new role as a transcription factor. Nat Cell Biol. 2001; 3: 802–808.
16. Gershenson DM, Silva EG, Tortolero-Luna G, Levenback C, Morris M, Tornos C. Serous borderline tumors of the ovary with noninvasive peritoneal implants. Cancer. 1998; 83: 2157–2163.
17. Della Pepa C, Tonini G, Santini D, Losito S, Pisano C, Di Napoli M, Cecere SC, Gargiulo P, Pignata S. Low Grade Serous Ovarian Carcinoma: from the molecular characterization to the best therapeutic strategy. Cancer Treat Rev. 2015; 41: 136–143.
18. Chen AP, Zhang J, Liu H, Zhao SP, Dai SZ, Sun XL. Association of EGFR expression with angiogenesis and chemoresistance in ovarian carcinoma. Zhonghua Zhong Liu Za Zhi. 2009; 31: 48–52.
19. Nielsen JS, Jakobsen E, Hølund B, Bertelsen K, Jakobsen A. Prognostic significance of p53, Her-2, and EGFR overexpression in borderline and epithelial ovarian cancer. Int J Gynecol Cancer. 2004; 14: 1086–1096.
20. Fujiwara S, Terai Y, Kawaguchi H, Takai M, Yoo S, Tanaka T, Tsunetoh S, Sasaki H, Kanemura M, Tanabe A, Yamashita Y, Ohmichi M. GPR30 regulates the EGFR-Akt cascade and predicts lower survival in patients with ovarian cancer. J Ovarian Res. 2012; 5:35.
21. Brustmann H. Epidermal growth factor receptor expression in serous ovarian carcinoma: an immunohistochemical study with galectin-3 and cyclin D1 and outcome. Int J Gynecol Pathol. 2008; 27:380–389.
22. van Haaften-Day C, Russell P, Boyer CM, Kerns BJ, Wiener JR, Jensen DN, Bast RC Jr, Hacker NF. Expression of cell regulatory proteins in ovarian borderline tumors. Cancer. 1996; 77: 2092–2098.
23. Boyd J, Luo B, Peri S, Wirchansky B, Hughes L, Forsythe C, Wu H. Whole exome sequence analysis of serous borderline tumors of the ovary. Gynecol Oncol. 2013; 130: 560–564.
24. Stemke-Hale K1, Shipman K, Kitsou-Mylona I, de Castro DG, Hird V, Brown R, Flanagan J, Gabra H, Mills GB, Agarwal R, El-Bahrawy M. Frequency of mutations and polymorphisms in borderline ovarian tumors of known cancer genes. Mod Pathol. 2013; 26: 544-552
25. Anglesio MS1, Arnold JM, George J, Tinker AV, Tothill R, Waddell N, Simms L, Locandro B, Fereday S, Traficante N, Russell P, Sharma R, Birrer MJ; AOCS Study Group, et al. Mutation of ERBB2 provides a novel alternative mechanism for the ubiquitous activation of RAS-MAPK in ovarian serous low malignant potential tumors. Mol Cancer Res. 2008; 6: 1678–1690.
26. Ma F, Sun T, Shi Y, Yu D, Tan W, Yang M, Wu C, Chu D, Sun Y, Xu B, Lin D. Polymorphisms of EGFR predict clinical outcome in advanced non-small-cell lung cancer patients treated with Gefitinib. Lung Cancer. 2009; 66: 114–119.
27. Kaneko K, Kumekawa Y, Makino R, Nozawa H, Hirayama Y, Kogo M, Konishi K, Katagiri A, Kubota Y, Muramoto T, Kushima M, Ohmori T, Oyama T, et al. EGFR gene alterations as a prognostic biomarker in advanced esophageal squamous cell carcinoma. Front Biosci (Landmark Ed). 2010; 15: 65–72.
28. Lemos-González Y, Páez de la Cadena M, Rodríguez-Berrocal FJ, Rodríguez-Piñeiro AM, Pallas E, Valverde D. Absence of activating mutations in the EGFR kinase domain in Spanish head and neck cancer patients. Tumour Biol. 2007; 28: 273–279.
29. Singer G, Shih IeM, Truskinovsky A, Umudum H, Kurman RJ. Mutational analysis of K-ras segregates ovarian serous carcinomas into two types: invasive MPSC (low-grade tumor) and conventional serous carcinoma (high-grade tumor). Int J Gynecol Pathol. 2003; 22: 37–41.
30. Wong KK, Tsang YT, Deavers MT, Mok SC, Zu Z, Sun C, Malpica A, Wolf JK, Lu KH, Gershenson DM. BRAF mutation is rare in advanced-stage low-grade ovarian serous carcinomas. Am J Pathol. 2010; 177: 1611–1617.
31. Singer G, Kurman RJ, Chang HW, Cho SK, Shih IeM. Diverse tumorigenic pathways in ovarian serous carcinoma. Am J Pathol. 2002; 160: p. 1223–1228.
32. Singer G, Oldt R 3rd, Cohen Y, Wang BG, Sidransky D, Kurman RJ, Shih IeM. Mutations in BRAF and KRAS characterize the development of low-grade ovarian serous carcinoma. J Natl Cancer Inst. 2003; 95: 484–486.
33. Bösmüller H, Fischer A, Pham DL, Fehm T, Capper D, von Deimling A, Bonzheim I, Staebler A, Fend F. Detection of the BRAF V600E mutation in serous ovarian tumors: a comparative analysis of immunohistochemistry with a mutation-specific monoclonal antibody and allele-specific PCR. Hum Pathol. 2013; 44: 329–335.
34. Tsang YT, Deavers MT, Sun CC, Kwan SY, Kuo E, Malpica A, Mok SC, Gershenson DM, Wong KK. KRAS (but not BRAF) mutations in ovarian serous borderline tumour are associated with recurrent low-grade serous carcinoma. J Pathol. 2013; 231: 449–456.
35. Szablewski V, Solassol J, Poizat F, Larrieux M, Crampette L, Mange A, Bascoul-Mollevi C, Costes V. EGFR expression and KRAS and BRAF mutational status in intestinal-type sinonasal adenocarcinoma. Int J Mol Sci. 2013; 14: 5170–5181.
36. Dekanić A, Dintinjan RD, Budisavljević I, Pećanić S, Butorac MŽ, Jonjić N. Strong nuclear EGFR expression in colorectal carcinomas is associated with cyclin-D1 but not with gene EGFR amplification. Diagn Pathol. 2011; 6: 108.
37. Lee ES, Lee Y, Suh D, Kang J, Kim I. Detection of HER-2 and EGFR gene amplification using chromogenic in-situ hybridization technique in ovarian tumors. Appl Immunohistochem Mol Morphol. 2010; 18: 69–74.
38. Anagnostou VK, Welsh AW, Giltnane JM, Siddiqui S, Liceaga C, Gustavson M, Syrigos KN, Reiter JL, Rimm DL. Analytic Variability in Immunohistochemistry Biomarker Studies. Cancer Epidemiol Biomarkers Prev. 2010; 19: 982–991.
39. Lambros MB, Simpson PT, Jones C, Natrajan R, Westbury C, Steele D, Savage K, Mackay A, Schmitt FC, Ashworth A, Reis-Filho JS. Unlocking pathology archives for molecular genetic studies: a reliable method to generate probes for chromogenic and fluorescent in situ hybridization. lab Invest. 2006; 86: 398–408.
40. Scartozzi M, Bearzi I, Mandolesi A, Pierantoni C, Loupakis F, Zaniboni A, Negri F, Quadri A, Zorzi F, Galizia E, Berardi R, Biscotti T, Labianca R, Masi G, et al. Epidermal Growth Factor Receptor (EGFR) gene copy number (GCN) correlates with clinical activity of irinotecan-cetuximab in K-RAS wild-type colorectal cancer: a fluorescence in situ (FISH) and chromogenic in situ hybridization (CISH) analysis. BMC Cancer. 2009; 9: 303.