
Introduction
Gliomas are the most malignant primary brain tumors and account for more than 70% of all primary brain tumors [1;2]. Current therapies result in a median survival of 12–15 months [3]. Therefore, understanding the mechanisms of glioma development and finding new therapeutic options is clinically significant. Glioma development is a multistep process that results from changes in genetic and epigenetic mechanisms [4;5]. Histone methylation is a dynamic process that has been associated with either transcriptional activation or repression [6] and emerging evidence suggests that alterations in histone methylation play a vital role in many neoplastic processes [7]. Unlike genetic alterations, epigenetic changes are reversible and thus, targeting epigenetic changes represents a promising therapeutic approach.
The lysine-specific demethylase-1 (KDM1; also known as LSD1, AOF2 or BHC110) gene encodes a flavin-dependent monoamine oxidase, which can demethylate mono- and dimethylated lysines, specifically histone H3, lysines 4, 9, 27 and 36 [8]. KDM1 is highly conserved in eukaryotes and required for many physiological functions [9]. Recent investigations found that KDM1 interacts with nuclear receptors and chromatin-modifying corepressor complexes such as the Co-Rest complex [10;11]. KDM1 also interacts with non-histone substrates including p53 [12] and pRb [13]. KDM1 is overexpressed in different cancer types, including neuroblastoma [14], prostate, breast, and colon cancers [15]. Even though these findings suggest a role of KDM1 in cancer progression, the significance of KDM1 in glioma progression remain elusive.
In this study, we examined the status of KDM1 in gliomas by using tumor tissue arrays and tested the therapeutic significance of pharmacological inhibition of the KDM1 axis in gliomas by using both in vitro and in vivo preclinical xenograft models. Our results demonstrate that deregulation of KDM1 expression occurs during glioma progression with highest expression in high-grade gliomas. Pharmacological inhibition of either KDM1 activity or knockdown of its expression via siRNA reduces the proliferation of established as well as patient-derived primary GBM cells. Mechanistic studies showed that KDM1 inhibitors promote apoptosis of glioma cells via activation of p53 pathway.
Results
KDM1 is overexpressed in gliomas and its expression correlates with histological malignancy
Recent evidence attributed an oncogenic role for KDM1 in various malignancies [19]. To determine the status of KDM1 in gliomas, we checked the expression of KDM1 using glioma tissue arrays that contain the different grades of gliomas as well as normal brain tissues and the intensity of staining was scored as described previously [18]. The representative staining for each grade is shown in Fig. 1A. KDM1 expression was significantly higher in gliomas than in normal brain tissues and positively correlated with histological malignancy (Fig. 1B). Western blot analysis of total lysates from glioma cell lines revealed that higher KDM1 expression in the majority of the tested glioma cell lines (Fig. 1C). These results suggest that KDM1 is highly expressed in gliomas.
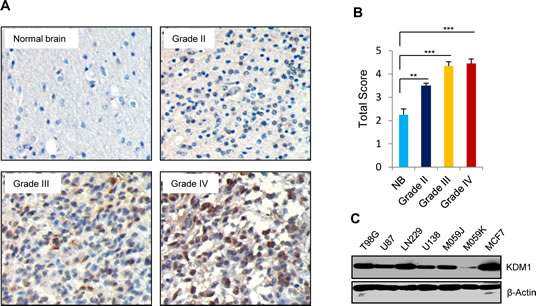
Figure1: KDM1 expression is elevated in gliomas. (A) Glioma tissue microarray containing control brain (n=16), as well as grade II (n=130), grade III (n=29) and grade IV (n=33) glioma specimens was subjected to immunohistochemical staining with the KDM1 antibody as described in the methods section. (B) Quantitation of total score in each grade was done as described in the methods section, bars, SEM. **, p< 0.05. ***, p< 0.001 (C) Whole cell lysates from various glioma cell lines were subjected to Western blot analysis, and blots were probed with KDM1 antibody. MCF7 cells were used as a positive control and β-actin served as internal control.
KDM1 inhibition reduces the glioma cell proliferation and colony formation
To examine the significance of KDM1 in glioma cells, we knocked down KDM1 expression by using the siRNA approach. U87 and LN229 cells were transiently transfected with KDM1-siRNA or control-siRNA. Western blot analysis showed that KDM1 expression was ~80% less in KDM1-siRNA than in control siRNA transfected cells (Fig 2A). Cell proliferation assays revealed that glioma cell proliferation in KDM1 knockdown cells was significantly less than that of control siRNA (Fig 2B). To further probe the function of KDM1, we used pharmacological inhibitors of KDM1 (pargyline and NCL-1) that are known to inhibit the KDM1 enzyme activity [20]. As shown in Fig. 2C, treatment of glioma cells with either pargyline or NCL-1 significantly reduced their proliferation in a dose-dependent manner. Further, clonogenic assays revealed that pargyline and NCL-1 significantly reduced the colony formation ability of glioma cells (Fig. 2D). These results suggest that inhibition of KDM1 has potential to impair the glioma cell proliferation.
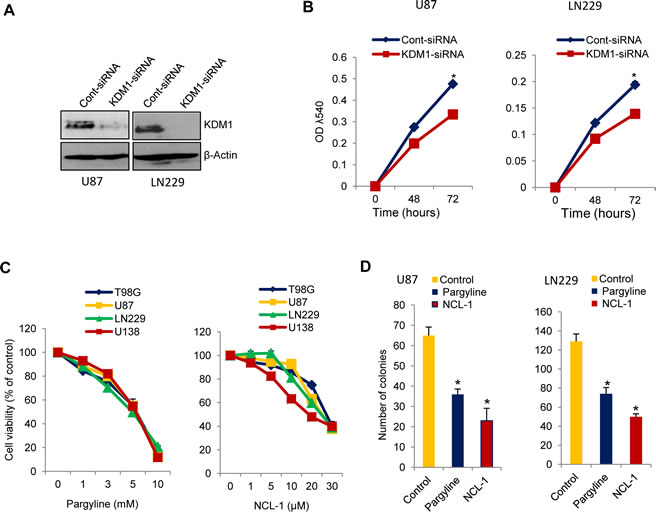
Figure2: Inhibition of KDM1 expression or functions reduced the proliferation of glioma cell lines. (A) U87 and LN229 glioma cells were transiently transfected with KDM1 siRNA or control siRNA using the oligofectamine transfection reagent. After 72 h, whole cell lysates were subjected to Western blot analysis using the KDM1 antibody. β-actin was used as a loading control. (B) U87 and LN229 cells transfected with KDM1 siRNA or control siRNA were seeded in 96-well plates (2 x 10³ cells/well) and the proliferation was determined at 48 h and 72 h by using the MTT assay. All data presented are the mean of 3 independent experiments with mean ± SEM. *, p< 0.05. (C) T98G, U87, LN229 and U138 glioma cells were treated with vehicle or varying concentration of pargyline or NCL-1 for 72 h, and proliferation was measured by using the MTT assay. (D) U87 and LN229 cells were seeded in 6-well plates and treated with vehicle, pargyline, or NCL-1 for 72 h and allowed to grow for additional 7 days. Colonies were stained with crystal violet and colonies that contain ≥50 cells were counted. All data presented are the mean of 3 independent experiments with mean ± SEM. *, p< 0.05, t test.
KDM1 inhibition modulates acetylation of p53 and activates its target gene expression p21 and PUMA
Recent studies suggest that in addition to modulation of histone substrates, KDM1 associates with p53 and regulates its function by demethylation [12] and that the interplay between p53 methylation and acetylation provide mechanisms for triggering a rapid increase in p53 transcriptional activity. Because inhibition of KDM1 decreased glioma proliferation, we examined whether pharmacological inhibition of KDM1 enhanced acetylation of p53382, a known modification that activates the p53 stability and functions. Pargyline and NCL-1 treatments substantially increased the levels of acetyl-p53382 in both U87 and LN229 glioma cells (Fig. 3A). The total p53 levels were not altered after KDM1 inhibition. We next validated the activation of p53 by KDM1 inhibition using p53 reporter gene assays. As shown in Fig 3B, both the pargyline and NCL-1 treatments significantly increased the p53 reporter activity in both U87 and LN229 glioma cell lines. p53 induces cell cycle arrest and apoptosis by activating the transcription of its target genes p21 and PUMA, respectively. RT-qPCR analysis showed that knockdown of KDM1 significantly increased the mRNA levels of p21 and PUMA in both U87 and LN229 cells (Fig 3C). Similarly, treatment with either pargyline or NCL-1 also significantly increased the p21 and PUMA expression in both U87 and LN229 cell lines (Fig. 3D,E). Accordingly, Western blot analysis showed that treatment with either pargyline or NCL-1 significantly enhanced the p21 levels in both U87 and LN229 cells (Fig. 3F).
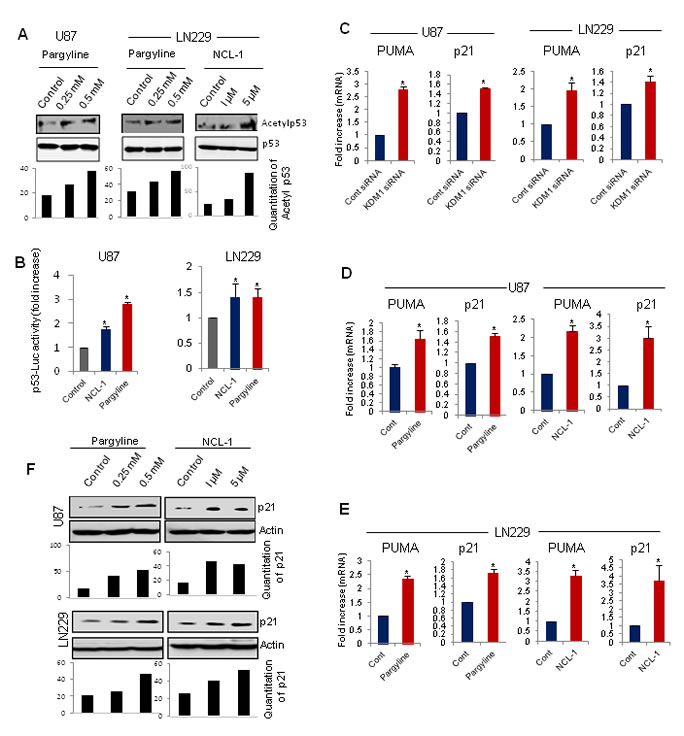
Figure3: KDM1 inhibition enhanced p53 functions and its target gene activation. (A) Whole cell lysates were isolated from vehicle-, pargyline- or NCL-1 treated U87 and LN229 cells and subjected to Western blot analysis with p53 and acetyl-p53382 antibodies (upper panel). Band intensity of acetyl p53 was quantitated by densitometry and normalized to total p53. (B) U87 and LN229 cells were transiently transfected with the p53-Luc reporter and 24 h post transfection, cells were treated with vehicle, pargyline or NCL-1. The reporter gene activity was measured after 24 h. All data presented are the mean of 3 independent experiments with mean ± SEM. *, p< 0.05, t test. (C) U87 and LN229 cells were transfected with control siRNA or KDM1 siRNA and 72 h after transfection, RNA was isolated and subjected to RT-qPCR using the primers specific for p53 target genes p21 and PUMA. All data presented are the mean ± SEM. *, p< 0.05, t test. Total RNA was isolated from vehicle- , pargyline or NCL-1 treated U87 (D) and LN229 (E) cells and subjected to RT-qPCR using the primers specific for p21 and PUMA. All data presented are the mean ± SEM. *, p< 0.05, t test. (F) Whole cell lysates were isolated from vehicle-, pargyline- or NCL-1-treated U87 and LN229 cells and subjected Western blot analysis with p21 antibodies. β-actin used as an internal control. Band intensity of p21was quantitated by densitometry and normalized to total actin.
KDM1 inhibition leads to reduced stem-like glioma cell proliferation
Recent studies indicated that KDM1 regulates neural stem cell proliferation [21], and that metastatic behaviour and resistance to conventional radiation and chemotherapy of glioblastomas is attributed to the presence of stem-like glioma cells (SLGCs) [22;23]. To test whether inhibition of activity of KDM1 reduces SLGCs proliferation, we treated the SLGCs derived from primary GBM samples with pargyline or NCL-1. All the SLGCs tested have elevated levels of KDM1 (Fig. 4A). Pargyline and NCL-1 dose-dependently reduced the proliferation of SLGCs (Fig. 4B). We then studied the expression of neural stem markers such as Nestin and CD133 after treatment with either pargyline or NCL-1. The expression levels of Nestin and CD133 were significantly downregualted in SLGCs after the pargyline and NCL-1 treatments (Fig. 4C). These results further confirm that KDM1 is required for maintaining stemness of SLGCs.
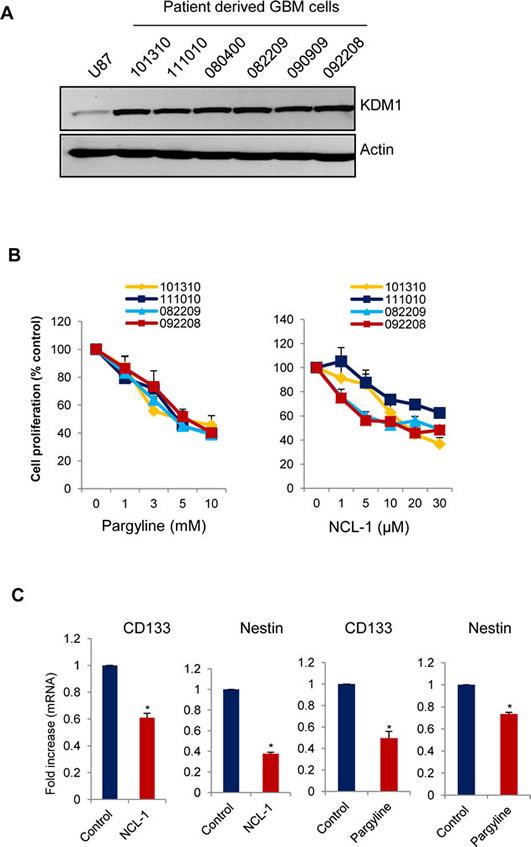
Figure4: KDM1 inhibitors reduced proliferation of SLGCs. (A) Whole cell lysates from various primary GBM cells were subjected to Western blot analysis with KDM1 antibody. β-actin used as an internal control. (B) Primary GBM cells (#101310, 111010, 082209, and 092208) were seeded in 96-well plates and treated with varying concentrations of pargyline or NCL-1 for 72 h and subjected to MTS assay as described in the methods. (C) Primary GBM cells (#111010) were treated with vehicle, pargyline or NCL-1 for 7 days and total RNA was isolated and subjected to RT-qPCR with primers specific for CD133 and nestin. All data presented are the mean ± SEM. *, p< 0.05, t test.
Pargyline treatment inhibits the glioma xenograft tumor growth and induces apoptosis
To study the therapeutic effect of KDM1 inhibition on the growth of gliomas in vivo, we used a nude mice-based subcutaneous glioma xenograft model. NOD/SCID mice were subcutaneously implanted with 1 X 10⁶ U87 glioma cells in their flank regions. When the tumors reached measurable size, the mice were given either pargyline or PBS intraperitonially. Tumor volumes were measured every 5 days and mice were euthanized 30 days after treatment. Compared to PBS, pargyline treatment significantly reduced the tumor growth (Fig.5A). No toxicities were observed in pargyline treatment group as determined by behavioural changes, such as eating habits and mobility, and mouse weights were not significantly different between the control and pargyline-treated groups (Fig. 5B). The expression of Ki-67 (proliferation marker) was significantly lower in the pargyline-treated tumors than in the control tumors (Fig. 5C). TUNEL analysis showed that the number of apoptotic cells was significantly higher in the pargyline-treated tumors than in the control tumors (Fig. 5D). These results suggest that pargyline-mediated reduction in xenograft tumor growth involves both a reduction of proliferation and an induction of apoptosis.
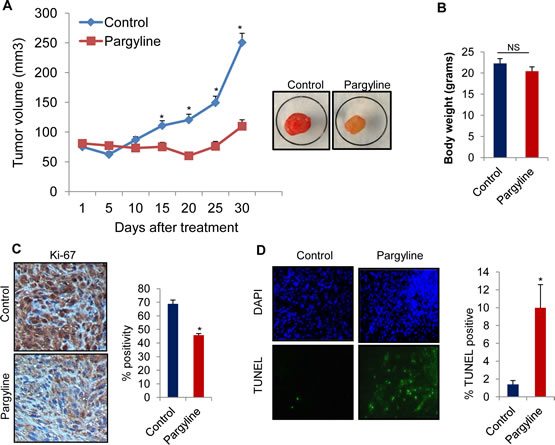
Figure5: Pargyline treatment reduced subcutaneous glioma xenograft tumor growth and induced apoptosis in vivo. (A) NOD/SCID mice were subcutaneously implanted with 1 x 10⁶ U87 cells. After tumors reached a measurable size, mice were treated daily with vehicle or pargyline (100 mg/kg/ bodyweight) for a period of 30 days. Tumor size was measured with calipers every 5 days. A representative picture of a tumor is shown as an inset. (B) Body weights of both vehicle- and pargyline-treated mice were measured weekly. Column, mean body weights. (C) Ki-67 staining in control- and pargyline-treated tumors. Representative images are depicted (left panel). * P <0.05. Ki-67 labelling was quantified as the mean Ki-67 percentage based on at least 10 randomly selected high-power microscope fields per group (right panel) (D) TUNEL staining for apoptosis in control- and pargyline-treated tumors. Representative images are depicted (left panel). TUNEL labelling was quantified as the mean TUNEL labelling percentage based on at least 10 randomly selected high-power microscope fields per group (right panel).
Pargyline treatment increases the global H3K4 methylation and H3K9 acetylation and reduces H3K9 methylation marks in xenograft tumors
To examine whether pargyline blockage of the KDM1 demethylase function affects tumor growth via epigenetic modifications, we determined the status of global H3K4 and H3K9 methylation and H3K9 acetylation marks in xenograft tumors. Immunohistochemical analysis showed that global H3K4 methylation and H3K9 acetylation were significantly greater in pargyline-treated tumors than in control tumors (Fig. 6A). We also observed that H3K9 methylation was significantly reduced in pargyline-treated tumors than in control tumors (Fig. 6A). To examine whether the effects reflect the expression of p53 target genes involved in the repression of growth, we analyzed mRNA expression of p21 and PUMA by using total RNA isolated from xenograft tumors. The expression levels of p21 and PUMA were significantly higher in pargyline-treated xenograft tumors than in control tumors (Fig. 6B). To test whether pargyline treatment promoted the alteration in epigenetic marks at the p53 response element on p21 promoter, we examined the status of the H3K4-me2 and H3K9-me2 marks after treating U87 cells with pargyline. A substantial increase was found in the H3K4-me2 and reduction on H3K9-me2 at the p21 promoters (Fig. 6C). These studies suggest that blockage of the KDM1 axis via pargyline has potential to decrease glioma proliferation in vivo and that pargyline promotes tumor suppressive effects probably by epigenetic modification at promoters of p53 target genes.
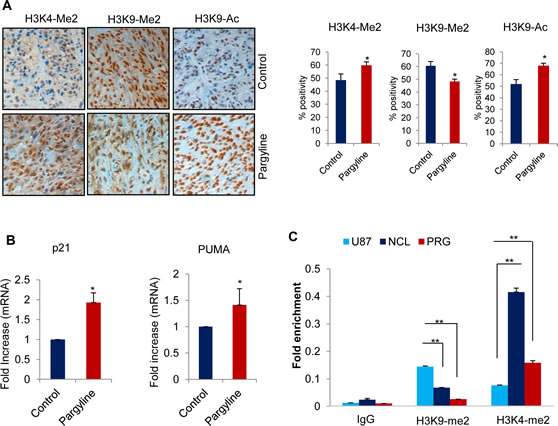
Figure6: Pargyline treatment increased the global H3K4 methylation and H3K9 acetylation marks and reduced the H3K9 methylation in xenograft tumors. (A) IHC analysis of H3K4-me2, H3K9-me2 and H3K9-Ac marks was done on xenograft tumors that were treated with vehicle or pargyline (Left panel). Quantitation was done as described in the methods section. All data presented are the mean ± SEM. *, p< 0.05. (Right panel). (B) Total RNA was isolated from control or pargyline-treated tumors and subjected to RT-qPCR using the primers specific for p21 and PUMA. All data presented are the mean ± SEM. *, p< 0.05. (C) U87 cells were treated with pargyline or NCL-1 and ChIP analysis was performed using H3K4-me2 and H3K9-me2 antibodies and the status of epigenetic modification was analyzed using real-time PCR with p21 promoter-specific primers.
Discussion
Glioma development is a multistep process that involves various genetic and epigenetic alterations [24]. Unlike genetic alterations, epigenetic changes are reversible and thus, targeting epigenetic changes represents a promising therapeutic approach. KDM1 regulates gene expression programs by changing the epigenetic histone marks in gene promoters [10]. In this study, we tested the hypothesis that deregulation of KDM1 promotes glioma progression and tested the therapeutic effect of targeting KDM1 axis using in vitro and in vivo methods. The results using tumor tissue microarray studies revealed that KDM1 is overexpressed in glioma tissues and its expression positively correlates with histological malignancy. Further, our results demonstrated that pharmacological inhibition of KDM1 activity or knockdown of KDM1 expression decreases the proliferation of glioma cell lines by modulating the p53 pathway.
The transcriptional factor p53 functions as a guardian of the genome by modulating appropriate responses to stress. The function of p53 is tightly regulated by various post-translational modifications including acetylation, and methylation. KDM1 demethylates p53K370me2, which prevents its interaction with the coactivator 53BP1, thereby blocking the p53 transcriptional activation and induction of p53-mediated apoptosis [12]. The acetylation of lysines at the C-terminus of p53 protects p53 from ubiquitination, and acetylation at lys382 increases the DNA binding activity of p53 [25] and promotes its interaction with other transcriptional factors [26]. In the present study, we observed that the KDM1 inhibitors pargyline and NCL-1 increase the levels of acetyl-p53382 and increase p53 reporter gene activation. Further, KDM1 inhibition increased induction of the p53 target genes p21 and PUMA. These findings suggest that the blockage of KDM1 functions via pharmacological inhibition may provide a favourable environment for the activation of p53 and its target genes, leading to suppression of gliomas.
KDM1 plays a key role in many physiological functions, and recent studies suggested that KDM1 is often overexpressed in various cancers [27]. KDM1 knockdown reduces proliferation by affecting expression of several genes involved in proliferation including p21, CCNA2, and ERBB2, which arrests the cell cycle at G1/S phase [15]. G0/G1 phase [28] and G2/M phase [29]. In this study, we observed that inhibition of activity or knockdown of KDM1 expression reduced proliferation and colony formation of glioma cell lines in vitro and reduce tumor growth in vivo. Recent TCGA studies revealed TP53 mutations in ~35% gliomas, suggesting an alternate mechanism of WTp53 inactivation occurs in the remaining ~65% of gliomas. Since KDM1 expression is upregulated in gliomas, because KDM1-mediated demethylation reduces p53 transactivation functions, blocking the KDM1 axis could have therapeutic implications for reducing glioma proliferation in WTp53 expressing gliomas.
Recent studies implicate KDM1 as a key player in the maintenance of pluripotency and high levels of KDM1 are needed to maintain the undifferentiated state of human embryonic stem cells [28]. Knockdown of KDM1 or inhibition of its enzymatic activity results in the selective inhibition of pluripotent stem cells proliferation but a lesser effect has been seen on non-pluripotent cancer or normal somatic cells [30]. Recent studies also highlighted the importance of KDM1 in the regulation of neural stem cell proliferation and differentiation. In neural stem cells KDM1 is recruited to the TLX target genes to repress their expression, which regulates the proliferation of neural stem cells and it has also been showed that knockdown of KDM1 or treatment with the KDM1 inhibitors pargyline and tranylcypromine reduced the proliferation of hippocampus neural progenitor cells [21]. Inhibition of KDM1 is also shown to reactivate the ATRA-induced differentiation in acute myeloid leukaemia [31]. In this study, we demonstrated that KDM1 is overexpressed in SLGCs and treatment with KDM1 inhibitors reduces the proliferation of SLGCs. Further KDM1 inhibitors decreased the expression of stemness genes in SLGCs.
KDM1 is a target for monoamine oxidase inhibitors including pargyline and tranylcypromine, which are currently used as antidepressants and are shown to inhibit KDM1 activity. In our study, we used pargyline (trade name: Eutonyl, Supirdyl, Eutron), an FDA approved drug to treat depression and vascular hypertension. Pargyline had significant growth inhibitory properties in vitro. A recent study using in vitro assays found synergistic apoptosis occurred when the combination of KDM1 and HDAC inhibitors was used [32], also supporting our findings. In our study, we further extended these findings and tested the therapeutic potential of the KDM1 inhibitor pargyline in vivo by using a xenograft model. Pargyline treatment reduced glioma growth, increased levels of H3K4-me2 and H3K9-Ac and reduced levels of H3K9-me2, and these changes correlated with increased apoptosis. This proof of principle in vivo study demonstrated the significance of the KDM1 axis in curbing glioma progression. However, the extended period use of a high concentration of pargyline may cause side effects. To overcome this, we are currently developing better inhibitors of KDM1 that work efficiently at lower doses with high specificity. We recently developed the compound NCL-1 that showed significant inhibitory activity on glioma cells in~20 µM range. Using the glioma model cells, we demonstrated that NCL-1 treatment promoted p53 functions as well as modulated optimal epigenetic changes, leading to the activation p53 target genes. Future studies are clearly needed to test its in vivo potential, safety and utility in combinatorial therapy.
In summary, our study findings establish that deregulation of KDM1 expression occurs during glioma progression and provides the first in vivo evidence demonstrating the KDM1 axis as a potential therapeutic target for gliomas. Inhibition of KDM1 alone or in combination with other epigenetic-modifying agents may be a potential tool in the therapeutic intervention of gliomas.
Materials and methods
Cell lines and reagents
Human glioma cell lines U87, T98G, LN229, U138, M059J, M059K and the breast cancer cell line MCF7 were obtained from the American Type Culture Collection (ATCC) and were passaged in our laboratory for less than six months. Glioma cell lines were maintained in DMEM medium, and MCF7 cells were maintained in RPMI-1640 medium supplemented with 10% FBS (Hyclone Laboratories Ltd, Logan, UT). Patient-derived primary glioblastoma cells 101310, 111010, 080400, 082209, 090909 and 092208 were generated from surgically resected tumors as described [16] and propagated in neurobasal medium supplemented with B27 serum-free supplement, EGF (20 ng/ml), bFGF (20 ng/ml), LIF (20 ng/ml) and heparin (5 µg/ml). KDM1-specific siRNA were obtained from Thermo Scientific (Waltham, MA). The KDM1, H3K4-me2, H3K9-me2 and H3K9-Ac antibodies were obtained from Millipore (Billerica, MA), and p53, acetyl-p53, p21 and PUMA antibodies were purchased from Cell Signalling Technology (Danvers, MA). Ki67 was obtained from Dako (Carpinteria, CA). Pargyline, β-actin and all secondary antibodies were purchased from Sigma Chemical Co (St. Louis, MO). N-[(1S)-3-[3-(trans-2-Aminocyclopropyl)phenoxy]-1-(benzylcarbamoyl)propyl]benzamide (NCL-1) was synthesized as previously described [17].
Cell lysis and Western blotting
Whole cell lysates were prepared from glioma cells in modified RIPA buffer (150 mM NaCl, 50 mM Tris-HCl, 50 mM NaF, 5 mM EDTA, 0.5% [wt/vol] sodium deoxycholate and 1% Triton X-100) containing phosphatase and protease inhibitors. Lysates were run on SDS-PAGE followed by Western blotting using indicated antibodies and developed using the ECL methodology.
Cell proliferation and clonogenic assays
Cell proliferation rates were measured by using MTT Cell Viability Assay in 96-well microplates. Glioma cells were seeded in 96-well plates (2 x 10³ cells/well) in DMEM medium containing 10% serum. After an overnight incubation, cells were treated with varying concentrations of pargyline or NCL-1 for 72 h and growth inhibition was determined by using traditional MTT assays. For the primary GBM cells, single-cell suspensions were plated in 96-well plates (1 x 10³ cells/well), and pargyline- or NCL-1-mediated growth inhibition was determined by using traditional MTS assays. For the clonogenic assays, U87 and LN229 cells (500 cells/well) were seeded in 6-well plates. After an overnight incubation, cells were treated with pargyline (3 mM) or NCL-1 (10 µM) for 72 h. Then cells were washed with PBS and allowed to grow for an additional 7 days. The cells were then fixed in ice cold methanol and stained with 0.5% crystal violet solution to visualize the colonies. Colonies that contain ≥ 50 cells were counted.
Quantitative RT-PCR analysis
Total RNA was isolated from glioma cells and xenograft tumor tissues using Trizol Reagent (Invitrogen, Carlsbad, CA) according to the manufacturer’s instructions. Reverse transcription (RT) reactions were performed by using the Superscript III reagent kit (Invitrogen, Carlsbad, CA). Real-time PCR was done by using a Cepheid Smart cycler II (Sunnyvale, CA) with specific real-time PCR primers for following genes: p21: (F) CTGGAGACTCTCAGGGTCGAAA and (R) GATTAGGGCTTCCTCTTGGAGAA; PUMA: (F) ATGCCTGCCTCACCTTCATC and (R) TCACACGTCGCTCTCTCTAAACC; Nestin: (F) AGACACCTGTGCCAGCCTTTC and (R) CTGCTGCAAGCTGCTTACCAC; CD133: (F) GAACAAGTTTACAGTGACTGC and (R) TGCGTTGAAGTATCTTTGACG; and Actin: (F) GTGGGCATGGGTCAGAAG and (R) TCCATCACGATGCCAGTG. Results were normalized to the β-actin transcript levels and the difference in fold expression was calculated by using delta-delta-CT method.
Reporter gene assays
Reporter gene assays were performed as described [18]. Briefly, glioma cell lines U87 and LN229 were seeded in 6-well plates. After overnight incubation, the cells were transfected with p53-Luc plasmid using fugene for 6 h. Then, 24 h after transfection, cells were treated with vehicle, pargyline or NCL-1 for an additional 24 h. Each transfection was carried out in triplicate and normalized with the β-gal activity and total protein concentration. Luciferase activity was measured by using the luciferase assay system (Promega, Madison, WI). Luciferase activity was expressed as percent of relative light units versus untreated transfected cells.
Tissue microarrays and immunohistochemistry
The tissue microarrays (TMAs) were obtained from US BioMax (Rockville, MD). Each TMA comprised 0.6-mm cores taken from paraffin-embedded specimens that represent a total of 192 glioma tissues and 8 each of adjacent normal tissue and normal brain tissues. Immunohistochemical analysis was performed using Allred scoring methodology as described in our earlier publication [18]. Allred score takes into consideration the proportion of positive cells (scored on a scale of 0-5) and staining intensity (scored on a scale of 0-3). The proportion of positive stained cells was rated as 1 = between 0% and 1% positive, 2 = between 1% and 10%, 3 = between 10% and 33%, 4 = between 33% and 66%, and 5 = between 66% and 100%. The preparation of negative controls was accomplished by replacing the primary antibody with control rabbit IgG. The sections were scored by 3 evaluators blinded to the patient’s clinical status. Xenograft tumor sections were incubated overnight with Ki-67, H3K4-Me2, H3K9-me2 and H3K9-Ac primary antibodies and positivity was visualized by using the DAB substrate and counterstained with haematoxylin (Vector Lab, Inc. Burlingame, CA). The proliferative index was calculated as the percentage of Ki-67-positive cells in 10 randomly selected microscopic fields at 100X per slide. TUNEL analysis was done by using the In situ Cell Death Detection Kit (Roche, Indianapolis, IN) as per the manufacturer’s protocol and 10 randomly selected microscopic fields in each group were used to calculate the relative ratio of TUNEL-positive cells.
Chromatin immunoprecipitation assay
U87 cells were seeded in 100 mm plates and after overnight incubation cells were treated with vehicle or pargyline. Then, cells were cross-linked using 1% formaldehyde, and the chromatin was subjected to immunoprecipitation using H3K4-me2 and H3K9-me2 antibodies. Isotype-specific IgG was used as a control. Extracted DNA was dissolved in TE buffer and subjected to real-time PCR using p21 specific p53RE primers. p21 (-1391) F-CTGTCCTCCCCGAGGTCA, p21 (-1391) R- ACATCTCAGGCTGCTCAGAGTCT.
Xenograft studies
All animal experiments were performed after obtaining UTHSCSA-IACUC approval. The animals were housed in accordance with UTHSCSA institution’s protocol for animal experiments. For xenograft tumor assays, 1 x 10⁶ U87 cells were mixed with an equal volume of matrigel and implanted subcutaneously into the flanks of 6-week-old female NOD/SCID mice as described [18]. Once the tumors reached measurable size, mice were divided into control and treatment groups. The control group received PBS, and the treatment group received pargyline (100 mg/kg in PBS) i.p. per day for a period of 30 days. Tumor volumes were measured with a caliper at 5-day intervals. After the 30th day, the mice were euthanized, and the tumors were isolated and processed for histological studies. Tumor volume was calculated by using a modified ellipsoidal formula: tumor volume = ½ (L x W2), where L is the longitudinal diameter and W is the transverse diameter [18]. Body weight was measured at weekly intervals for monitoring of the drug toxicity.
Statistical analysis
SPSS software was used for all statistical analyses. A Student’s t-test was used to assess statistical differences between control and pargyline-treated groups. The level of significance was set at P<0.05. Statistical differences among groups were analyzed with ANOVA.
Funding
This study was supported by NIH-CA0095681, NS050730 and Cancer Center Support Grant P30CA054174
Acknowledgements
We thank Valerie Cortez for help in setting up KDM1 inhibitor assays and other members of Vadlamudi lab for critical reading of the manuscript.
Conflict of Interest Statement:
Authors have no conflict of interests
Reference
1. Ohgaki H, Kleihues P: Genetic alterations and signaling pathways in the evolution of gliomas. Cancer Sci 2009;100:2235-2241.
2. Louis DN, Ohgaki H, Wiestler OD, Cavenee WK, Burger PC, Jouvet A, Scheithauer BW, Kleihues P: The 2007 WHO classification of tumours of the central nervous system. Acta Neuropathol 2007;114:97-109.
3. Dunn GP, Rinne ML, Wykosky J, Genovese G, Quayle SN, Dunn IF, Agarwalla PK, Chheda MG, Campos B, Wang A, Brennan C, Ligon KL, Furnari F, Cavenee WK, Depinho RA, Chin L, Hahn WC: Emerging insights into the molecular and cellular basis of glioblastoma. Genes Dev 2012;26:756-784.
4. Nagarajan RP, Costello JF: Molecular epigenetics and genetics in neuro-oncology. Neurotherapeutics 2009;6:436-446.
5. Ohgaki H, Kleihues P: Genetic pathways to primary and secondary glioblastoma. Am J Pathol 2007;170:1445-1453.
6. Martin C, Zhang Y: The diverse functions of histone lysine methylation. Nat Rev Mol Cell Biol 2005;6:838-849.
7. Kouzarides T: Chromatin modifications and their function. Cell 2007;128:693-705.
8. Lan F, Nottke AC, Shi Y: Mechanisms involved in the regulation of histone lysine demethylases. Curr Opin Cell Biol 2008;20:316-325.
9. Wang J, Scully K, Zhu X, Cai L, Zhang J, Prefontaine GG, Krones A, Ohgi KA, Zhu P, Garcia-Bassets I, Liu F, Taylor H, Lozach J, Jayes FL, Korach KS, Glass CK, Fu XD, Rosenfeld MG: Opposing LSD1 complexes function in developmental gene activation and repression programmes. Nature 2007;19;446:882-887.
10. Metzger E, Wissmann M, Yin N, Muller JM, Schneider R, Peters AH, Gunther T, Buettner R, Schule R: LSD1 demethylates repressive histone marks to promote androgen-receptor-dependent transcription. Nature 2005;437:436-439.
11. Garcia-Bassets I, Kwon YS, Telese F, Prefontaine GG, Hutt KR, Cheng CS, Ju BG, Ohgi KA, Wang J, Escoubet-Lozach L, Rose DW, Glass CK, Fu XD, Rosenfeld MG: Histone methylation-dependent mechanisms impose ligand dependency for gene activation by nuclear receptors. Cell 2007;128:505-518.
12. Huang J, Sengupta R, Espejo AB, Lee MG, Dorsey JA, Richter M, Opravil S, Shiekhattar R, Bedford MT, Jenuwein T, Berger SL: p53 is regulated by the lysine demethylase LSD1. Nature 2007;449:105-108.
13. Chau CM, Deng Z, Kang H, Lieberman PM: Cell cycle association of the retinoblastoma protein Rb and the histone demethylase LSD1 with the Epstein-Barr virus latency promoter Cp. J Virol 2008;82:3428-3437.
14. Schulte JH, Lim S, Schramm A, Friedrichs N, Koster J, Versteeg R, Ora I, Pajtler K, Klein-Hitpass L, Kuhfittig-Kulle S, Metzger E, Schule R, Eggert A, Buettner R, Kirfel J: Lysine-specific demethylase 1 is strongly expressed in poorly differentiated neuroblastoma: implications for therapy. Cancer Res 2009;69:2065-2071.
15. Hayami S, Kelly JD, Cho HS, Yoshimatsu M, Unoki M, Tsunoda T, Field HI, Neal DE, Yamaue H, Ponder BA, Nakamura Y, Hamamoto R: Overexpression of LSD1 contributes to human carcinogenesis through chromatin regulation in various cancers. Int J Cancer 2011;128:574-586.
16. Yuan X, Curtin J, Xiong Y, Liu G, Waschsmann-Hogiu S, Farkas DL, Black KL, Yu JS: Isolation of cancer stem cells from adult glioblastoma multiforme. Oncogene 2004;23:9392-9400.
17. Ueda R, Suzuki T, Mino K, Tsumoto H, Nakagawa H, Hasegawa M, Sasaki R, Mizukami T, Miyata N: Identification of cell-active lysine specific demethylase 1-selective inhibitors. J Am Chem Soc 2009;131:17536-17537.
18. Sareddy GR, Nair BC, Gonugunta VK, Zhang QG, Brenner A, Brann DW, Tekmal RR, Vadlamudi RK: Therapeutic significance of estrogen receptor beta agonists in gliomas. Mol Cancer Ther 2012;11:1174-1182.
19. Lokken AA, Zeleznik-Le NJ: Breaking the LSD1/KDM1A addiction: therapeutic targeting of the epigenetic modifier in AML. Cancer Cell 2012;21:451-453.
20. Cortez V, Mann M, Tekmal S, Suzuki T, Miyata N, Rodriguez-Aguayo C, Lopez-Berestein G, Sood AK, Vadlamudi RK: Targeting PELP1-KDM1 axis as a potential therapeutic strategy for breast cancer. Breast Cancer Res 2012;%19;14:R108.
21. Sun G, Alzayady K, Stewart R, Ye P, Yang S, Li W, Shi Y: Histone demethylase LSD1 regulates neural stem cell proliferation. Mol Cell Biol 2010;30:1997-2005.
22. Singh SK, Hawkins C, Clarke ID, Squire JA, Bayani J, Hide T, Henkelman RM, Cusimano MD, Dirks PB: Identification of human brain tumour initiating cells. Nature 2004;432:396-401.
23. Vescovi AL, Galli R, Reynolds BA: Brain tumour stem cells. Nat Rev Cancer 2006;6:425-436.
24. Huse JT, Holland EC: Targeting brain cancer: advances in the molecular pathology of malignant glioma and medulloblastoma. Nat Rev Cancer 2010;10:319-331.
25. Luo J, Li M, Tang Y, Laszkowska M, Roeder RG, Gu W: Acetylation of p53 augments its site-specific DNA binding both in vitro and in vivo. Proc Natl Acad Sci U S A 2004;101:2259-2264.
26. Barlev NA, Liu L, Chehab NH, Mansfield K, Harris KG, Halazonetis TD, Berger SL: Acetylation of p53 activates transcription through recruitment of coactivators/histone acetyltransferases. Mol Cell 2001;8:1243-1254.
27. Chen Y, Jie W, Yan W, Zhou K, Xiao Y: Lysine-specific histone demethylase 1 (LSD1): A potential molecular target for tumor therapy. Crit Rev Eukaryot Gene Expr 2012;22:53-59.
28. Adamo A, Sese B, Boue S, Castano J, Paramonov I, Barrero MJ, Izpisua Belmonte JC: LSD1 regulates the balance between self-renewal and differentiation in human embryonic stem cells. Nat Cell Biol 2011;13:652-659.
29. Scoumanne A, Chen X: The lysine-specific demethylase 1 is required for cell proliferation in both p53-dependent and -independent manners. J Biol Chem 2007;282:15471-15475.
30. Wang J, Lu F, Ren Q, Sun H, Xu Z, Lan R, Liu Y, Ward D, Quan J, Ye T, Zhang H: Novel histone demethylase LSD1 inhibitors selectively target cancer cells with pluripotent stem cell properties. Cancer Res 2011;71:7238-7249.
31. Schenk T, Chen WC, Gollner S, Howell L, Jin L, Hebestreit K, Klein HU, Popescu AC, Burnett A, Mills K, Casero RA, Jr., Marton L, Woster P, Minden MD, Dugas M, Wang JC, Dick JE, Muller-Tidow C, Petrie K, Zelent A: Inhibition of the LSD1 (KDM1A) demethylase reactivates the all-trans-retinoic acid differentiation pathway in acute myeloid leukemia. Nat Med 2012;18:605-611.
32. Singh MM, Manton CA, Bhat KP, Tsai WW, Aldape K, Barton MC, Chandra J: Inhibition of LSD1 sensitizes glioblastoma cells to histone deacetylase inhibitors. Neuro Oncol 2011;13:894-903.