
INTRODUCTION
RAS proteins are small 21-kDa GTPases that activate a variety of key cellular processes including growth, proliferation, and migration [1–3]. In humans, three RAS genes encode four highly homologous RAS proteins: HRAS, NRAS, KRAS4A and KRAS4B, with the latter two resulting from alternative splicing of exon 4 of the KRAS gene [4–6]. All RAS isoforms are expressed almost ubiquitously and interact with the same activator and effector molecules, suggesting that they are functionally redundant [7–10]. However, it was proposed that the highly variable carboxyl-terminal of 25 amino acid residues might provide the isoforms with different biological functions [6, 10–12]. For example, Millan et al. reported that HRAS exhibited a stronger activation of NF-κB signaling than KRAS and NRAS in NIH3T3 cells, thus rendering them more resistant to staurosporine-induced apoptosis [13].
Activating mutations in RAS genes have been identified in approximately 15 - 30% of human cancers [3, 4]. These mutations, resulting in unrestrained RAS activity, lead to the sustained activation of diverse signaling pathways involved in carcinogenesis [2]. Cancer mutation databases (e.g., the COSMIC database; http://cancer.sanger.ac.uk/cosmic) show that mutation frequencies are highly biased among RAS genes in a given type of cancer [4, 9, 14]. For example, activating mutations in the KRAS gene prevail in lung, colon and pancreatic cancers, while mutations in NRAS and HRAS are rarely found in these cancer types. Likewise, activating mutations in NRAS are predominantly found in hematopoietic malignancies, where mutations in HRAS are rarely detected. Mutations in HRAS occur preferentially in tumors of the skin and salivary glands. In liver cancer, activating mutations in KRAS and NRAS are found considerably more frequently than in HRAS [4, 9, 14]. Based on the biased mutation frequencies observed among the RAS genes in different types of cancer, it was suggested that an intrinsic difference in the tumorigenic potential among the RAS isoforms might occur for a given type of cancer. In support of this hypothesis, Haigis et al. showed that a constitutively active form of KRAS is more tumorigenic than that of NRAS in mouse models of colon cancer, possibly explaining why mutations in KRAS are more frequently observed than NRAS in human colon tumors [15]. However, the apparent biases in mutation frequencies among the RAS genes in human cancers could be caused by factors other than differential oncogenic characteristics of RAS isoforms, such as differences in expression levels or mutation rates due to different genomic locations among the RAS genes [16, 17].
Here, we compared the tumorigenic potential of the four RAS isoforms in the liver using non-germline transgenic mouse models. The methodology employs a hydrodynamics-based transfection method, coupled with the Sleeping Beauty (SB) transposon system, which has been successfully used to generate various transgenic models for liver cancer [18, 19]. An open reading frame (ORF) encoding an activated form of each RAS isoform was placed under the same promoter and regulatory elements in the same transposon vectors to rule out differential regulation of transcription and translation. Further, transposons are randomly integrated in a chromosome of each cell, thus minimizing the locus effect [20].
RESULTS
Generation of transgenic models expressing constitutively active RAS isoforms
To investigate whether there is any difference in the hepatocarcinogenic potential among activated RAS isoforms, we developed transgenic mouse models expressing activated human RAS isoforms in the liver. For this purpose, we employed hydrodynamic transfection (HT) coupled with the Sleeping Beauty (SB) transposon system [18, 19].
First, we tested the differential hepatocarcinogenic potential among RAS isoforms carrying the same activating mutation (i.e., encoding valine instead of glycine at codon 12). For this purpose, we constructed transposons encoding HRASG12V, KRAS4AG12V, KRAS4BG12V, and NRASG12V by placing the open reading frame (ORF) for each activated RAS isoform into transposon-based expression vectors (Figure 1A). Isoform-specific RAS expression of the constructed transposons was confirmed by Western blotting using whole protein extracts from Hep3B cells transfected with individual transposons. Notably, Western blotting revealed that the phosphorylation levels of major downstream effectors of RAS pathways—such as AKT, MEK and ERK—were similar among cells expressing each RAS isoform (Figure 1B). Compared to cells transfected with transposons encoding enhanced green fluorescent protein (EGFP), elevated levels of the phosphorylated proteins characterized all RAS-transfected cells (Figure 1B). The results suggest that RAS proteins expressed from the transposons were equally functional.
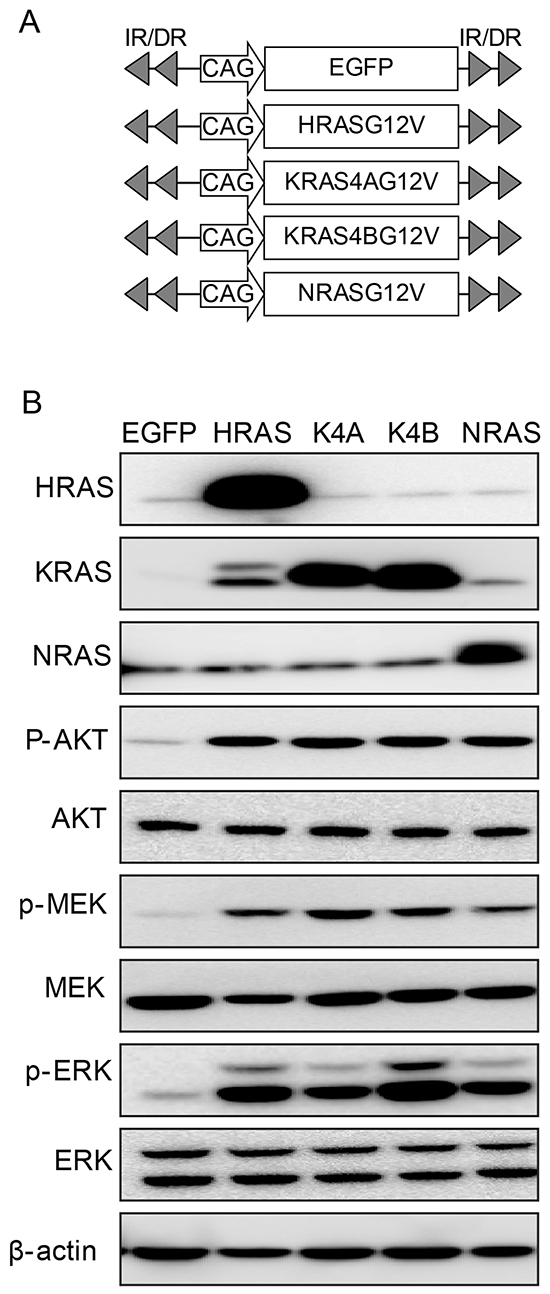
Figure 1: Transposons encoding each form of activated RAS. A. Schematic illustration of transposons encoding activated RAS isoforms. Transposons encoding enhanced green fluorescent protein (EGFP) were used as a negative control. B. Expression of RAS and activation of downstream effector molecules were confirmed in Hep3B hepatoma cells transfected with the indicated transposons. Two days after transfection, Western blotting was performed using whole proteins extracted from cells. K4A and K4B indicate KRAS4AG12V and KRAS4BG12V, respectively.
Activated RAS alone cannot induce tumors in the liver, while concomitant p53 knockdown using a short hairpin RNA (shp53) efficiently induces liver cancer [21]. Thus, transposons encoding each activated RAS isoform and transposons expressing shp53 were co-delivered to the liver via hydrodynamic injection along with plasmids expressing SB transposase (Figure 2A). Livers were harvested at 23 days post-hydrodynamic injection (PHI). Numerous tumor nodules were found in livers from HRASG12V, KRAS4BG12V, and NRASG12V mice. Tumor burden was most severe in KRAS4BG12V mice with tumor lesions occupying most of the liver parenchyma (Figure 2B). Much fewer and smaller nodules were detected in livers from KRAS4AG12V mice compared to mice expressing other RAS isoforms. No tumors were detected in control livers expressing EGFP (Figure 2B) as well as in livers injected only with transposons encoding activated RAS (data not shown). Consistent with macroscopic observation, ratios of liver weight/body weight (LW/BW) were highest in KRAS4BG12V mice and lowest in KRAS4AG12V mice, in the order of KRAS4BG12V > NRASG12V ≈ HRASG12V > KRAS4AG12V ≈ EGFP (Figure 2C).
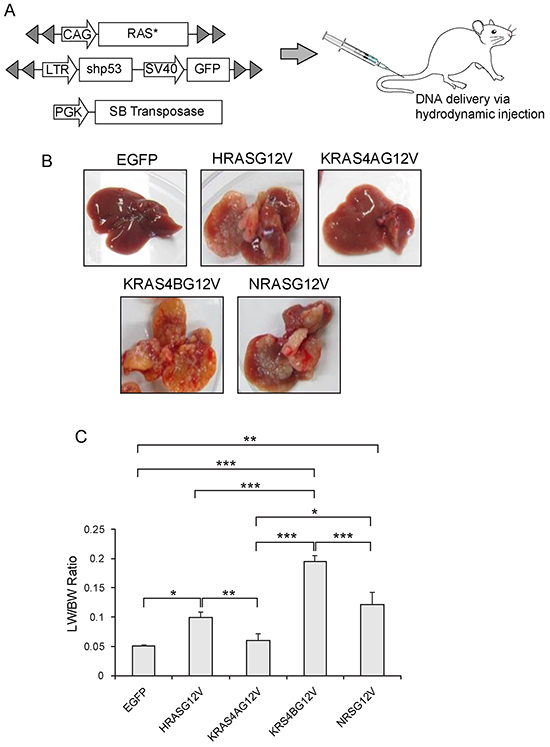
Figure 2: Expression of an activated RAS isoform and shp53 in the liver via hydrodynamic transfection. A. Schematic illustration of the experimental procedure to generate transgenic livers expressing an activated form of RAS (RAS*) and short hairpin RNA downregulating p53 (shp53). Hydrodynamic transfection was performed using a mixture of the indicated plasmids. B. Gross morphology of representative livers harvested at 23 days post-hydrodynamic injection from mice expressing each RAS isoform with the same activating mutation at codon 12 resulting in the substitution of valine for glycine. Liver expressing EGFP is shown as a control. C. Liver weight/body weight (LW/BW) ratios of mice expressing the indicated RAS isoforms. Mice expressing HRASG12V, KRAS4BG12V and NRASG12V had significantly higher LW/BW ratios compared to control mice expressing EGFP. Note that the LW/BW ratio of KRAS4AG12V mice is similar to that of EGFP mice. The graph represents mean LW/BW ± SD. Single, double and triple asterisks indicate p < 0.05, p < 0.01 and p < 0.001, respectively.
Equivalent hepatocarcinogenic potential of activated HRAS, KRAS4B and NRAS genes
Activating mutations can also arise in RAS genes at codons 13 and 61. In particular, activating mutations at codon 61 occur more frequently than at codon 12 of HRAS and NRAS in most cancer types, in contrast to KRAS where a mutation at codon 12 is predominant [14]. To investigate whether the tumorigenic potential can be enhanced by shifting the position of an activating mutation to codon 61 in HRAS and NRAS, transposons encoding HRASQ61L and NRASQ61K were used to induce liver tumors. When livers were harvested at 23 days PHI, no differences were detected in tumor burden among livers expressing KRAS4BG12V, HRASQ61L and NRASQ61K (Figure 3A). Consistently, no differences were seen in LW/BW ratios among the three groups (Figure 3B). This strongly indicates that the intrinsic oncogenic potential does not differ among HRAS, NRAS and KRAS proto-oncogenes and that the codon positions of an activating mutation in RAS can affect the oncogenic potential of a given type of RAS isoform. Although activating mutations in HRAS are observed considerably less frequently in liver cancer compared to NRAS or KRAS [4, 9, 14], our data show that activated HRAS has an oncogenic potential equal to that of NRAS or KRAS counterparts in the liver, calling for further research to explain the biased mutation frequencies among the RAS isoforms found in human cancers.
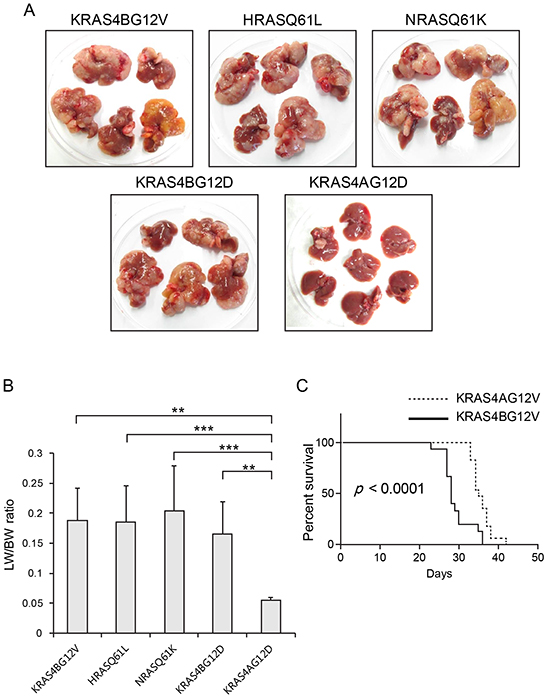
Figure 3: Expression of RAS isoforms with different types of activating mutations. A. Gross morphology of representative livers harvested from mice expressing each form of activated RAS at 23 days post-hydrodynamic injection. The amino acid substitutions at codon 61 in HRAS and NRAS (resulting in HRASQ61L and NRASQ61K, respectively) rendered HRAS and NRAS as oncogenic as KRAS4BG12V. Livers expressing KRAS4BG12D had similar tumor burdens as those expressing KRAS4BG12V. Note that tumors were fewer and smaller in livers expressing KRAS4AG12D compared to those in KRAS4BG12D livers. B. Liver weight/body weight (LW/BW) ratios of mice expressing the indicated RAS isoforms. Note that LW/BW ratios differed significantly between KRAS4A and other RAS isoforms. The graph represents mean LW/BW ± SD. C. Kaplan–Meier survival curves of mice expressing KRAS4AG12V and KRAS4BG12V following hydrodynamic transfection. Differences in survival were highly significant (P < 0.0001).
Another interesting question regarding mutations in RAS is whether activating mutations at the same codon position that result in different amino acid substitutions endow RAS with different oncogenic characteristics. Previous studies using knock-in mouse models showed that KRASG12D induced hyperplasia in tissues more efficiently than KRASG12V, raising the possibility that KRASG12D and KRASG12V might have different oncogenic potentials [22, 23]. To address this question, transposons encoding KRASG12D and KRASG12V were used for hydrodynamic transfection. When livers were harvested and grossly examined at 23 days PHI, KRASG12D and KRASG12V livers showed no significant differences in tumor burden (Figure 3A). The LW/BW ratios confirmed this finding (Figure 3B). Thus, we speculate that the substitution of valine and aspartic acid at codon 12 has a similar effect on the oncogenic potential of KRAS, at least in the mouse liver.
Activated KRAS4A is less oncogenic than activated KRAS4B in the liver
To test whether the differences in tumor growth between KRAS4AG12V and KRAS4BG12V livers can also be seen in another frequently found mutation in the KRAS gene, a hydrodynamic injection experiment was performed using transposons encoding KRAS4AG12D and KRAS4BG12D. As found in KRAS4AG12V and KRAS4BG12V mice, KRAS4AG12D mice had fewer and smaller tumors in the liver than KRAS4BG12D mice at 23 days after hydrodynamic injection (Figure 3A). The LW/BW ratio of KRAS4AG12D mice was almost identical to that of EGFP mice, and about four folds smaller than that of KRAS4BG12D mice (p < 0.01; see Figure 3B).
The results suggest that KRAS4A is less oncogenic than KRAS4B in the liver, irrespective of the type of activating mutation. In addition, the present data suggest that the KRAS4B splicing variant is the major driver of hepatocarcinogenesis when an activating mutation occurs in the KRAS gene. In accordance with these findings, it has been reported that the KRAS4A/4B transcript ratio is significantly reduced in colorectal tumors when compared with that in corresponding non-tumor tissues, further suggesting that activated KRAS4B might be more oncogenic than activated KRAS4A in cancer [24, 25].
To evaluate the effect of reduced tumor growth in KRAS4AG12V livers on the survival of mice, we compared the survival of KRAS4AG12V mice (n=17) and KRAS4BG12V (n=15) mice following hydrodynamic transfection. The survival analysis showed that KRAS4AG12V mice survived significantly longer than KRAS4BG12V mice (p < 10−4), suggesting that reduced tumor development in KRAS4AG12V livers prolonged their life span (Figure 3C).
Reduced cellular proliferation in KRAS4AG12V tumors
Histopathologic examination showed that tumors from both KRAS4AG12V and KRAS4BG12V groups were poorly differentiated HCC. There were no phenotypic differences in tumor cells between the two groups (Figure 4). Tumor cells revealed an almost identical morphology of highly atypical nuclei. Immunohistochemical (IHC) analysis with antibodies against GFP confirmed that the tumors in both groups originated from cells transfected with the transposons (Figure 4).
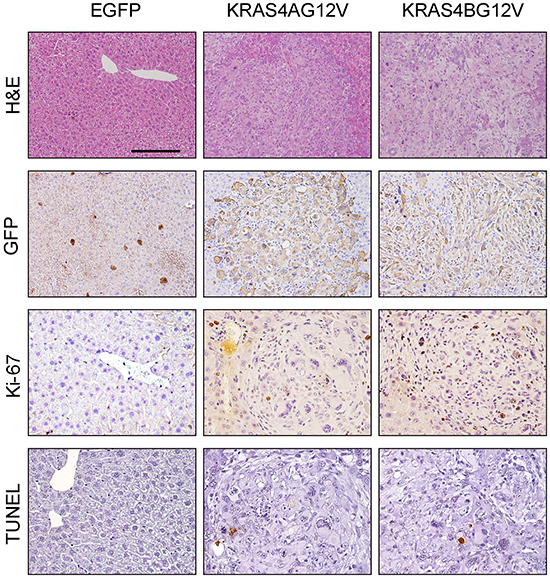
Figure 4: Histological analysis of tumors expressing KRAS4AG12V and KRAS4BG12V. Paraffin sections of KRAS4AG12V and KRAS4BG12V tumors, as well as liver parenchyma from EGFP mice, were stained with H&E, anti-GFP and anti-Ki-67 antibodies and TUNEL reagents. Scale bar: 100 μm for H&E and GFP staining and 50 μm for Ki-67 and TUNEL staining.
To characterize the reduced tumor growth in KRAS4AG12V mice at the cellular level, cell proliferation and apoptosis were investigated in the tumor. Proliferation of tumor cells was significantly reduced in KRAS4AG12V compared to KRAS4BG12V, as determined by Ki-67 staining (Figure 4). Apoptotic cells were rarely detected in tumor sections from both groups using terminal deoxynucleotidyltransferase-mediated dUTP-biotin nick-end labeling (TUNEL) staining (Figure 4). Thus, the decreased level of cellular proliferation is likely responsible for the slower growth of tumors expressing KRAS4AG12V.
Upregulation of p16INK4A in tumors of KRAS4AG12V
To characterize the reduced cellular proliferation in KRAS4AG12V tumors at the molecular level, some players in RAS-dependent growth were compared between KRAS4AG12V and KRAS4BG12V tumors via Western blotting. Whole proteins were extracted from KRAS4BG12V tumors at 23 days PHI and used for immunoblotting. Because nodules were too small in KRAS4AG12V livers at 23 days PHI, whole protein extracts from KRAS4AG12V tumors at 37 days PHI were used instead for this study. Western blotting showed that expression levels of RAS were similar between KRAS4AG12V and KRAS4BG12V tumors (Figure 5). Major downstream effector molecules of RAS signaling pathways were also similarly activated in both groups, as determined by phosphorylation levels of AKT, MEK, and ERK (Figure 5). Thus, the reduced tumor growth of KRAS4AG12V tumors does not depend on low level of the transgene expression or insufficient activation of the PI3K-AKT and RAF-MEK-ERK downstream pathways by the activated KRAS protein.
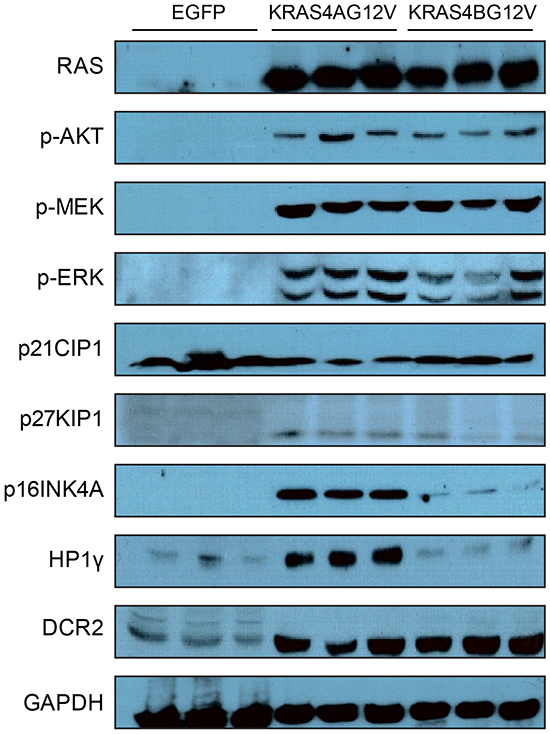
Figure 5: Expression levels of various genes and phosphorylation levels of RAS downstream effector molecules. Tumors were harvested from mice and whole proteins were extracted from each tumor. Protein extracts from livers transfected with EGFP were used as controls. Expression levels of the indicated genes and phosphorylation levels of the indicated proteins were assessed by immunoblotting using the appropriate antibodies. Note that the expression level of P16INK4A, a cyclin-dependent kinase inhibitor, was significantly upregulated in KRAS4AG12V tumors compared to KRAS4BG12V tumors.
Because reduced cellular proliferation was observed in KRAS4AG12V mice, expression levels of genes involved in cell cycle regulation were assessed. We were particularly interested in cyclin-dependent kinase inhibitors (CDKIs) suppressing cell cycle progression because RAS can activate various CDKIs, such as p16INK4A and p21Cip1 [26, 27]. Western blotting revealed that the level of p16INK4A was significantly higher in KRAS4AG12V tumors compared to KRAS4BG12V tumors, while p21Cip1 and P27Kip1 expression did not differ between KRAS4AG12V and KRAS4BG12V malignant lesions (Figure 5). To investigate whether upregulation of p16INK4A can suppress KRAS-driven tumorigenesis, transposons were constructed in which p16INK4A was co-expressed with KRAS4BG12V (Figure 6A). Compared to the control gene encoding firefly luciferase, overexpression of p16INK4A significantly suppressed hepatocarcinogenesis induced by KRAS4BG12V (Figure 6A). Although further analysis is required to elucidate the underlying molecular mechanism, the findings suggest that an activated KRAS4A potentiates upregulation of p16INK4A, which, in turn, functions as a critical tumor suppressor in KRAS4A-driven hepatocarcinogenesis [28].
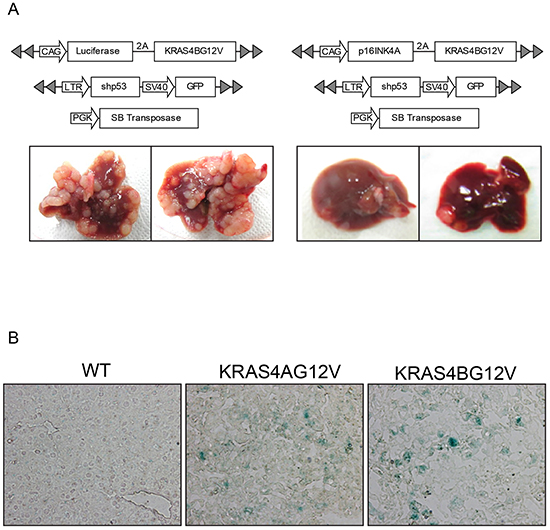
Figure 6: Overexpression of P16INK4A suppresses tumor growth driven by activated KRAS. A. Transposons were constructed that co-express KRAS4BG12V and p16INK4A (or firefly luciferase as a control) in a single open reading frame via 2A-mediated ribosome skipping. Hydrodynamic transfection was performed using the indicated plasmids. Gross morphology of representative livers is shown below. B. Frozen sections of KRAS4AG12V and KRAS4BG12V tumors were assayed using senescence-associated β-gal staining. No difference in β-gal staining level was observed between tumors expressing KRAS4AG12V and KRAS4BG12V.
Upregulated p16INK4A can induce senescence in cells expressing an activated RAS in vitro and in vivo, known as oncogene-induced senescence (OIS) [26, 29, 30]. To investigate whether senescence was involved in p16INK4A-mediated tumor suppression in KRAS4AG12V tumors, Western blotting was performed using antibodies against heterochromatin protein 1 gamma (HP1γ) and decoy receptor 2 (DCR2), molecular markers for senescence [31]. Although the expression level of HP1γ was higher in KRAS4AG12V tumors than in KRAS4BG12V tumors, no difference was seen in DCR2 levels between the two groups (Figure 5). Further, a senescence-associated β-gal assay showed no staining difference in KRAS4AG12V and KRAS4BG12V tumors, suggesting that tumor suppression in KRAS4AG12V tumors by upregulated p16INK4A is not mediated by cellular senescence (Figure 6B).
Since oncogenic mutations in KRAS are predominantly found in human lung, pancreatic and colorectal tumors, it would be intriguing to assess whether KRAS4A and 4B would display a differential carcinogenic potential in those tissues as well. However, the in vivo evaluation of KRAS4A and KRAS4B oncogenic potential in extrahepatic tissues is not as simple as in the liver due to the lack of an efficient and simple method for tissue-specific transgenesis such as hydrodynamic transfection. As an alternative approach, we investigated the oncogenic potential of KRAS4A and 4B using the SW48 human colorectal cancer cell line, which harbors no mutation in RAS genes [32]. SW48 cells stably expressing KRAS4BG12V grew significantly faster than those expressing KRAS4AG12V (Figure 7A), suggesting that KRAS4B is likely more oncogenic than KRAS4A in colorectal tissue. A higher expression of p16INK4A was observed in colorectal cancer cells expressing KRAS4AG12V, compared to those expressing KRAS4BG12V, although both cells exhibited similar levels of KRAS (Figure 7B and 7C).
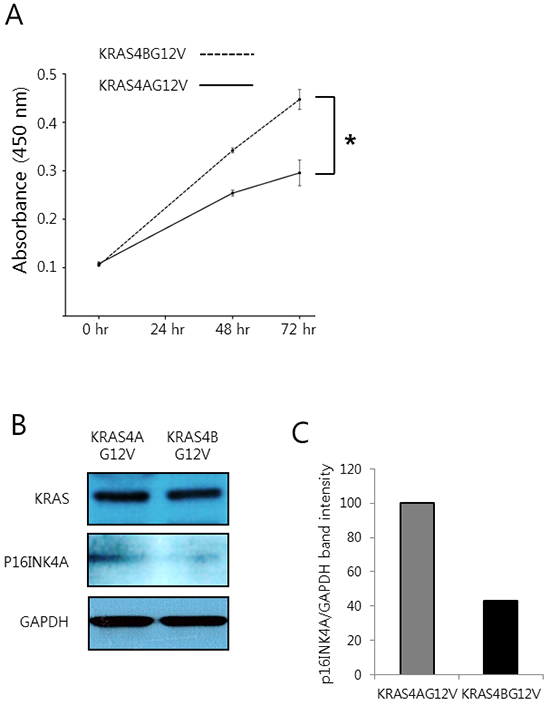
Figure 7: Colorectal cancer cells expressing KRAS4BG12V are more proliferative than those expressing KRAS4AG12V. A. An MTT assay was performed at the indicated time points using the SW48 human colorectal cancer cell line stably expressing KRAS4AG12V and KRAS4BG12V. An asterisk (*) indicates p < 0.05. B. Western blotting was performed using whole proteins extracted from the colorectal cancer cells stably expressing KRAS4AG12V and KRAS4BG12V. C. Densitometry analysis of the western blots shown in (B). Values represent the relative ratio of p16INK4A/GAPDH in cells expressing KRAS4AG12V and KRAS4BG12V.
DISCUSSION
In this study, we compared the oncogenic potential among activated RAS isoforms in the mouse liver and found that no differences in intrinsic oncogenic potential among HRAS, KRAS and NRAS exist. One can assume differential oncogenic characteristics among RAS isoforms from a high frequency of activating mutations in a specific RAS gene for a given type of cancer [4, 9, 14]. However, other factors could result in biased frequencies of activated RAS isoforms in cancers, including differences in tissue-specific gene expression levels and/or mutation rates among the RAS genes due to their different genomic locations. In line with our findings, To et al. showed that HRAS located at the endogenous genomic location of KRAS underwent an activating mutation and induced lung tumors as efficiently as KRAS [33].
The oncogenic potential differed significantly between the two KRAS splicing variants, with KRAS4B being more tumorigenic than KRAS4A in the liver. Thus, it is presumed that when an activating mutation arises in KRAS, KRAS4B will predominantly lead the tumorigenic processes. In colorectal cancer, it was reported that the KRAS4B isoform is selectively overexpressed and thus, the ratio of KRAS4A/4B isoforms is reduced during colorectal carcinogenesis, suggesting that KRAS4B might be more tumorigenic than KRAS4A [24, 25].
Although the mechanism underlying the reduced oncogenicity by KRAS4A was not fully investigated in this study, we detected a significant upregulation of p16INK4A in KRAS4A-driven liver tumors compared to KRAS4B tumors. Ectopic expression of p16INK4A led to significantly reduced tumor growth induced by activated KRAS4BG12V (Figure 6A), emphasizing the tumor-suppressive role of upregulated p16INK4A in KRAS-driven hepatocarcinogenesis. p16INK4A can prevent cell proliferation by inhibiting cell cycle progression. We detected a decreased level of cell proliferation in KRAS4A tumors compared to KRAS4B tumors, but no differences were seen in apoptosis and senescence levels between the two tumors (Figures 4 and 6B). Further investigation is needed to understand the mechanism whereby activated KRAS4A upregulates p16INK4A to a greater degree than activated KRAS4B.
MATERIALS AND METHODS
Plasmids
The pT2/shp53/GFP4, pT2/EGFP, and pPGK-SB13 plasmids were described previously [21].
Human cDNA encoding HRAS, KRAS4B and NRAS were used for site-directed mutagenesis to generate open reading frames (ORFs) encoding HRASG12V, HRASQ61L, KRAS4BG12V, KRAS4BG12D, NRASG12V, and NRASQ61K. ORFs encoding KRAS4AG12V and KRAS4AG12D were generated from KRAS4BG12V and KRAS4BG12D, respectively via PCR using the following primer pairs: forward, 5′-ATG ACT GAA TAT AAA CTT GTG GTA GTT-3′; and reverse, 5′-TTA CAT TAT AAT GCA TTT TTT AAT TTT CAC ACA GCC AGG AGT CTT TTC TTC TTT GCT GAT TTT TTT CAA TCT GTA TTG TCG GAT CTC CCT CAC CAA TGT ATA AAA AGC ATC CTC CAC TCT CTG TCT TGT CTT TGC TGA TGT TTC-3′. Each ORF encoding an activated RAS was substituted for EGFP cDNA in pT2/EGFP. Transposons co-expressing p16INK4A and KRAS4BG12V were generated as follows. After removing the termination codon in cDNA encoding p16INK4A, the DNA sequence encoding the Thosea asigna virus (TaV) 2A peptide with a GSG linker at the N-terminus (i.e., GSGEGRGSLLTCGDVEENPGP) was placed, in-frame, between cDNA encoding p16INK4A and cDNA encoding KRAS4BG12V [34]. Subsequently, the fusion DNA was inserted in pT2/EGFP after removing EGFP cDNA. Transposons co-expressing firefly luciferase and KRAS4BG12V were constructed in the same manner.
Transfection and western blotting
Hep3B cells were transfected with 2μg of plasmid DNA using FuGENE HD Transfection Reagent (Promega, Madison, WI, USA), according to the manufacturer’s instructions. Two days post transfection, cells were lysed in 1× RIPA buffer (#9806; Cell Signaling Technology, Danvers, MA, USA).Western blot experiments were performed using standard methods. Anti-HRAS (sc-520; Santa Cruz Biotechnology, Santa Cruz, CA, USA), anti-KRAS (sc-30; Santa Cruz Biotechnology), anti-NRAS (sc-519; Santa Cruz Biotechnology), anti-AKT (#9272, Cell Signaling Technology, Danvers, MA, USA), anti-phospho-AKT (#4060, Cell Signaling Technology), anti-MEK (#9126, Cell Signaling Technology), anti-phospho-MEK (#9154, Cell Signaling Technology), anti-ERK (#9102, Cell Signaling Technology), anti-phospho-ERK (#4370, Cell Signaling Technology), anti-p16INK4A (10883-1-AP; Proteintech, Chicago, IL, USA), anti-GAPDH (#2118; Cell Signaling Technology), and anti-β-actin (sc-47778; Santa Cruz Biotechnology) were used as primary antibodies, and horseradish peroxidase (HRP)-conjugated anti-rabbit IgG (A0545;Sigma-Aldrich, St. Louis, MO, USA) was used as the secondary antibody.
Stable cell lines and cell proliferation assay
The human SW48 colorectal cancer cell line was transfected with 2μg of pcDNA3- KRAS4AG12V or KRAS4BG12V. Two days post transfection, cells were placed in culture media containing G418 disulfate salt (G-8168; Sigma-Aldrich) for the selection of stably expressing cells. To evaluate proliferation, colorectal cancer cells stably expressing KRAS4AG12V and KRAS4BG12V, respectively, were seeded at a density of 1,500 cells per well in a 96-well plate. At specified time points, an 3-(4,5-dimethylthiazol-2-yl)-2,5-diphenyltetrazolium bromide (MTT) assay was performed according to the manufacturer’s instructions (Cell Viability, Proliferation and Cytotoxicity Assay kit; DOGEN, Seoul, Korea). Absorbance at 450 nm was measured using a microplate reader (VersaMax ELISA Microplate Reader, Molecular Devices, Sunnyvale, CA, USA).
Animal experiments
All experiments using live mice were approved by the Animal Policy and Welfare Committee of the Yonsei University College of Medicine (Seoul, Korea). Wild-type C57BL/6 mice were purchased from Orientbio (Seongnam, Korea). For hydrodynamic injection, 12.5 μg of transposons encoding an activated RAS were mixed with 14 μg of pT2/shp53/GFP4 and 9 μg of pPGK-SB13, and then suspended in 2 ml of Lactated Ringer’s solution. Each DNA solution was injected into the lateral tail vein of 6-week-old C57BL/6 male mice (0.1 ml/g body weight) in less than 7 seconds.
Liver harvesting and histopathological analysis
Mice were deeply anesthetized by intraperitoneal injection of zoletil (30 mg/kg) and xylazine (10 mg/kg). A midline laparotomy incision was performed, and their livers were removed and fixed overnight in freshly prepared 10% neutral-buffered formalin. The remainder of the liver was snap-frozen in liquid nitrogen and stored at −70°C until use. Fixed tissue samples were embedded in paraffin and sectioned into 4-μm slices. Slices were stained with hematoxylin & eosin (H&E). Liver lesions were assessed by certified pathologists and liver experts (S.R. and F.D.) in accordance with the criteria established by Frith et al [35].
Immunohistochemistry (IHC) and TUNEL assay
Paraffin sections were deparaffinized in xylene and rehydrated through a gradual decrease in ethanol concentration. Antigen epitopes were then unmasked using sodium citrate buffer (pH 6.0). Subsequently, the sections were incubated overnight at 4°C using the following primary antibodies: anti-GFP (#2555; Cell Signaling Technology), anti-Ki-67 (ab15580; Abcam, Cambridge, UK). After primary antibody incubation, sections were incubated with a biotinylated anti-rabbit IgG secondary antibody (PK-7200; Vector Laboratories, Burlingame, CA, USA) followed by treatment with freshly prepared DAB substrates (PK-4100; Vector Laboratories). Sections were lightly counter-stained with hematoxylin and mounted. Apoptosis was assessed in liver sections using terminal deoxynucleotidyl transferase-mediated dUTP-biotin nick end-labeling (TUNEL) staining (ApopTag® In Situ Apoptosis Detection Kits; Merck, Billerica, MA, USA). Slides were analyzed and photographed using a microscope (Eclipse Ti; Nikon, Tokyo, Japan) equipped with a digital camera.
Protein harvest from liver and western blotting
Liver tissues were homogenized and digested in 1× RIPA buffer containing phosphatase inhibitor cocktail solution (GenDEPOT, Barker, TX, USA). Western blot experiments were performed following the standard protocol. The following primary antibodies were used: anti-Pan-RAS (sc-14022; Santa Cruz Biotechnology), anti-phospho-AKT (#4060, Cell Signaling Technology), anti-phospho-MEK (#9154, Cell Signaling Technology), anti-phospho-ERK (#4370, Cell Signaling Technology), anti-p21Cip1 (ab2961; Abcam), anti-p27Kip1 (ab7961; Abcam), anti-p16INK4A (10883-1-AP; Proteintech), anti-HP1γ (ab10480, Abcam), anti-DcR2 (ab2019; Abcam), and anti-GAPDH (#2118; Cell Signaling Technology). Anti-rabbit IgG–HRP (Sigma-Aldrich) was used as the secondary antibody. Bands were detected using the enhanced chemiluminescence (ECL) Western blot detection system (Amersham Pharmacia Biotech, Piscataway, NJ, USA).
Senescence-associated β-galactosidase (SA-β-gal) assay
Frozen tissues embedded in OCT compound were sectioned into 6 μm slices. Sections were immediately immersed in a fixative solution (2% formaldehyde and 0.2% glutaraldehyde in PBS) for 15 min at room temperature. Following fixation, sections were stained with β-gal staining solution following the manufacturer’s instructions (#9860; Senescence β-galactosidase staining kit; Cell Signaling Technology). After overnight staining, the β-gal-stained sections were analyzed using a microscope (Eclipse Ti; Nikon).
Statistical analysis
The liver weight/body weight ratio (LW/BW) data were expressed as the means ± SD with sample sizes n = 5 or larger. Statistical analyses of these data were conducted via an unpaired parametric Student’s t-test. Significant differences between two groups were denoted by asterisks (*, p < 0.05; **, p < 0.01; ***, p < 0.001). Kaplan–Meier survival data were evaluated using a log-rank test.
ACKNOWLEDGMENTS
This research was supported by the Basic Science Research Program through the National Research Foundation of Korea, which is funded by the Ministry of Education (NRF-2011-0021830 to S.W.R.).
CONFLICTS OF INTEREST
The authors declare no conflicts of interest.
REFERENCES
1. Downward J. Targeting RAS signalling pathways in cancer therapy. Nat Rev Cancer. 2003; 3:11–22.
2. Pylayeva-Gupta Y, Grabocka E and Bar-Sagi D. RAS oncogenes: weaving a tumorigenic web. Nat Rev Cancer. 2011; 11:761–774.
3. Bos JL. ras oncogenes in human cancer: a review. Cancer Res. 1989; 49:4682–4689.
4. Lau KS and Haigis KM. Non-redundancy within the RAS oncogene family: insights into mutational disparities in cancer. Mol Cells. 2009; 28:315–320.
5. Lowy DR and Willumsen BM. Function and regulation of ras. Annu Rev Biochem. 1993; 62:851–891.
6. Hancock JF. Ras proteins: different signals from different locations. Nat Rev Mol Cell Biol. 2003; 4:373–384.
7. Fiorucci G and Hall A. All three human ras genes are expressed in a wide range of tissues. Biochim Biophys Acta. 1988; 950:81–83.
8. Pells S, Divjak M, Romanowski P, Impey H, Hawkins NJ, Clarke AR, Hooper ML and Williamson DJ. Developmentally-regulated expression of murine K-ras isoforms. Oncogene. 1997; 15:1781–1786.
9. Karnoub AE and Weinberg RA. Ras oncogenes: split personalities. Nat Rev Mol Cell Biol. 2008; 9:517–531.
10. Castellano E and Santos E. Functional specificity of ras isoforms: so similar but so different. Genes Cancer. 2011; 2:216–231. doi: 10.1177/1947601911408081.
11. Rodriguez-Viciana P, Sabatier C and McCormick F. Signaling specificity by Ras family GTPases is determined by the full spectrum of effectors they regulate. Mol Cell Biol. 2004; 24:4943–4954.
12. Omerovic J, Laude AJ and Prior IA. Ras proteins: paradigms for compartmentalised and isoform-specific signalling. Cell Mol Life Sci. 2007; 64:2575–2589.
13. Millan O, Ballester A, Castrillo A, Oliva JL, Traves PG, Rojas JM and Bosca L. H-Ras-specific activation of NF-kappaB protects NIH 3T3 cells against stimulus-dependent apoptosis. Oncogene. 2003; 22:477–483.
14. Prior IA, Lewis PD and Mattos C. A comprehensive survey of Ras mutations in cancer. Cancer Res. 2012; 72:2457–2467.
15. Haigis KM, Kendall KR, Wang Y, Cheung A, Haigis MC, Glickman JN, Niwa-Kawakita M, Sweet-Cordero A, Sebolt-Leopold J, Shannon KM, Settleman J, Giovannini M and Jacks T. Differential effects of oncogenic K-Ras and N-Ras on proliferation, differentiation and tumor progression in the colon. Nat Genet. 2008; 40:600–608.
16. Li Q, Haigis KM, McDaniel A, Harding-Theobald E, Kogan SC, Akagi K, Wong JC, Braun BS, Wolff L, Jacks T and Shannon K. Hematopoiesis and leukemogenesis in mice expressing oncogenic NrasG12D from the endogenous locus. Blood. 2011; 117:2022–2032.
17. Figueiredo ML, Stein TJ, Jochem A and Sandgren EP. Mutant Hras(G12V) and Kras(G12D) have overlapping, but non-identical effects on hepatocyte growth and transformation frequency in transgenic mice. Liver Int. 2012; 32:582–591.
18. Carlson CM, Frandsen JL, Kirchhof N, McIvor RS and Largaespada DA. Somatic integration of an oncogene-harboring Sleeping Beauty transposon models liver tumor development in the mouse. Proc Natl Acad Sci U S A. 2005; 102:17059–17064.
19. Chen X and Calvisi DF. Hydrodynamic transfection for generation of novel mouse models for liver cancer research. Am J Pathol. 2014; 184:912–923.
20. Hackett PB, Ekker SC, Largaespada DA and McIvor RS. Sleeping beauty transposon-mediated gene therapy for prolonged expression. Adv Genet. 2005; 54:189–232.
21. Ju HL, Ahn SH, Kim do Y, Baek S, Chung SI, Seong J, Han KH and Ro SW. Investigation of oncogenic cooperation in simple liver-specific transgenic mouse models using noninvasive in vivo imaging. PLoS One. 2013; 8:e59869.
22. Guerra C, Mijimolle N, Dhawahir A, Dubus P, Barradas M, Serrano M, Campuzano V and Barbacid M. Tumor induction by an endogenous K-ras oncogene is highly dependent on cellular context. Cancer Cell. 2003; 4:111–120.
23. Tuveson DA, Shaw AT, Willis NA, Silver DP, Jackson EL, Chang S, Mercer KL, Grochow R, Hock H, Crowley D, Hingorani SR, Zaks T, King C, et al. Endogenous oncogenic K-ras(G12D) stimulates proliferation and widespread neoplastic and developmental defects. Cancer Cell. 2004; 5:375–387.
24. Plowman SJ, Berry RL, Bader SA, Luo F, Arends MJ, Harrison DJ, Hooper ML and Patek CE. K-ras 4A and 4B are co-expressed widely in human tissues, and their ratio is altered in sporadic colorectal cancer. J Exp Clin Cancer Res. 2006; 25:259–267.
25. Luo F, Ye H, Hamoudi R, Dong G, Zhang W, Patek CE, Poulogiannis G and Arends MJ. K-ras exon 4A has a tumour suppressor effect on carcinogen-induced murine colonic adenoma formation. J Pathol. 2010; 220:542–550.
26. Serrano M, Lin AW, McCurrach ME, Beach D and Lowe SW. Oncogenic ras provokes premature cell senescence associated with accumulation of p53 and p16INK4a. Cell. 1997; 88:593–602.
27. Downward J. Cell cycle: routine role for Ras. Curr Biol. 1997; 7:R258–260.
28. Serrano M, Lee H, Chin L, Cordon-Cardo C, Beach D and DePinho RA. Role of the INK4a locus in tumor suppression and cell mortality. Cell. 1996; 85:27–37.
29. Adams PD. Healing and hurting: molecular mechanisms, functions, and pathologies of cellular senescence. Mol Cell. 2009; 36:2–14.
30. Kuilman T, Michaloglou C, Mooi WJ and Peeper DS. The essence of senescence. Genes Dev. 2010; 24:2463–2479.
31. Collado M and Serrano M. Senescence in tumours: evidence from mice and humans. Nat Rev Cancer. 2010; 10:51–57.
32. Ahmed D, Eide PW, Eilertsen IA, Danielsen SA, Eknæs M, Hektoen M, Lind GE and Lothe RA. Epigenetic and genetic features of 24 colon cancer cell lines. Oncogenesis. 2013; 2:e71.
33. To MD, Wong CE, Karnezis AN, Del Rosario R, Di Lauro R and Balmain A. Kras regulatory elements and exon 4A determine mutation specificity in lung cancer. Nat Genet. 2008; 40:1240–1244.
34. Trichas G, Begbie J, and Srinivas S. Use of the viral 2A peptide for bicistronic expression in transgenic mice. BMC Biol. 2008; 6:40.
35. Frith CH, Ward JM and Turusov VS. Tumours of the liver. IARC Sci. Publ. 1994; 111:223–269.