
INTRODUCTION
Lung cancer is the most commonly diagnosed cancer and the leading cause of cancer death worldwide [1], with a 5-year survival rate of less than 15% in most countries, even if patients accept the standard therapies [2, 3]. In recent years, with the development of abundant open data resources. It is now possible for researchers to identify cancer-related genes much more conveniently and effectively [4, 5]. Through an analysis of the TCGA database, we identified a set of 7 novel lung cancer-related candidate genes that were differentially expressed between cancerous and normal tissues. Our previous microarray analysis yielded similar results (with the fold change of 2.46 between lung cancer tissues and normal tissues) [6]. Through a careful review of the literature, we found a number of these genes had been investigated previously. However, among the as yet unknown genes, ZYG11A showed a much higher fold-change between cancer and paired normal tissues (with an average 5.88 fold-change in the TCGA-LUNG dataset, p<0.00001). We therefore chose ZYG11A as the candidate gene for further investigation.
ZYG11A belongs to the ZYG11 family of genes, which includes three homologues, ZYG11A, ZYG11B and ZER1, in humans [7]. In C. elegans, the orthologous gene zyg11 is important in meiotic progression and embryonic development [8, 9]. However, the function of this gene in humans remains unknown. In the present study, we demonstrate that ZYG11A is a potential oncogene that promotes NSCLC cell proliferation and migration in vitro and in vivo. Moreover, ectopic expression of CCNE1 may contribute to the oncogenic function of ZYG11A.
RESULTS
Bioinformatics analyses implicate ZYG11A as a candidate oncogene in NSCLC
To identify potential lung cancer-related genes, we first analyzed the TCGA datasets: TCGA_LUNG_exp_HiSeqV2-2015-02-24, TCGA_LUAD_exp_HiSeqV2-2015-02-24, and TCGA_LUSC_exp_HiSeqV2-2015-02-24. For these datasets, genes with a fold change > 5, and tumor expression > 3 were included in our analysis. After intersecting the results from different data sources, we obtained a list of 7 genes (details shown in Supplementary Table 1 and Figure 1a). Then the list was reviewed manually on PubMed and Google Scholar. PITX2, HOXC13, and BARX1 act as transcription factors, and have been widely investigated in cancers [10-18]. DLL3 acts as a Notch ligand that is characterized by a DSL domain, EGF repeats, and has also been studied in cancers [19, 20]. Described by NCBI gene, LOC100131726 is a long non-coding RNA. IL1F5, a member of the interleukin 1 cytokine family, involved in the pathogenesis of psoriasis [21, 22]. Although ZYG11A was noted as a cell cycle regulator in the NCBI database, there is little known about the function of ZYG11A.
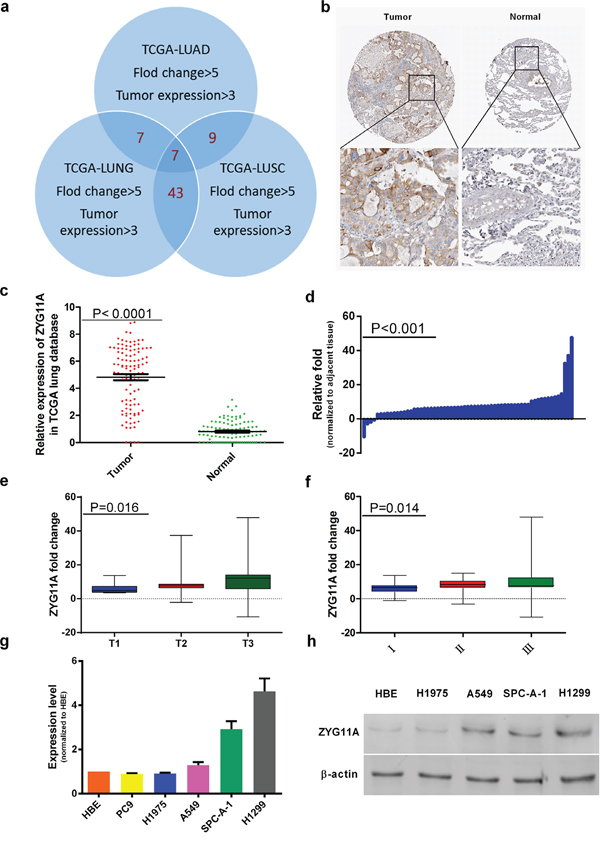
Figure 1: ZYG11A is highly expressed in NSCLC tissues. a. Venn Diagram for gene screening, TCGA datasets genes with fold change > 5 and tumor expression > 3 were included, and a list of 7 genes was obtained. b. Normal lung tissues do not express ZYG11A, but several lung tumor tissues are positive for ZYG11A. c. After analysis of 108 paired tissues, ZYG11A was found to be highly expressed in tumors (p<0.0001). d. ZYG11A is over-expressed in 93.7% (59 of 63) of the lung cancer tissues, with an average over-expression of 9.3-fold (P<0.001) as compared to paired normal tissues. e and f. ZYG11A over-expression is associated with greater T stage (p = 0.016) and TNM stage(p = 0.014). g and h. ZYG11A mRNA and protein are hyper-expressed in H1299 and SPC-A-1 cell lines.
By analyzing the TCGA_LUNG_exp_HiSeqV2-2015-02-24 dataset, compared with normal tissues, ZYG11A expression was 5.88-fold hyper-expressed in cancer tissues (p<0.0001). When focused on 108 paired tissues (the tumor and paired normal lung tissue from a same patient), ZYG11A was over-expressed in tumors compared with paired normal tissues (Figure 1c). Similar results were also observed in lung adenocarcinoma and lung squamous carcinoma databases (Supplementary Figure 1). Then Human Protein Atlas immunohistochemistry (IHC) analyses showed that ZYG11A was not expressed in normal lung tissues, but was expressed in 4 out of 12 (33.3%) NSCLC tumor tissues (Figure 1b).
ZYG11A is over-expressed in NSCLC tumor tissues and correlates with more aggressive clinical characteristics
The expression profile of ZYG11A was further validated by qRT-PCR in 63 paired fresh NSCLC patients’ tissues (tumor and adjacent normal lung tissues). As shown in Figure 1d, ZYG11A was over-expressed in 93.7% (59 of 63) of NSCLC patients, with an average 9.3-fold over-expression (p<0.001). Moreover, over-expression of ZYG11A was positively correlated with bigger primary tumor size (p=0.016) and more advanced TNM stage (p=0.014) (Figure 1e, 1f). However, there were no associations between ZYG11A expression and age, sex, tumor grade, lymph node metastasis, or cancer type (Table 1).
Table 1: Correlation between ZYG11A mRNA expression and clinicopathologic characteristic
Characteristics |
Numbers of Patients |
Percentage |
Fold Change |
p-Value |
Age(years) |
0.096 |
|||
<60 |
19 |
30.20% |
6.1 |
|
>60 |
44 |
69.80% |
9.9 |
|
Sex |
0.269 |
|||
Male |
55 |
87.30% |
9 |
|
Female |
8 |
12.70% |
6.8 |
|
Tumor grade |
0.752 |
|||
High |
1 |
1.60% |
11.6 |
|
Middle |
52 |
82.50% |
8.4 |
|
Low |
10 |
15.90% |
10.2 |
|
Lymph node metastasis |
0.091 |
|||
N0 |
42 |
66.70% |
7.2 |
|
N1 |
7 |
11.10% |
11.1 |
|
N2 |
14 |
22.20% |
12 |
|
Primary Tumor |
0.016* |
|||
T1 |
14 |
22.20% |
5.9 |
|
T2 |
36 |
57.20% |
8 |
|
T3 |
13 |
20.60% |
13.9 |
|
TNM stage |
0.014* |
|||
I |
19 |
30.20% |
6 |
|
II |
28 |
44.40% |
8 |
|
III |
16 |
25.40% |
13.3 |
|
Cancer Type |
0.542 |
|||
Squamous Carcinoma |
13 |
20.60% |
8.5 |
|
Adenocarcinoma |
50 |
79.40% |
8.4 |
*Significant correlation
Knockdown of ZYG11A inhibits NSCLC cell proliferation, invasion, migration and induces G1 cell cycle arrest in vitro
The expression of ZYG11A was compared in different NSCLC cell lines. ZYG11A was hyper-expressed in H1299 and SPC-A-1 cell lines as compared with normal human bronchial epithelial (HBE) cells (Figure 1g, 1h). The Cancer Cell Line Encyclopedia website also indicated similar results. To investigate the biological function of ZYG11A in vitro, two different sets of siRNAs (siRNA-1 and siRNA-2) were utilized to knockdown ZYG11A. Both siRNA constructs were able to effectively decrease ZYG11A mRNA and protein expression (Figure 2a).
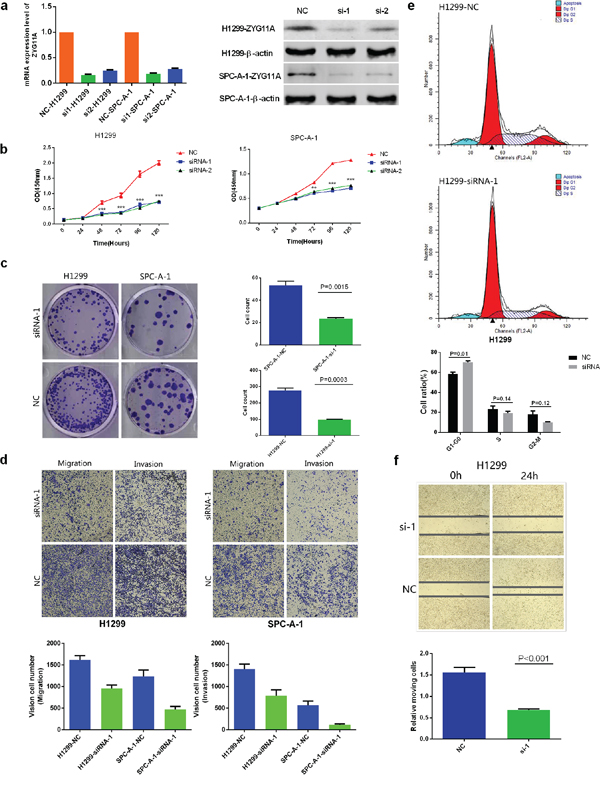
Figure 2: Knockdown of ZYG11A alters NSCLC cell line proliferation, migration, invasion, and cell cycle stage in vitro. a. Two specific siRNAs (siRNA-1, siRNA-2) were designed and synthesized, and siRNA-1 had a better efficiency. b. Depletion of ZYG11A undermines both H1299 and SPC-A-1 cell lines’ proliferation c. Colony numbers of H1299 and SPC-A-1 cells transfected with si-ZYG11A are less than those transfected with si-NC (p = 0.0015 and p = 0.0003). d. Migratory and invasion rates of H1299 or SPC-A-1 cells transfected with si-ZYG11A are decreased compared with NC group. e. H1299 cells transfected with si-ZYG11A display more arrest at G1 phase as compared with cells transfected with si-NC. f. si-ZYG11A impairs migration as compared with NC group (p<0.001).
As shown in Figure 2b, cell-counting kit 8 (CCK-8) assays revealed that knockdown of ZYG11A reduced proliferation of both H1299 and SPC-A-1 cells. Moreover, si-ZYG11A transfected cells had fewer colonies than those transfected with control siRNA (si-NC) (Figure 2c). The trans-well assay showed that migration of H1299 and SPC-A-1 cells was inhibited by siRNA-mediated knockdown of ZYG11A (Figure 2d), and the wound healing assay yielded similar results (Figure 2f). The matrigel invasion assay also revealed that si-ZYG11A treatment impaired the invasion capacities of H1299 and SPC-A-1 cells (Figure 2d). Finally, the effect of ZYG11A on cell cycle distribution and apoptosis was evaluated by flow cytometry analysis. As shown in Figure 2e, si-ZYG11A treatment increased the percentage of H1299 cells in G1 phase compared to si-NC. However, there was no difference in apoptosis between groups (Supplementary Figure 2).
Knockdown of ZYG11A suppresses tumor growth in vivo
We next used a nude mouse xenograft assay with H1299 and SPC-A-1 cells. When compared with the control group, tumor volumes were smaller in the sh-ZYG11A treated groups of both cell lines (Figure 3a, 3c). Xenografts were immunohistologically stained for proliferating cell nuclear antigen (PCNA). Compared with controls, the sh-ZYG11A group showed less PCNA staining (Figure 3b), suggesting that ZYG11A knockdown could inhibit tumor growth in vivo. Intriguingly, expression of CCNE1 was also decreased in the sh-ZYG11A group (Figure 3d).
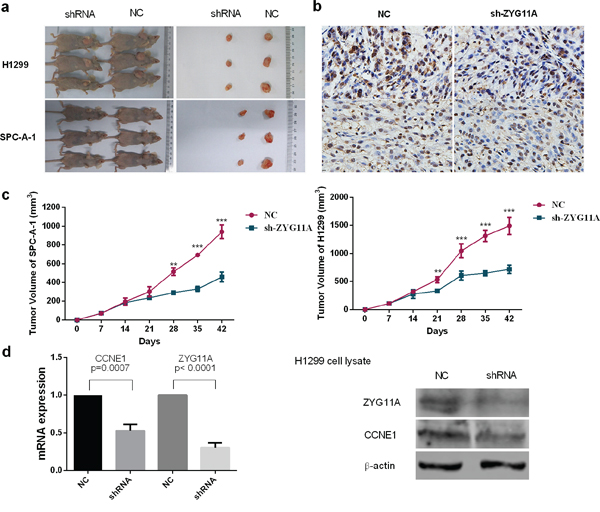
Figure 3: Knockdown of ZYG11A retards tumor growth in vivo. a. Tumor nodules from mice injected with sh-ZYG11A cells are significantly smaller than those injected with NC cells. b. sh-ZYG11A tumors from both H1299 and SPC-A-1 cell lines have less dense PCNA staining. c. Compared with the NC group, the sh-ZYG11A group has reduced tumor size. d. Both mRNA and protein expression of CCNE1 are decreased in the sh-ZYG11A group compared with NC group, and ZYG11A expression is also decreased.
ZYG11A exerts its oncogenic activity via promoting CCNE1 expression
We next used KEGG pathway analysis (DAVID Bioinformatics Resources 6.7) on a list of genes co-expressed with ZYG11A that was obtained from cBioPortal using both RNA-seq and microarray results of Lung Adenocarcinoma (TCGA, Provisional). Most of the genes co-expressed with ZYG11A were enriched in the cell cycle pathway (Figure 4a and Supplementary Table 2). Enrichment analysis using cBioPortal revealed that CCNE1 expression was positively correlated with ZYG11A expression (p<0.001) (Figure 4c), but not CDKN1A, CDKN1B, or CCND1 (Supplementary Figure 3). Given our findings that ZYG11A knockdown decreased cancer cell proliferation, migration, and invasion and promoted G1 cell cycle arrest, we sought to determine expression of cell cycle-related genes in ZYG11A knockdown cells using qRT-PCR and western blot analyses. Consistent with enrichment analyses, when compared with si-NC treatment, si-ZYG11A treatment decreased both mRNA and protein levels of CCNE1, whereas expression of CDKN1A (p21), CDKN1B (p27), and CCND1 were not influenced (Figure 4b, 4d). Then CCNE1 was ectopically expressed in ZYG11A knockdown H1299 cells (Figure 5a), cell proliferation and invasion were recovered, as determined by the CCK8 and transwell assays (Figure 5b, 5c).
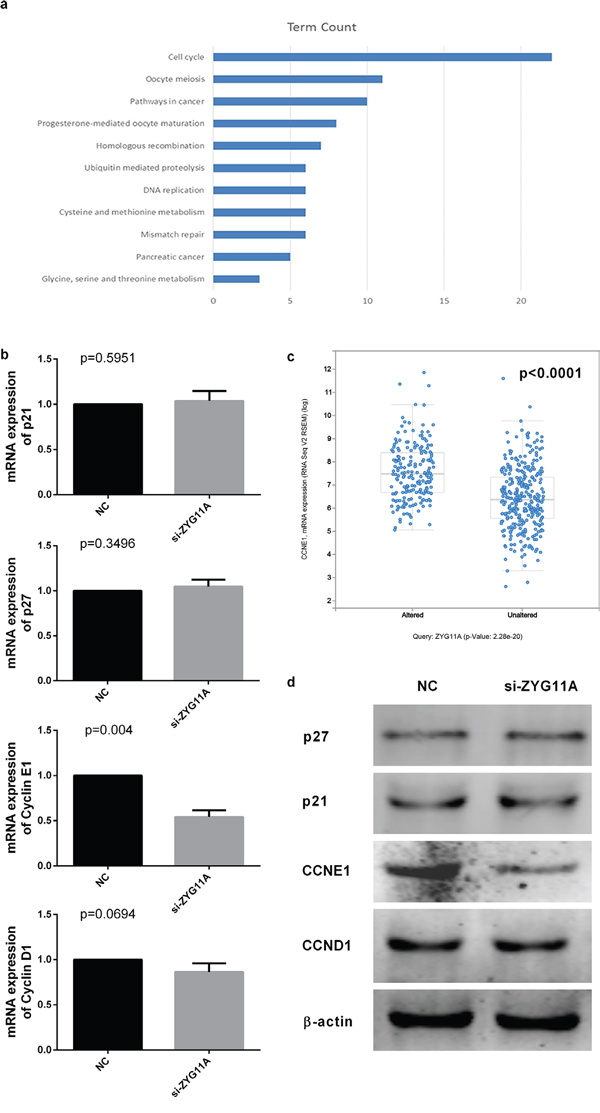
Figure 4: ZYG11A depletion influences CCNE1 expression. a. KEGG pathway enrichment analysis indicates genes co-expressed with ZYG11A are enriched for cell cycle pathways. b. CCNE1 mRNA expression is reduced after transfection with si-ZYG11A (p = 0.004), but the expression of CDKN1 (p21), CDKN2 (p27), and CCND1 were not altered. c. cBioPortal enrichment analysis indicated CCNE1 expression is positively related with ZYG11A expression (p<0.001). d. CCNE1 protein expression is decreased after transfection with si-ZYG11A, with no difference in expression of p21, p27, or CCND1.
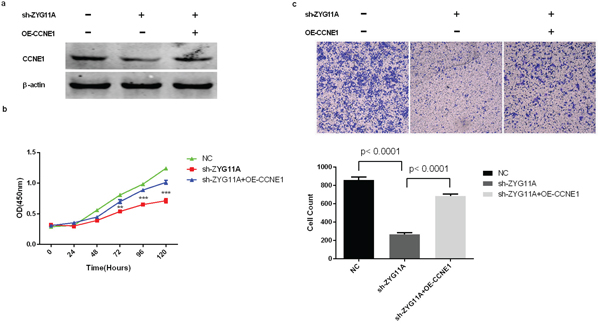
Figure 5: Rescue of proliferation and migration by over-expression of CCNE1 in ZYG11A-depleted cells. a. ZYG11A-depleted H1299 cells transfected with a full-length human CCNE1 have increased expression of CCNE1. b. Depletion of ZYG11A undermines H1299 cell proliferation, but over-expressing CCNE1 recovers proliferation. c. H1299 cells transfected with sh-ZYG11A have a decreased migratory rate when compared with NC transfected cells, but CCNE1 over-expression restores migration.
Prognostic value of ZYG11A protein expression in lung cancer patients
ZYG11A protein was also increased in tumor tissues. After excluding 8/90 tissue pairs for missing data/dots (7 tumor tissues and 1 normal tissues), expression of ZYG11A protein was higher in tumor tissues compared with their relative normal tissues (in 67/82 tissues examined). High ZYG11A expression (as determined by a cut-off score of 140) was detected in 47 (56.6%) of the 83 lung cancer tissues, compared with only 12 (13.5%) of 89 adjacent normal tissue samples. There was a positive correlation between ZYG11A protein expression and patients’ TNM stage (Figure 6a, 6b, 6c, 6d Table 2). Multivariate analyses indicated that increased expression of ZYG11A was associated with poorer overall survival rate (HR: 2.489, 95%CI: 1.248-4.963, p = 0.010). Greater T stage and TNM stage were also associated with poorer prognosis (Table 3). Kaplan-Meier survival curves are shown in Figure 6b (p =0.0022).
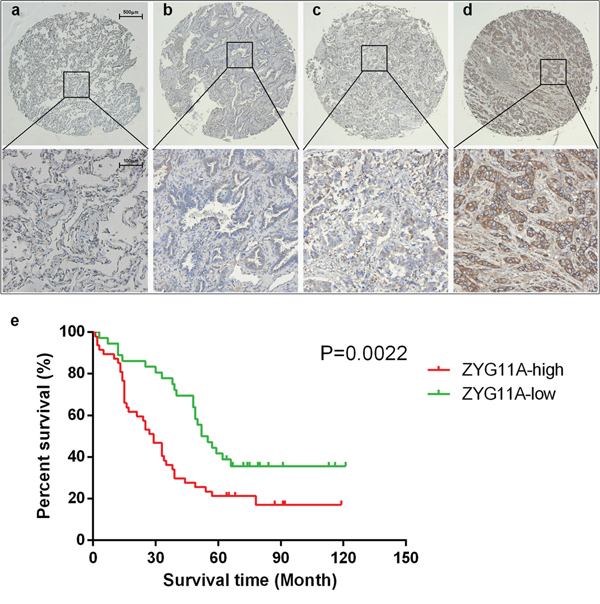
Figure 6: Tissue microarray analysis a, b, c, d. each present an example of normal, I, II, and III TNM stage, ZYG11A expression is associated with TNM stage. e. univariate survival analysis indicated that ZYG11A expression is associated with poorer prognosis p = 0.0022.
Table 2: Sequences of qRT-PCR primer
Gene |
sense |
anti-sense |
ZYG11A |
CCCTCCTGACGCTCAGAAG |
AGATGTTGACCAAAGTGTAGGGA |
CDKN1B |
TGGAGAAGCACTGCAGAGAC |
GCGTGTCCTCAGAGTTAGCC |
CDKN1A |
GCAGACCAGCATGACAGATTT |
GGATTAGGGCTTCCTCTTGGA |
CCND1 |
GCGCTTCCAACCCACCCTCCATG |
GCGCCGCAGGCTTGACTCCAGAA |
CCNE1 |
TTCTTGAGCAACACCCTCTTCTGCAGCC |
TCGCCATATACCGGTCAAAGAAATCTTGTGCC |
ACTB |
GAAATCGTGCGTGACATTAA |
AAGGAAGGCTGGAAGAGTG |
Table 3: Correlation between ZYG11A protein expression and clinicopathologic characteristic
Groups |
ZYG11A |
Pearson χ2 |
P-value |
||
High expression |
Low expression |
||||
Gender |
0.17 |
0.68 |
|||
Male |
24 |
20 |
|||
Female |
23 |
16 |
|||
Age |
0.11 |
0.74 |
|||
<60 |
20 |
14 |
|||
≥60 |
27 |
22 |
|||
Differentiation |
0.09 |
0.76 |
|||
I-II |
35 |
31 |
|||
III-IV |
3 |
2 |
|||
T stage |
2.51 |
0.11 |
|||
T1-T2 |
32 |
30 |
|||
T3-T4 |
15 |
6 |
|||
Lymph node metastasis |
0.03 |
0.86 |
|||
negative |
22 |
16 |
|||
positive |
18 |
12 |
|||
TNM stage |
3.99 |
0.04* |
|||
I-II |
10 |
23 |
|||
III-IV |
19 |
16 |
|||
*Significant correlation
DISCUSSION
ZYG11A is a member of the ZYG11 gene family and was originally cloned by Pawlak et al. and defined as a potential cell cycle regulator [23]. Subsequent studies revealed that the ZYG11 family involved in cell division during meiosis[24]. Its homologue ZYG11B was reported serve as a substrate recruitment subunit for a cullin-2-based E3 ubiquitin ligase [8, 9]. Dysregulation of cullin-2-based E3 ubiquitin system is associated with numerous human diseases, including cancer [23, 25], and correlated with the prognoses of cancer patients [26, 27].
In this study, we present evidence that ZYG11A is over-expressed in NSCLC and that over-expression of ZYG11A is associated with greater tumor size and more advanced TNM stage. ZYG11A is also hyper-expressed in several NSCLC cell lines as compared to a normal HBE line. Using CCK8 assays, apoptosis analyses and colony formation assays, we determined that ZYG11A knockdown inhibits cell proliferation and tumorigenesis, with no effect on apoptosis. Transwell and Matrigel assays further revealed that ZYG11A knockdown undermines cancer cell migration and invasion abilities. Xenograft assays showed that depletion of ZYG11A suppressed proliferation of cancer cells in vivo, while flow cytometric analysis indicated that si-ZYG11A treatment strongly inhibits G1 cell cycle progression, without increased apoptosis.
KEGG and cBioPortal enrichment analyses yielded similar results. We therefore hypothesize that ZYG11A promotes proliferation, migration and invasion of NSCLC cells by inducing G1 cell cycle progression. As previously mentioned, the ZYG11 family may work with E3 ubiquitin ligases to influence cell cycle progression [8, 9, 23, 24, 28, 29]. We therefore measured expression of several cell cycle-related genes to explore the potential mechanisms underlying the oncogenic activity of ZYG11A. We found that CCNE1 expression is specifically decreased by siRNA-mediated ZYG11A knockdown, which was consistent with cBioPortal enrichment analysis (p<0.001).
Cell cycle alteration is one of the hallmarks of cancer [30-32]. CCNE1 is a classic G1/S cell cycle-related protein [33, 34]. Therefore, rescue experiments were performed. We found that ectopic expression of CCNE1 in H1299 cells with ZYG11A knockdown greatly increased their proliferation and migration abilities. Finally, we explored the prognosis values of ZYG11A. Both univariate and multivariate analysis showed that lung cancer patients strongly expressing ZYG11A have a poorer prognosis than those with absent or weaker ZYG11A expression.
Our study suggests that ZYG11A is hyper-expressed in NSCLC and correlates with larger primary tumor size and more advanced TNM stage. ZYG11A can promote proliferation, migration, and invasion of NSCLC cells in vitro and accelerate tumor growth in vivo. In addition, ZYG11A depletion suppresses cell cycle progression by inhibiting CCNE1 expression. This suggests ZYG11A is an oncogene in NSCLC and may represent a novel diagnostic and therapeutic target for treatment of NSCLC.
MATERIALS AND METHODS
Data sources and bioinformatics
Level 3 TCGA data: TCGA_LUNG_exp_HiSeq V2-2015-02-24, TCGA_LUAD_exp_HiSeqV2-2015-02-24 and TCGA_LUSC_exp_HiSeqV2-2015-02-24 were downloaded at the website of the UCSC cancer browser (http://genome-cancer.ucsc.edu), containing 109, 58, and 51 paired normal lung tissue samples respectively. All mRNA expression values were normalized, and values for ZYG11A expression were obtained from the “genomicMatrix” file (using Editplus® software). Fisher’s t-test was used to compare the two groups. In order to determine the protein expression level ZYG11A, the Human Protein Atlas (http://www.proteinatlas.org) was used following their guidelines [35-38]. Then, in order to pick an appropriate cell line for functional research, the Cancer Cell Line Encyclopedia (http://www.broadinstitute.org/ccle/home) was used [39], and the expression of ZYG11A in NSCLC cells was evaluated. Finally, we retrieved and analyzed the data of TCGA using the co-expression and enrichment analysis tool in cBioPortal (http://www.cbioportal.org/) [40]. The list of all genes with highest expression correlation with ZYG11A was submitted to DAVID Bioinformatics Resources 6.7 (http://david.abcc.ncifcrf.gov) for KEGG pathway enrichment analysis as previously described [4, 41-43].
Tissue samples and animal studies
A total of 63 patients had undergone curative surgical resection at Nanjing Medical University Affiliated Cancer Hospital from 2010 to 2013. Two pathologists performed the histopathological classifications in a double-blind fashion. No patient had received preoperative chemotherapy or radiotherapy. The clinical and pathological characteristics of the patients aged between 42 to 84 years (mean: 63) are summarized in Table 1.
For IHC assay based on a TMA (tissue microarray), 180 formalin-fixed paraffin-embedded (FFPE) paired tissue samples from 90 patients were used (after excluding missing data/dots, 89 normal lung tissues, 83 tumor tissues, and 82 tumor/normal pairs were included in further analysis). These tissues were obtained from the Shanghai Biochip Co., Ltd., Shanghai, China (Cat. No. HLug-Ade180Sur-01). Operations occurred between July 2004 and June 2009, All tissues were re-examined by an experienced pathologist after they were transferred from a local hospital and the TNM stage was determined in each patient. This research protocol was approved by the Human Research Ethics Committee of Nanjing Medical University.
All animal studies were conducted in accordance with NIH animal use guidelines and protocols approved by Nanjing Medical University Animal Care Committee. Twelve female nude mice (ages 4–6 weeks) were purchased from Nanjing Medical University School of Medicine’s accredited animal facility. Briefly, 1.0×10⁶ exponentially growing cells with ectopic expression of appropriate genes were injected subcutaneously. Tumor volume was estimated using calipers every week ((length* width^2)/2) [44], then in the sixth week after injection, animals were sacrificed. Tumor nodules were harvested and measured, then immunohistochemically stained with PCNA to assess the proliferation of cells.
Cell lines, cell culture, siRNA, and Lentivirus-based RNA interference transfection
H1299 and A549 cells were obtained from American Type Culture Collection (ATCC, USA), PC-9 cells were a generous gifted from Dr. Zhian Liu, while human bronchial epithelial cell (HBE) and SPC-A-1 cells were gifted by Dr. Zhibin Hu. All cells were grown in RPMI1640 media (Kaiji, Nanjing, China) supplemented with 10% fetal bovine serum and penicillin/streptomycin and cultured at 37°C in a humidified incubator containing 5% CO2. Transfection was performed following the small-interfering RNA (siRNA) sequences transfection protocol for Lipofectamine RNAi MAX (Invitrogen, USA). Nonsense RNAi (nsRNA) was used as a negative control for ZYG11A siRNA. Transfection efficiency was evaluated by quantitative real-time RT-PCR and western blot. Two siRNAs were designed; the sequences were as follows: siRNA-1 for ZYG11A: sense 5′-GCAGUCAUUAGAGAACUUATT-3′, antisense 5′-UAAGUUCUCUAAUGACUGCTT-3′; siRNA-2 for ZYG11A: sense 5′-CCAGUUCCAGACAUCAUAATT-3′, antisense 5′-UUAUGAUGUCUGGAACUGGTT-3′. And the following Nonsense siRNA was used as control: sense 5′- UUCUCCGAACGUGUCACGUTT-3′, antisense 5′-ACGUGACACGUUCGGAGAATT -3′. The human ZYG11A targeting small hairpin RNA sequence was designed based on siRNA-1 and a negative control sequence 5′-GCACTACCAGAGCTAACTCAGATAGTACT-3′. We generated recombinant lentiviral particles and cells were transfected with ZYG11A or negative control recombinant lentivirus (sh-ZYG11A or sh-NC, respectively) as described in our previous article [45]. A Genechem-CCNE1 plasmid expressing full-length human CCNE1 was purchased from Genechem, and an empty plasmid was used as a negative control.
RNA preparation, reverse transcription, and real-time quantitative PCR
Total RNA was extracted from tissues or cultured cells using TRIzol reagent (Invitrogen, Carlsbad, CA, USA). For RT-PCR, 1000 ng total RNA was reverse-transcribed to a final volume of 20μl cDNA using a Reverse Transcription Kit (Takara, cat: RR036A). qRT-PCR analyses were performed with SYBR Select Master Mix (Applied Biosystems, Cat: 4472908). The qRT-PCR primers for ZYG11A, CDKN1A, CDKN1B, CCND1, CCNE1, and ACTB are shown in Table 4. The qRT-PCR data collection was performed using a QuantStudio™ 6 Flex Real-Time PCR System and the qRT-PCR reaction included an initial denaturation step at 95 °C for 10 min, followed by 40 cycles of 92°C for 15 sec and 60°C for 1 min. Each sample was run in triplicate and the relative expression of ZYG11A was calculated and normalized using the 2-ΔΔCt method relative to ACTB.
Table 4: Analysis of independent correlation factors of lung cancer prognosis with Cox multivariate regression analysis
Factor |
SE |
Wald |
DF |
P-value |
HR |
95%CI |
|
Lower |
Upper |
||||||
Gender (male vs female) |
0.419 |
0.007 |
1 |
0.933 |
0.965 |
0.425 |
2.196 |
Age (≥60 vs <60) |
0.402 |
0.417 |
1 |
0.518 |
1.297 |
0.590 |
2.851 |
Differentiation (III-IV vs I-II) |
0.734 |
0.05 |
1 |
0.824 |
1.178 |
0.279 |
4.963 |
T stage (T1-T2 vs T3-T4) |
0.535 |
4.055 |
1 |
0.044* |
0.340 |
0.119 |
0.972 |
Lymphatic metastasis (positive vs negative) |
0.520 |
1.443 |
1 |
0.230 |
1.867 |
0.674 |
5.170 |
TNM stage (III-IV vs I-II) |
0.611 |
5.863 |
1 |
0.015* |
4.386 |
1.325 |
14.515 |
ZYG11A expression (high vs low) |
0.352 |
6.708 |
1 |
0.010* |
2.489 |
1.248 |
4.963 |
SE: standard error; DF: degree of freedom; HR: hazard ratio; CI: confidence interval; Lower: lower limit; Upper: upper limit. *Significant correlation
Protein preparation and western blot
Whole cells were homogenized and treated with lysis buffer on ice (Kaiji, Nanjing, China), and a BCA kit (Kaiji, Nanjing, China) was used to quantify protein concentrations. Equal amounts of protein were loaded in SDS–PAGE gels. After separation in the gel, the protein was transferred onto a PVDF membrane. The membranes were blocked in 2% BSA in TBST for 1 h, and incubated overnight (4°C) with antibodies against ZYG11A (Abcam, ab177696 1:1000), p21 (santa cruz, sc-397 1:500), p27 (santa cruz, sc-528 1:200), Cyclin D1 (CST, 2978 1:1000), Cyclin E1 (abcam, ab7959 1:200) or beta-actin (Cell Signaling, 8H10D10 1:1000). After washing in TBST, the membrane was incubated with goat anti-rabbit HRP-conjugated secondary antibody (1:10,000; Abcam) or goat anti-mouse HRP-conjugated secondary antibody (1:10,000; Abcam) for 2 h at room temperature. The blots were visualized by ECL detection (Thermo Scientific), and all experiments were repeated triple times.
Immunohistochemistry
Tissue sections were deparaffinized and rehydrated through graded alcohol. Endogenous peroxidase activity was blocked by incubation in 3% H2O2. Antigen retrieval was carried out with 0.01 M citrate buffer (pH 6.0) and microwave heat induction. An anti-ZYG11A rabbit polyclonal antibody (CST, HPA030378 1:300) was used.
ZYG11A staining was scored by blinded observers (including a pathologist) according to intensity and percentage of positive cells. The staining intensity was scored according to 4 grades: 0 (No staining), 1 (weak staining), 2 (moderate staining), or 3 (intense staining). The product (percentage of positive cells and respective intensity scores) was used as the final staining score (a minimum value of 0 and a maximum of 300). 140 was used as a cut-off point score and is statistically significant as determined by X-tile software (the Rimm Lab at Yale University; http://www.tissuearray.org/rimmlab/) [46].
Cell proliferation assay
The cell proliferation rate was measured using a Cell Counting Kit-8 (Kaiji, Nanjing, China). Cells were plated in 96-well plates at a density of 2000 cells in 100ul per well and the absorbance was measured at 450 nm with an ELx-800 Universal Microplate Reader. Each experiment was repeated quadruplicate at various time points for 6 days.
Clonogenic assay
For colony formation assays, a total of 100 transfected cells were placed in a fresh six-well plate and maintained in media containing 10% FBS, replacing medium every 3 or 4 days. After two weeks, cells were fixed with 4% paraformaldehyde and stained with 0.1% crystal violet. Visible colonies were manually counted; and each experiment was repeated three times.
Cell invasion, migration, and wound healing assay
For migration assays, transfected cells (40,000 cells in 100ul per well) were plated in the upper chamber of trans-well assay inserts (8 mm pores, Millipore, Billerica, MA) containing 200ul of serum-free RPMI1640 media. The lower chambers were filled with RPMI1640 containing 10% FBS. After 24 h of incubation, cells on the filter surface were fixed with methanol, stained with crystal violet, and photographed. Migration was assessed by counting the number of stained cell nuclei from 5 random fields per filter in each group.
For invasion assays, transfected cells (40,000 cells in 100ul per well) were plated in the top chamber with a matrigel-coated membrane (BD Biosciences) in 300ul serum-free RPMI1640. The bottom chambers were filled with RPMI1640 containing 10% FBS. Invasion was determined after 48 h incubation.
Wound healing assay, cells were seeded and transfected on six-well plates with si-ZYG11A or si-NC, then an artificial scratch wound on a confluent monolayer of H1299 cells was created with a 200-μl pipette tip. Serum-free medium was added for a further 24-h, and cells were imaged 24 h later. Each experiment was repeated three times.
Flow-cytometry analysis
Flow-cytometry analysis was performed detecting cell cycle distribution and cell apoptosis. For cell cycle distribution, cells were transferred and fixed in centrifuge tubes containing 4.5 mL of 70% ethanol on ice. The cells were kept in ethanol for at least 2 h at 4 °C, then centrifuged for 5 min at 300g. Cell pellets were resuspended in 5 mL of PBS for approximately 30s and centrifuged at 300 g for 5 min, then resuspended in 1 mL of PI staining solution and kept in the dark at 37 °C for 10 min. Samples were analyzed using a FACSCalibur flow cytometer. The percentage of the cells in G0–G1, S, and G2–M phase were counted and compared. For apoptosis analysis, briefly, cells were washed and resuspended at a concentration of 1 × 10⁶ cells/ml. Then an Annexin V-FITC Apoptosis Detection Kit (BD Biosciences) was used following the manufacturer’s protocol. After incubation at room temperature in the dark for 20 min, the cells were immediately analyzed by a FACScan flow cytometer (Becton Dickinson, Franklin Lakes, NJ). Each assay was performed in triplicate.
Statistical analysis
Data are presented as means ± S.D. and statistical analysis was performed using Student’s t test or one-way ANOVA, Cox multivariate regression, or Kaplan-Meier survival analysis (SPSS Statistics, version 20.0, Chicago, Ill). P<0.05 were considered statistically significant. The data graphs were made with GraphPad Prism 6.0 software.
ACKNOWLEDGMENTS
We thank Prof. Yide Mei (University of Science and Technology of China) and Prof. Alexandria Von Bazhin (Ludwig-Maximilians University) for their suggestions or revising for the manuscript. We thank Jie Wang (Jiangsu Cancer Hospital) for technical guidance. And we thank Jieyu Chen (Department of Pathology, Nanjing Drum Tower Hospital) for consultation IHC results.
CONFLICTS OF INTEREST
The authors declare no conflicts of interest.
GRANT SUPPORT
This research was supported by the Natural Science Foundation of China (81372321, 81472200 and 81472702), Jiangsu Provincial Special Program of Medical Science Funding (BL2012030), National Science Foundation for Young Scholars (81302013) and Jiangsu Provincial Six talent peak of Human affair Hall Funding (WSN-037).
REFERENCES
1. Jemal A, Bray F, Center MM, Ferlay J, Ward E, Forman D. Global cancer statistics. CA: a cancer journal for clinicians. 2011; 61:69–90.
2. Youlden DR, Cramb SM, Baade PD. The International Epidemiology of Lung Cancer: geographical distribution and secular trends. J Thorac Oncol. 2008; 3:819–831.
3. Subramaniam S, Thakur RK, Yadav VK, Nanda R, Chowdhury S, Agrawal A. Lung cancer biomarkers: State of the art. J Carcinog. 2013; 12:3.
4. Chen J, Zhang D, Zhang W, Tang Y, Yan W, Guo L, Shen B. Clear cell renal cell carcinoma associated microRNA expression signatures identified by an integrated bioinformatics analysis. J Transl Med. 2013; 11:169.
5. Prensner JR, Iyer MK, Balbin OA, Dhanasekaran SM, Cao Q, Brenner JC, Laxman B, Asangani IA, Grasso CS, Kominsky HD, Cao X, Jing X, Wang X, Siddiqui J, Wei JT, Robinson D, et al. Transcriptome sequencing across a prostate cancer cohort identifies PCAT-1, an unannotated lincRNA implicated in disease progression. Nat Biotechnol. 2011; 29:742–749.
6. Qiu M, Xu Y, Wang J, Zhang E, Sun M, Zheng Y, Li M, Xia W, Feng D, Yin R, Xu L. A novel lncRNA, LUADT1, promotes lung adenocarcinoma proliferation via the epigenetic suppression of p27. Cell Death Dis. 2015; 6:e1858.
7. Vasudevan S, Starostina NG, Kipreos ET. The Caenorhabditis elegans cell-cycle regulator ZYG-11 defines a conserved family of CUL-2 complex components. EMBO Rep. 2007; 8:279–286.
8. Liu J, Vasudevan S, Kipreos ET. CUL-2 and ZYG-11 promote meiotic anaphase II and the proper placement of the anterior-posterior axis in C. elegans. Development. 2004; 131:3513–3525.
9. Sonneville R, Gonczy P. Zyg-11 and cul-2 regulate progression through meiosis II and polarity establishment in C. elegans. Development. 2004; 131:3527–3543.
10. Basu M, Bhattacharya R, Ray U, Mukhopadhyay S, Chatterjee U, Roy SS. Invasion of ovarian cancer cells is induced byPITX2-mediated activation of TGF-beta and Activin-A. Mol Cancer. 2015; 14:162.
11. Vela I, Morrissey C, Zhang X, Chen S, Corey E, Strutton GM, Nelson CC, Nicol DL, Clements JA, Gardiner EM. PITX2 and non-canonical Wnt pathway interaction in metastatic prostate cancer. Clin Exp Metastasis. 2014; 31:199–211.
12. Vasiljevic N, Ahmad AS, Carter PD, Fisher G, Berney DM, Foster CS, Cuzick J, Lorincz AT. DNA methylation of PITX2 predicts poor survival in men with prostate cancer. Biomark Med. 2014; 8:1143–1150.
13. Liu Y, Huang Y, Zhu GZ. Cyclin A1 is a transcriptional target of PITX2 and overexpressed in papillary thyroid carcinoma. Mol Cell Biochem. 2013; 384:221–227.
14. Cantile M, Galletta F, Franco R, Aquino G, Scognamiglio G, Marra L, Cerrone M, Malzone G, Manna A, Apice G, Fazioli F, Botti G, De Chiara A. Hyperexpression of HOXC13, located in the 12q13 chromosomal region, in welldifferentiated and dedifferentiated human liposarcomas. Oncol Rep. 2013; 30:2579–2586.
15. Kasiri S, Ansari KI, Hussain I, Bhan A, Mandal SS. Antisense oligonucleotide mediated knockdown of HOXC13 affects cell growth and induces apoptosis in tumor cells and over expression of HOXC13 induces 3D-colony formation. RSC advances. 2013; 3:3260–3269.
16. Cantile M, Scognamiglio G, Anniciello A, Farina M, Gentilcore G, Santonastaso C, Fulciniti F, Cillo C, Franco R, Ascierto PA, Botti G. Increased HOX C13 expression in metastatic melanoma progression. J Transl Med. 2012; 10:91.
17. Levine DM, Ek WE, Zhang R, Liu X, Onstad L, Sather C, Lao-Sirieix P, Gammon MD, Corley DA, Shaheen NJ, Bird NC, Hardie LJ, Murray LJ, Reid BJ, Chow WH, Risch HA, et al. A genome-wide association study identifies new susceptibility loci for esophageal adenocarcinoma and Barrett's esophagus. Nature genetics. 2013; 45:1487–1493.
18. van Nistelrooij AM, van der Korput HA, Broer L, van Marion R, van Berge Henegouwen MI, van Noesel CJ, Biermann K, Spaander MC, Tilanus HW, van Lanschot JJ, Hofman A, Uitterlinden AG, Wijnhoven BP, Dinjens WN. Single nucleotide polymorphisms in CRTC1 and BARX1 are associated with esophageal adenocarcinoma. J Carcinog. 2015; 14:5.
19. Saunders LR, Bankovich AJ, Anderson WC, Aujay MA, Bheddah S, Black K, Desai R, Escarpe PA, Hampl J, Laysang A, Liu D, Lopez-Molina J, Milton M, Park A, Pysz MA, Shao H, et al. A DLL3-targeted antibody-drug conjugate eradicates high-grade pulmonary neuroendocrine tumor-initiating cells in vivo. Science translational medicine. 2015; 7:302ra136.
20. Maemura K, Yoshikawa H, Yokoyama K, Ueno T, Kurose H, Uchiyama K, Otsuki Y. Delta-like 3 is silenced by methylation and induces apoptosis in human hepatocellular carcinoma. Int J Oncol. 2013; 42:817–822.
21. Hussain S, Berki DM, Choon SE, Burden AD, Allen MH, Arostegui JI, Chaves A, Duckworth M, Irvine AD, Mockenhaupt M, Navarini AA, Seyger MM, Soler-Palacin P, Prins C, Valeyrie-Allanore L, Vicente MA, et al. IL36RN mutations define a severe autoinflammatory phenotype of generalized pustular psoriasis. The Journal of allergy and clinical immunology. 2015; 135:1067–1070 e1069.
22. Hayashi M, Nakayama T, Hirota T, Saeki H, Nobeyama Y, Ito T, Umezawa Y, Fukuchi O, Yanaba K, Kikuchi S, Nakagawa H, Tsunemi Y, Shibata S, Sato S, Tada Y, Miyatake A, et al. Novel IL36RN gene mutation revealed by analysis of 8 Japanese patients with generalized pustular psoriasis. J Dermatol Sci. 2014; 76:267–269.
23. Pawlak A, Toussaint C, Levy I, Bulle F, Poyard M, Barouki R, Guellaen G. Characterization of a large population of mRNAs from human testis. Genomics. 1995; 26:151–158.
24. Feral C, Wu YQ, Pawlak A, Guellaen G. Meiotic human sperm cells express a leucine-rich homologue of Caenorhabditis elegans early embryogenesis gene, Zyg-11. Mol Hum Reprod. 2001; 7:1115–1122.
25. Saucedo-Cuevas LP, Ruppen I, Ximenez-Embun P, Domingo S, Gayarre J, Munoz J, Silva JM, Garcia MJ, Benitez J. CUL4A contributes to the biology of basal-like breast tumors through modulation of cell growth and anti-tumor immune response. Oncotarget. 2014; 5:2330–2343. doi: 10.18632/oncotarget.1915
26. Zhang L, Teng Y, Fan Y, Wang Y, Li W, Shi J, Ma Y, Li C, Shi X, Qu X, Liu Y. The E3 ubiquitin ligase Cbl-b improves the prognosis of RANK positive breast cancer patients by inhibiting RANKL-induced cell migration and metastasis. Oncotarget. 2015; 6:22918–22933. doi: 10.18632/oncotarget.4382
27. Wang J, Huang Y, Guan Z, Zhang JL, Su HK, Zhang W, Yue CF, Yan M, Guan S, Liu QQ. E3-ligase Skp2 predicts poor prognosis and maintains cancer stem cell pool in nasopharyngeal carcinoma. Oncotarget. 2014; 5:5591–5601. doi: 10.18632/oncotarget.2149
28. Chen Z, Sui J, Zhang F, Zhang C. Cullin family proteins and tumorigenesis: genetic association and molecular mechanisms. J Cancer. 2015; 6:233–242.
29. Sarikas A, Hartmann T, Pan ZQ. The cullin protein family. Genome Biol. 2011; 12:220.
30. Huang LN, Wang DS, Chen YQ, Li W, Hu FD, Gong BL, Zhao CL, Jia W. Meta-analysis for cyclin E in lung cancer survival. Clin Chim Acta. 2012; 413:663–668.
31. Velasco-Velazquez MA, Li Z, Casimiro M, Loro E, Homsi N, Pestell RG. Examining the role of cyclin D1 in breast cancer. Future oncology (London, England). 2011; 7:753–765.
32. Freemantle SJ, Dmitrovsky E. Cyclin E transgenic mice: discovery tools for lung cancer biology, therapy, and prevention. Cancer Prev Res (Phila). 2010; 3:1513–1518.
33. Han Z, Zhang Y, Yang Q, Liu B, Wu J, Zhang Y, Yang C, Jiang Y. miR-497 and miR-34a retard lung cancer growth by co-inhibiting cyclin E1 (CCNE1). Oncotarget. 2015; 6:13149–13163. doi: 10.18632/oncotarget.3693
34. Zschemisch NH, Liedtke C, Dierssen U, Nevzorova YA, Wustefeld T, Borlak J, Manns MP, Trautwein C. Expression of a cyclin E1 isoform in mice is correlated with the quiescent cell cycle status of hepatocytes in vivo. Hepatology. 2006; 44:164–173.
35. Uhlen M, Bjorling E, Agaton C, Szigyarto CA, Amini B, Andersen E, Andersson AC, Angelidou P, Asplund A, Asplund C, Berglund L, Bergstrom K, Brumer H, Cerjan D, Ekstrom M, Elobeid A, et al. A human protein atlas for normal, cancer tissues based on antibody proteomics. Mol Cell Proteomics. 2005; 4:1920–1932.
36. Uhlen M, Fagerberg L, Hallstrom BM, Lindskog C, Oksvold P, Mardinoglu A, Sivertsson A, Kampf C, Sjostedt E, Asplund A, Olsson I, Edlund K, Lundberg E, Navani S, Szigyarto CA, Odeberg J, et al. Proteomics. Tissue-based map of the human proteome. Science. 2015; 347:1260419.
37. Uhlen M, Oksvold P, Fagerberg L, Lundberg E, Jonasson K, Forsberg M, Zwahlen M, Kampf C, Wester K, Hober S, Wernerus H, Bjorling L, Ponten F. Towards a knowledge-based Human Protein Atlas. Nat Biotechnol. 2010; 28:1248–1250.
38. Ponten F, Jirstrom K, Uhlen M. The Human Protein Atlas—a tool for pathology. J Pathol. 2008; 216:387–393.
39. Dugo M, Nicolini G, Tragni G, Bersani I, Tomassetti A, Colonna V, Del Vecchio M, De Braud F, Canevari S, Anichini A, Sensi M. A melanoma subtype with intrinsic resistance to BRAF inhibition identified by receptor tyrosine kinases gene-driven classification. Oncotarget. 2015; 6:5118–5133. doi: 10.18632/oncotarget.3007
40. Gao J, Aksoy BA, Dogrusoz U, Dresdner G, Gross B, Sumer SO, Sun Y, Jacobsen A, Sinha R, Larsson E, Cerami E, Sander C, Schultz N. Integrative analysis of complex cancer genomics and clinical profiles using the cBioPortal. Sci Signal. 2013; 6:pl1.
41. Huang da W, Sherman BT, Lempicki RA. Systematic and integrative analysis of large gene lists using DAVID bioinformatics resources. Nat Protoc. 2009; 4:44–57.
42. Shen X, Xie B, Ma Z, Yu W, Wang W, Xu D, Yan X, Chen B, Yu L, Li J, Chen X, Ding K, Cao F. Identification of novel long non-coding RNAs in triple-negative breast cancer. Oncotarget. 2015; 6:21730–21739. doi: 10.18632/oncotarget.4419
43. Kang G, Yun H, Sun CH, Park I, Lee S, Kwon J, Do I, Hong ME, Vrancken MV, Lee J, Park JO, Cho J, Kim KM, Sohn TS. Integrated genomic analyses identify frequent gene fusion events and VHL inactivation in gastrointestinal stromal tumors. Oncotarget. 2015. doi: 10.18632/oncotarget.3731
44. Schottle J, Chatterjee S, Volz C, Siobal M, Florin A, Rokitta D, Hinze Y, Dietlein F, Plenker D, Konig K, Albus K, Heuckmann JM, Rauh D, Franz T, Neumaier B, Fuhr U, et al. Intermittent high-dose treatment with erlotinib enhances therapeutic efficacy in EGFR-mutant lung cancer. Oncotarget. 2015; 6:38458–38468. doi: 10.18632/oncotarget.6276
45. Yang X, Zhang Z, Qiu M, Hu J, Fan X, Wang J, Xu L, Yin R. Glypican-5 is a novel metastasis suppressor gene in non-small cell lung cancer. Cancer Lett. 2013; 341:265–273.
46. Lu C, Wang X, Zhu H, Feng J, Ni S, Huang J. Over-expression of ROR2 and Wnt5a cooperatively correlates with unfavorable prognosis in patients with non-small cell lung cancer. Oncotarget. 2015; 6:24912–24921. doi: 10.18632/oncotarget.4701