
INTRODUCTION
Prevalence of overweight and obesity has shown a significant increase during the last decades [1, 2]. Besides higher risk of cardiovascular disease and diabetes, evidence suggests that the excess body weight is also associated with higher cancer risk [3, 4]. However, it is still controversial with respect to cancer motality.
Body mass index (BMI) is a person’s weight in kilograms divided by the square of height in meters. It is an attempt to quantify the amount of tissue mass (muscle, fat, and bone), and then categorize that individual as underweight, normal weight, overweight, or obese. By the analysis of more than 2.88 million individuals, Flegal et al. concluded that obesity was associated with higher mortality, while overweight was associated with lower mortality [5, 6]. However, they did not specify the cancer population, and little conclusion could be drawn when focusing on cancer patients.
The cancer genome atlas (TCGA) project motivated large-scale coordinated cancer genomic efforts to obtain complete catalogs of the genomic alterations in cancer. Besides the comprehensive molecular profiling of each tumor, it also provides valuable clinical data [7]. In the present study, we used the survival data of over 2000 cancer patients (14 tumor types) from the TCGA project, to identify the roles of overweight and obesity in the prognosis of cancer.
RESULTS
Patient demographics and outcomes
All TCGA cancer data were downloaded (34 tumor types, 11091 patients). However, only 14 tumor types (2670 patients) had the complete data of height, weight, and survival information [Uveal Melanoma (UVM), Uterine Corpus Endometrial Carcinoma (UCEC), Uterine Carcinosarcoma (UCS), Thymoma (THYM), Skin Cutaneous Melanoma (SKCM), Rectum adenocarcinoma (READ), Lymphoid Neoplasm Diffuse Large B-cell Lymphoma (DLBC), Liver hepatocellular carcinoma (LIHC), Kidney renal papillary cell carcinoma (KIRP), Esophageal carcinoma (ESCA), Colon adenocarcinoma (COAD), Cholangiocarcinoma (CHOL), Cervical squamous cell carcinoma and endocervical adenocarcinoma (CESC) and Bladder Urothelial Carcinoma (BLCA)]. Thus, 2670 patients of 14 tumor types were included for analysis.
Clinical characteristics were listed in Table 1. There were 1222 men and 1448 women. The mean age was 61.3, with the average height of 167 cm and average weight of 79.9 kg. Most patients received surgical therapy, since the TCGA project requires resected tissues for genome analysis. The median survival time was 102.4 months (95% CI, 92.7-114.7). At the time of analysis, 2195 patients were alive, and 475 patients were dead.
Table 1: Baseline characteristics of the cancer patients
Cancer Type |
Age |
Gender |
Stage (I/II/III/IV/unavailable) |
height |
weight |
BMI |
|---|---|---|---|---|---|---|
UVM |
61.3±13.7 |
28/25 |
0/17/32/3/1 |
166.5±10.7 |
79.4±22.8 |
28.7±8.9 |
UCEC |
63.7±11.1 |
0/515 |
322/49/115/29/0 |
161.2±8.2 |
87.7±25.4 |
33.9±12.1 |
UCS |
69.5±9.2 |
0/52 |
22/5/16/9/0 |
157.7±7.7 |
73.3±20.2 |
29.6±9.0 |
THYM |
59.1±13.0 |
53/47 |
30/51/13/6/0 |
167.3±11.1 |
76.8±19.6 |
27.3±6.1 |
SKCM |
59.5±15.3 |
143/99 |
34/89/94/11/14 |
170.1±9.4 |
81.4±19.3 |
28.1±6.1 |
READ |
60.5±11.7 |
44/31 |
9/20/31/13/2 |
170.7±9.6 |
79.1±22.5 |
26.9±5.8 |
DLBC |
56.3±14.1 |
21/26 |
8/17/4/12/6 |
164.9±9.1 |
71.0±18.4 |
26.0±5.9 |
LIHC |
59.5±12.8 |
231/105 |
163/77/76/4/16 |
167.4±10.7 |
73.0±19.6 |
26.2±8.4 |
KIRP |
61.1±12.0 |
144/46 |
113/13/30/9/25 |
172.1±14.4 |
87.6±21.2 |
32.1±33.3 |
ESCA |
62.3±11.7 |
151/24 |
18/73/53/9/22 |
172.1±8.6 |
75.1±19.1 |
25.3±5.9 |
COAD |
64.3±13.1 |
124/108 |
32/93/76/25/6 |
168.4±12.3 |
81.2±20.2 |
29.4±17.2 |
CHOL |
63.4±12.9 |
16/19 |
19/8/1/7/0 |
167.3±11.7 |
79.2±20.6 |
28.0±5.3 |
CESC |
48.5±13.5 |
0/258 |
132/62/39/20/5 |
160.8±7.3 |
72.4±19.9 |
28.0±7.7 |
BLCA |
67.7±10.5 |
267/93 |
2/117/119/120/2 |
171.6±10.2 |
80.3±21.1 |
27.1±6.2 |
OVERALL |
61.3±13.4 |
1222/1448 |
904/691/699/277/99 |
167.0±11.0 |
79.9±22.0 |
29.0±13.1 |
UVM, Uveal Melanoma; UCEC, Uterine Corpus Endometrial Carcinoma; UCS, Uterine Carcinosarcoma; THYM, Thymoma; SKCM, Skin Cutaneous Melanoma; READ, Rectum adenocarcinoma; DLBC, Lymphoid Neoplasm Diffuse Large B-cell Lymphoma; LIHC, Liver hepatocellular carcinoma; KIRP, Kidney renal papillary cell carcinoma; ESCA, Esophageal carcinoma; COAD, Colon adenocarcinoma; CHOL, Cholangiocarcinoma; CESC, Cervical squamous cell carcinoma and endocervical adenocarcinoma; BLCA, Bladder Urothelial Carcinoma.
Analyses of the cancer patients in the whole population
In this study, we applied the National Heart, Lung, and Blood Institute’s BMI categories of underweight (BMI<18.5), normal weight (18.5 ≤ BMI < 25), overweight (25 ≤ BMI < 30), and obesity (BMI ≥ 30). Grade 1 obesity was defined as a BMI of 30 to less than 35; grade 2 obesity, a BMI of 35 to less than 40; and grade 3 obesity, a BMI of 40 or greater [5, 6].
To gain insight into the prognostic role of obesity, we utilized the Kaplan-Meier curves stratified by different BMI groups. As shown in Figure 1A–1D, patients with grade 1, grade 2 and grade 3 obesity, showed significantly lower mortality (P < 0.05). We combined the grade 2 and grade 3 patients into one group, simply because the sample size is relatively small in grade 2 and grade 3. Although lower mortality was observed in overweight group, and higher mortality was observed in underweight group, they didn’t reach statistical significance. In addition, cox regression analysis also confirmed the lower mortality in grade 1 obesity (HR=0.76, 95%CI, 0.58-0.99, P = 0.049), grade 2 and grade 3 obesity (HR=0.63, 95%CI, 0.46-0.85, P < 0.001), but not in the overweight group (HR=0.87, 95%CI, 0.70-1.08, P = 0.19), or in the underweight group (HR=1.50, 95%CI, 0.91-2.47, P = 0.115).
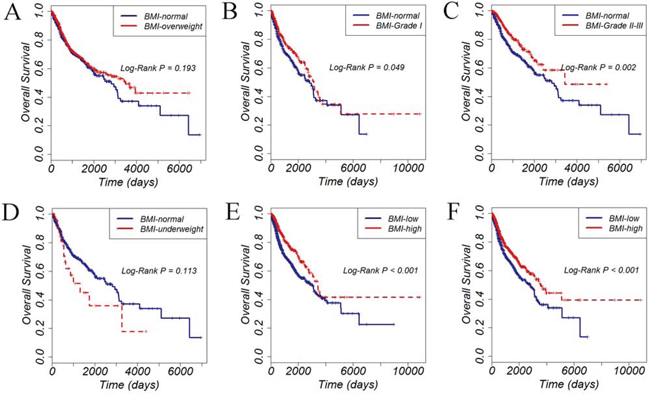
Figure 1: Overall survival of 2670 cancer patients stratified by different BMI groups. A. overweight versus normal weight; B. Grade 1 obesity versus normal weight; C. Grade 2 and Grade 3 obesity versus normal weight; D. underweight versus normal weight; E. high BMI value versus low BMI value, with the BMI cutoff determined by ROC curve; F. high BMI value versus low BMI value, with the BMI cutoff determined by median value.
We then used the receiver operating characteristic (ROC) curves to determine the cutoff value of BMI. Thus, the BMI value of 31.2 (determined by the ROC curve) and 27.0 (median value)were used to explore the prognostic value of obesity, respectively. As shown in Figure 1E–1F, patients with higher BMI values showed lower mortality, no matter stratified by the ROC cutoff value (Figure 1E) or the median value (Figure 1F).
In univariable analysis, age (HR=1.60, 95%CI, 1.34-1.92, P < 0.001), tumor stage (HR=2.63, 95%CI, 2.18-3.17, P < 0.001), and the BMI values (HR=0.62, 95%CI, 0.49-0.77, P < 0.001) were significantly associated with the overall survival (Table 3). Multivariate analysis showed that age (HR=1.47, 95%CI, 1.22-1.77, P < 0.001), tumor stage (HR=2.52, 95%CI, 2.09-3.04, P < 0.001), and the BMI values (HR=0.64, 95%CI, 0.51-0.81, P < 0.001) were still significantly associated with the overall survival (Table 2).
Table 2: Univariate and multivariate analysis in the whole population
Clinical Variables |
univariate analysis |
multivariate analysis |
||
|---|---|---|---|---|
HR(95%CI) |
P |
HR(95%CI) |
P |
|
Age(>=67 vs <67) |
1.60(1.34-1.92) |
<0.001 |
1.47(1.22-1.77) |
<0.001 |
Gender(male vs female) |
1.12(0.90-1.40) |
0.33 |
||
Stage(III-IV vs I-II) |
2.63(2.18-3.17) |
<0.001 |
2.52(2.09-3.04) |
<0.001 |
BMI(high vs low) |
0.62(0.49-0.77) |
<0.001 |
0.64(0.51-0.81) |
<0.001 |
Table 3: Cox regression analysis of patients in each cancer type
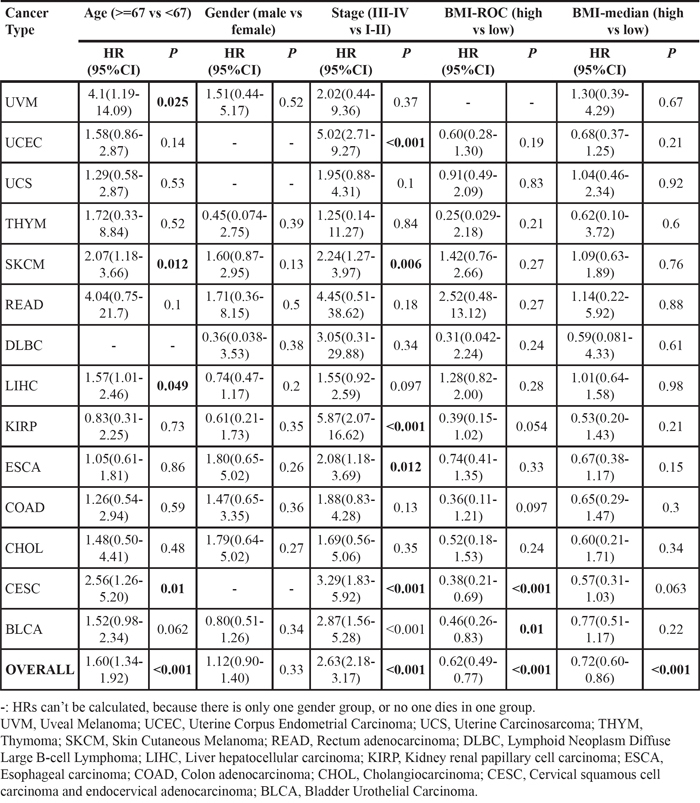
Analyses of the cancer patients in each tumor type
Our above data showed that obesity might indicate a lower mortality in the whole population of cancer patients. Next we sought to find out the specific associations in different cancer types.
Unexpectedly, no significant associations were found in any of the tumor type by the log-rank test (data not shown) or cox regression analysis (Figure 2A–2C). However, when we set the BMI value as a binary categorical variable, patients with higher BMI values (cutoff by the ROC curve, not by the median value) of BLCA and CESC showed significantly lower mortality (Figure 2D–2E). On the other hand, when we set the BMI as a continuous variable, patients with higher BMI values of BLCA and CESC also showed significantly lower mortality (Figure 2F).
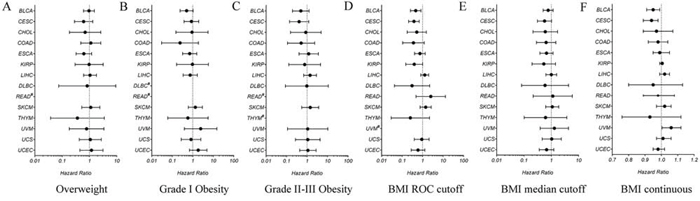
Figure 2: Hazard ratios for all-cause mortality relative to normal weight in different BMI groups in each cancer type A. overweight versus normal weight; B. Grade 1 obesity versus normal weight; C. Grade 2 and Grade 3 obesity versus normal weight; D. high BMI value versus low BMI value, with the BMI cutoff determined by ROC curve; E. high BMI value versus low BMI value, with the BMI cutoff determined by median value; F. high BMI value versus low BMI value, with BMI as a continuous variable. UVM, Uveal Melanoma; UCEC, Uterine Corpus Endometrial Carcinoma; UCS, Uterine Carcinosarcoma; THYM, Thymoma; SKCM, Skin Cutaneous Melanoma; READ, Rectum adenocarcinoma; DLBC, Lymphoid Neoplasm Diffuse Large B-cell Lymphoma; LIHC, Liver hepatocellular carcinoma; KIRP, Kidney renal papillary cell carcinoma; ESCA, Esophageal carcinoma; COAD, Colon adenocarcinoma; CHOL, Cholangiocarcinoma; CESC, Cervical squamous cell carcinoma and endocervical adenocarcinoma; BLCA, Bladder Urothelial Carcinoma.
This relationship was also verified by the cox regression analysis, which demonstrated that higher BMI value was correlated with lower mortality in CESC and BLCA (P < 0.05, Table 3 ). In addition, cox regression analysis also showed that some other variables, such as age and tumor stage, were also correlated with mortality in some cancer types (Table 3).
DISCUSSION
In this study, we systemically report that postdiagnosis obesity might indicate a better prognosis in cancer patients. The association of obesity and cancer risk has been extensively explored. The mechanisms included insulin resistance and resultant chronic hyperinsulinaemia, increased bioavailability of steroid hormones, and localized chronic inflammation [8–12]. However, it is still controversial with respect to cancer motality.
Calle et al. reported that obesity was a negative prognosis factor for cancer by analyzing the largest cohort of patients in the US [13]. Reeves et al. provided similar results through the analysis in the UK [14]. These studies assessed the BMI before cancer development, leading to the popular perspective that prediangosis obesity indicated poor prognosis [15, 16]. However, discrepancies emerged when Schlesinger et al. indicated a decreased mortality risk among overweight colorectal cancer survivors (HR=0.79, 95%CI, 0.71-0.88, P < 0.05). We realized that they assessed the BMI after cancer development, which is consistent with our study (HR=0.64, 95%CI, 0.51-0.81, P < 0.001) [17].
Our results supported the survival advantage conferred by obesity where energy balance is likely to be negative[18, 19]. It’s not hard to imagine that cachexia might indicate a poor prognosis[20]. However, when the patient suffers obesity before the development of cancer, side effects such as diabetes and cardiovascular diseases might have more impact on survial, which explains the results by Calle et al. and Reeves et al. In our study, besides the whole cancer population, only cervical cancer and bladder cancer showed lower mortality in patients with higher BMI values. We speculate that, the sample size is relatively large (>250) in cervical cancer and bladder cancer in our study, which might improve the statistical power in these patients. On the other hand, due to some hidden mechanisms, maybe the negative energy balance is more likely to affect the survival in these cancer types.
There are some limitations in our studies. Firstly, these findings should be interpreted cautiously because of small sample size. Secondly, we don’t have the postdiagnosis weight loss data, which is a better evidence to demonstrate the impact of large energy store on cancer mortality. In conclusion, our data demonstrate that postdiagnosis obesity might indicate a lower cancer mortality.
MATERIALS AND METHODS
Patient samples
Clinical and survival data for 2670 cancer patients from 14 tumor types were obtained from the TCGA data portal (https://tcga-data.nci.nih.gov/tcga/) on July 24, 2015. The study was approved by the TCGA project manager and the Institutional Review Board of the Xi’an Jiaotong University.
Clinical and follow-up data collection
Patient clinical data, including age, gender, height, weight and tumor stage were collected. Follow-up data such as vital status and survival time were also recoreded. We only included the patients with available BMI data.
Statistical analysis
All data were analyzed by the R version 3.2.0 software and the SPSS version 19.0 software (SPSS, Chicago, IL, United States). Survival curves were constructed by the Kaplan-Meier method and compared by the log-rank test. The BMI cutoff points were determined by the receiver operating characteristic (ROC) curve analysis. Cox regression analysis was performed to evaluate the prognostic significance of the variables. Results are given as mean ± SD. P < 0.05 was considered statistically significant.
ACKNOWLEDGMENT
We acknowledge contributions of the TCGA Research Network and the TCGA Pan-Cancer Analysis Working Group. There is no potential conflict of interest. The protocol for the research has been approved by the Ethics Committee of institution and it conforms to the provisions of the Declaration of Helsinki.
CONFLICTS OF INTEREST
There is no potential conflicts of interest to disclose.
FUNDINGS
This research was supported by the Natural Science Foundation of China, No. 81402022 and No. 81472247, and the Fund of China Scholarship Council, No. 201406280106.
Author’s contributions
Xinsen Xu: Designed the research and wrote the paper; Lei Zhou, Runchen Miao, Wei Chen, Yanyan Zhou, Qing Pang, Kai Qu: Collected and analyzed data; Chang Liu: Designed the research.
REFERENCES
1. Flegal KM, Carroll MD, Kit BK and Ogden CL. Prevalence of obesity and trends in the distribution of body mass index among US adults, 1999–2010. Jama. 2012; 307:491–497.
2. Yang L and Colditz GA. Prevalence of Overweight and Obesity in the United States, 2007–2012. JAMA internal medicine. 2015; 175:1412–1413.
3. Bianchini F, Kaaks R and Vainio H. Overweight, obesity, and cancer risk. The Lancet Oncology. 2002; 3:565–574.
4. Rapp K, Schroeder J, Klenk J, Stoehr S, Ulmer H, Concin H, Diem G, Oberaigner W and Weiland SK. Obesity and incidence of cancer: a large cohort study of over 145,000 adults in Austria. British journal of cancer. 2005; 93:1062–1067.
5. Flegal KM, Kit BK, Orpana H and Graubard BI. Association of all-cause mortality with overweight and obesity using standard body mass index categories: a systematic review and meta-analysis. Jama. 2013; 309:71–82.
6. Clinical guidelines on the identification, evaluation, and treatment of overweight and obesity in adults: executive summary. Expert Panel on the Identification, Evaluation, and Treatment of Overweight in Adults. The American journal of clinical nutrition. 1998; 68:899–917.
7. Cancer Genome Atlas Research N, Weinstein JN, Collisson EA, Mills GB, Shaw KR, Ozenberger BA, Ellrott K, Shmulevich I, Sander C and Stuart JM. The Cancer Genome Atlas Pan-Cancer analysis project. Nature genetics. 2013; 45:1113–1120.
8. Calle EE and Kaaks R. Overweight, obesity and cancer: epidemiological evidence and proposed mechanisms. Nature reviews Cancer. 2004; 4:579–591.
9. Basen-Engquist K and Chang M. Obesity and cancer risk: recent review and evidence. Current oncology reports. 2011; 13:71–76.
10. Renehan AG, Frystyk J and Flyvbjerg A. Obesity and cancer risk: the role of the insulin-IGF axis. Trends in endocrinology and metabolism. 2006; 17:328–336.
11. Roberts DL, Dive C and Renehan AG. Biological mechanisms linking obesity and cancer risk: new perspectives. Annual review of medicine. 2010; 61:301–316.
12. van Kruijsdijk RC, van der Wall E and Visseren FL. Obesity and cancer: the role of dysfunctional adipose tissue. Cancer epidemiology, biomarkers & prevention. 2009; 18:2569–2578.
13. Calle EE, Rodriguez C, Walker-Thurmond K and Thun MJ. Overweight, obesity, and mortality from cancer in a prospectively studied cohort of U.S. adults. The New England journal of medicine. 2003; 348:1625–1638.
14. Reeves GK, Pirie K, Beral V, Green J, Spencer E, Bull D and Million Women Study C. Cancer incidence and mortality in relation to body mass index in the Million Women Study: cohort study. Bmj. 2007; 335:1134.
15. Campbell PT, Newton CC, Dehal AN, Jacobs EJ, Patel AV and Gapstur SM. Impact of body mass index on survival after colorectal cancer diagnosis: the Cancer Prevention Study-II Nutrition Cohort. Journal of clinical oncology. 2012; 30:42–52.
16. Berrington de Gonzalez A, Hartge P, Cerhan JR, Flint AJ, Hannan L, MacInnis RJ, Moore SC, Tobias GS, Anton-Culver H, Freeman LB, Beeson WL, Clipp SL, English DR, Folsom AR, Freedman DM, Giles G, et al. Body-mass index and mortality among 1.46 million white adults. The New England journal of medicine. 2010; 363:2211–2219.
17. Schlesinger S, Siegert S, Koch M, Walter J, Heits N, Hinz S, Jacobs G, Hampe J, Schafmayer C and Nothlings U. Postdiagnosis body mass index and risk of mortality in colorectal cancer survivors: a prospective study and meta-analysis. Cancer causes & control. 2014; 25:1407–1418.
18. Kalantar-Zadeh K, Horwich TB, Oreopoulos A, Kovesdy CP, Younessi H, Anker SD and Morley JE. Risk factor paradox in wasting diseases. Current opinion in clinical nutrition and metabolic care. 2007; 10:433–442.
19. Baade PD, Meng X, Youl PH, Aitken JF, Dunn J and Chambers SK. The impact of body mass index and physical activity on mortality among patients with colorectal cancer in Queensland, Australia. Cancer epidemiology, biomarkers & prevention. 2011; 20:1410–1420.
20. Martin L, Birdsell L, Macdonald N, Reiman T, Clandinin MT, McCargar LJ, Murphy R, Ghosh S, Sawyer MB and Baracos VE. Cancer cachexia in the age of obesity: skeletal muscle depletion is a powerful prognostic factor, independent of body mass index. Journal of clinical oncology. 2013; 31:1539–1547.